. 2024 Mar;28(6):e18156.
doi: 10.1111/jcmm.18156.

Identification of crosstalk genes relating to ECM-receptor interaction genes in MASH and DN using bioinformatics and machine learning

Affiliations

Identification of crosstalk genes relating to ECM-receptor interaction genes in MASH and DN using bioinformatics and machine learning

Chao Chen et al. J Cell Mol Med. 2024 Mar.

Abstract

This study aimed to identify genes shared by metabolic dysfunction-associated fatty liver disease (MASH) and diabetic nephropathy (DN) and the effect of extracellular matrix (ECM) receptor interaction genes on them. Datasets with MASH and DN were downloaded from the Gene Expression Omnibus (GEO) database. Pearson's coefficients assessed the correlation between ECM-receptor interaction genes and cross talk genes. The coexpression network of co-expression pairs (CP) genes was integrated with its protein-protein interaction (PPI) network, and machine learning was employed to identify essential disease-representing genes. Finally, immuno-penetration analysis was performed on the MASH and DN gene datasets using the CIBERSORT algorithm to evaluate the plausibility of these genes in diseases. We found 19 key CP genes. Fos proto-oncogene (FOS), belonging to the IL-17 signalling pathway, showed greater centrality PPI network; Hyaluronan Mediated Motility Receptor (HMMR), belonging to ECM-receptor interaction genes, showed most critical in the co-expression network map of 19 CP genes; Forkhead Box C1 (FOXC1), like FOS, showed a high ability to predict disease in XGBoost analysis. Further immune infiltration showed a clear positive correlation between FOS/FOXC1 and mast cells that secrete IL-17 during inflammation. Combining the results of previous studies, we suggest a FOS/FOXC1/HMMR regulatory axis in MASH and DN may be associated with mast cells in the acting IL-17 signalling pathway. Extracellular HMMR may regulate the IL-17 pathway represented by FOS through the Mitogen-Activated Protein Kinase 1 (ERK) or PI3K-Akt-mTOR pathway. HMMR may serve as a signalling carrier between MASH and DN and could be targeted for therapeutic development.

Keywords: DN; ECM-receptor interaction; MASH; XGBoost; immune infiltration.


Conflict of interest statement

The authors declare that they have no known competing financial interests or personal relationships that could have appeared to influence the work reported in this paper.

Figures

FIGURE 1
FIGURE 1
Volcano map and heatmap of DEGs in MASH and DN. (A and B) Volcano map of MASH and DN genes datasets. | log2 (fold change) | > 0.6, padj <0.05; (C and D) Heatmap of MASH and DN genes datasets. Each row represents a gene, and the colour represents the expression level. The colour bar in the upper right corner of the figure is used as a reference for gene expression levels.
FIGURE 2
FIGURE 2
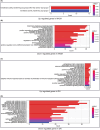
Go enrichment analysis of DEGs. GO hierarchy contains three sub‐ontologies (BP, MF and CC). The statistical method is BH (Benjamini and Hochberg) correction, and the top 20 terms were shown in the barplot.
FIGURE 3
FIGURE 3
Enrichment analysis of crosstalk genes. (A) Venn diagram of the intersection of MASH and DN genes; (B) TOP20 GO BP terms of crosstalk genes; (C) TOP20 KEGG pathways of crosstalk genes.
FIGURE 4
FIGURE 4
KEGG analysis of crosstalk genes and ECM‐receptor interaction genes. The red font in the circled diagram indicates genes flanked by KEGG pathways.
FIGURE 5
FIGURE 5
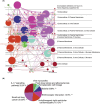
Distribution map analysis of crosstalk genes and ECM‐receptor interaction genes. (A) Cerebral plot of the network with ClueGO terms/pathways; (B) Pie plot of ClueGO terms/pathways. ** p‐value < 0.01.
FIGURE 6
FIGURE 6
Construction of PPI subnetwork and function enrichment analysis. (A) PPI network communities analysis, Crosstalk genes are shown in blue, ECM‐receptor interaction genes are shown in orange; (B) MF enrichment analysis of Cluster 1; (C) KEGG enrichment analysis of Cluster 1; (D) MF enrichment analysis of Cluster 2; (E) KEGG enrichment analysis of Cluster 2.
FIGURE 7
FIGURE 7
Hub and CP genes in subcluster. (A) Hub and CP genes in Cluster 1; (B) Hub and CP genes in Cluster 2; The yellow to red indicates the hub gene. Crosstalk genes are shown in blue, and ECM‐receptor interaction genes are shown in orange.
FIGURE 8
FIGURE 8
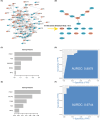
The coexpression network of CP genes and their features in XGBoost. (A) The coexpression network of CP genes; (B) CP gene of AUC >0.6; (C) Top five genes of feature's importance score in MASH; (D) Overall prediction score of XGBoost model in MASH; (E) Top five genes of feature's importance score in DN; (F) overall prediction score of XGBoost model in DN.
FIGURE 9
FIGURE 9
Functional pathways of key CP genes. (A) Analysis of correlation between FOXC1 and HMMR in MASH; (B) Analysis of correlation between FOXC1 and HMMR in DN; (C) KEGG‐enrichment analysis of key CP genes; (D) PPI network of key CP genes. Yellow star‐marked orbs represent ECM‐receptor interacting genes.
FIGURE 10
FIGURE 10
Immune infiltration. (A) Composition of immune cells in MASH; (B) Composition of immune cells in DN; (C) Quantitative differences in the composition of immune cells in MASH; (D) Quantitative differences in the composition of immune cells in DN. *p‐value <0.05, **p‐value <0.01, ***p‐value <0.001, ****p‐value <0.0001.
FIGURE 11
FIGURE 11
Relationship between FOS/FOXC1/HMMR and IL‐17. AP‐1, Activator protein 1; C/EBP, CCAAT Enhancer Binding Protein; CD44, Cluster of Differentiation 44; ELK1, ETS Transcription Factor ELK1; ERK, Extracellular Signal‐Regulated Kinase; FOS, Fos Proto‐Oncogene; FOXC1, Forkhead Box C1; HDAC1, Histone Deacetylase 1; HIF‐1 α, Hypoxia Inducible Factor 1 Subunit Alpha; HMMR, Hyaluronan Mediated Motility Receptor; IL‐17, Interleukin 17; JNK, c‐Jun N‐terminal kinase; JUN, Jun Proto‐Oncogene; mTORC1, Mechanistic target of rapamycin complex 1; NF‐kB, Nuclear factor kappa B; p38, p38 MAPK; RORγt, Retinoic Acid‐related Orphan Receptor Gamma T; ROS, Reactive Oxygen Species; RUNX 1, RUNX Family Transcription Factor 1; S6K1, Ribosomal Protein S6 Kinase Beta‐1; S6K2, Ribosomal Protein S6 Kinase Beta‐2; STAT3, Signal Transducer And Activator Of Transcriptibon 3; TLE3, TLE family member 3.

References

    1. Jarvis H, Craig D, Barker R, et al. Metabolic risk factors and incident advanced liver disease in non‐alcoholic fatty liver disease (NAFLD): A systematic review and meta‐analysis of population‐based observational studies. PLoS Med. 2020;17:e1003100. - PMC - PubMed
    1. Fernando DH, Forbes JM, Angus PW, Herath CB. Development and progression of non‐alcoholic fatty liver disease: the role of advanced glycation end products. Int J Mol Sci. 2019;20:5037. - PMC - PubMed
    1. Gofton C, Upendran Y, Zheng M‐H, George J. MAFLD: how is it different from NAFLD? Clin Mol Hepatol. 2023;29:S17‐S31. - PMC - PubMed
    1. Eslam M, Newsome PN, Sarin SK, et al. A new definition for metabolic dysfunction‐associated fatty liver disease: an international expert consensus statement. J Hepatol. 2020;73:202‐209. - PubMed
    1. Sumida Y, Yoneda M, Toyoda H, et al. Common drug pipelines for the treatment of diabetic nephropathy and hepatopathy: can we kill two birds with one stone? Int J Mol Sci. 2020;21:4939. - PMC - PubMed

Publication types

Substances