. 2024 Mar;602(5):891-912.
doi: 10.1113/JP285014. Epub 2024 Mar 1.

Reorganization of mitochondria-organelle interactions during postnatal development in skeletal muscle

Affiliations

Reorganization of mitochondria-organelle interactions during postnatal development in skeletal muscle

Yuho Kim et al. J Physiol. 2024 Mar.

Abstract

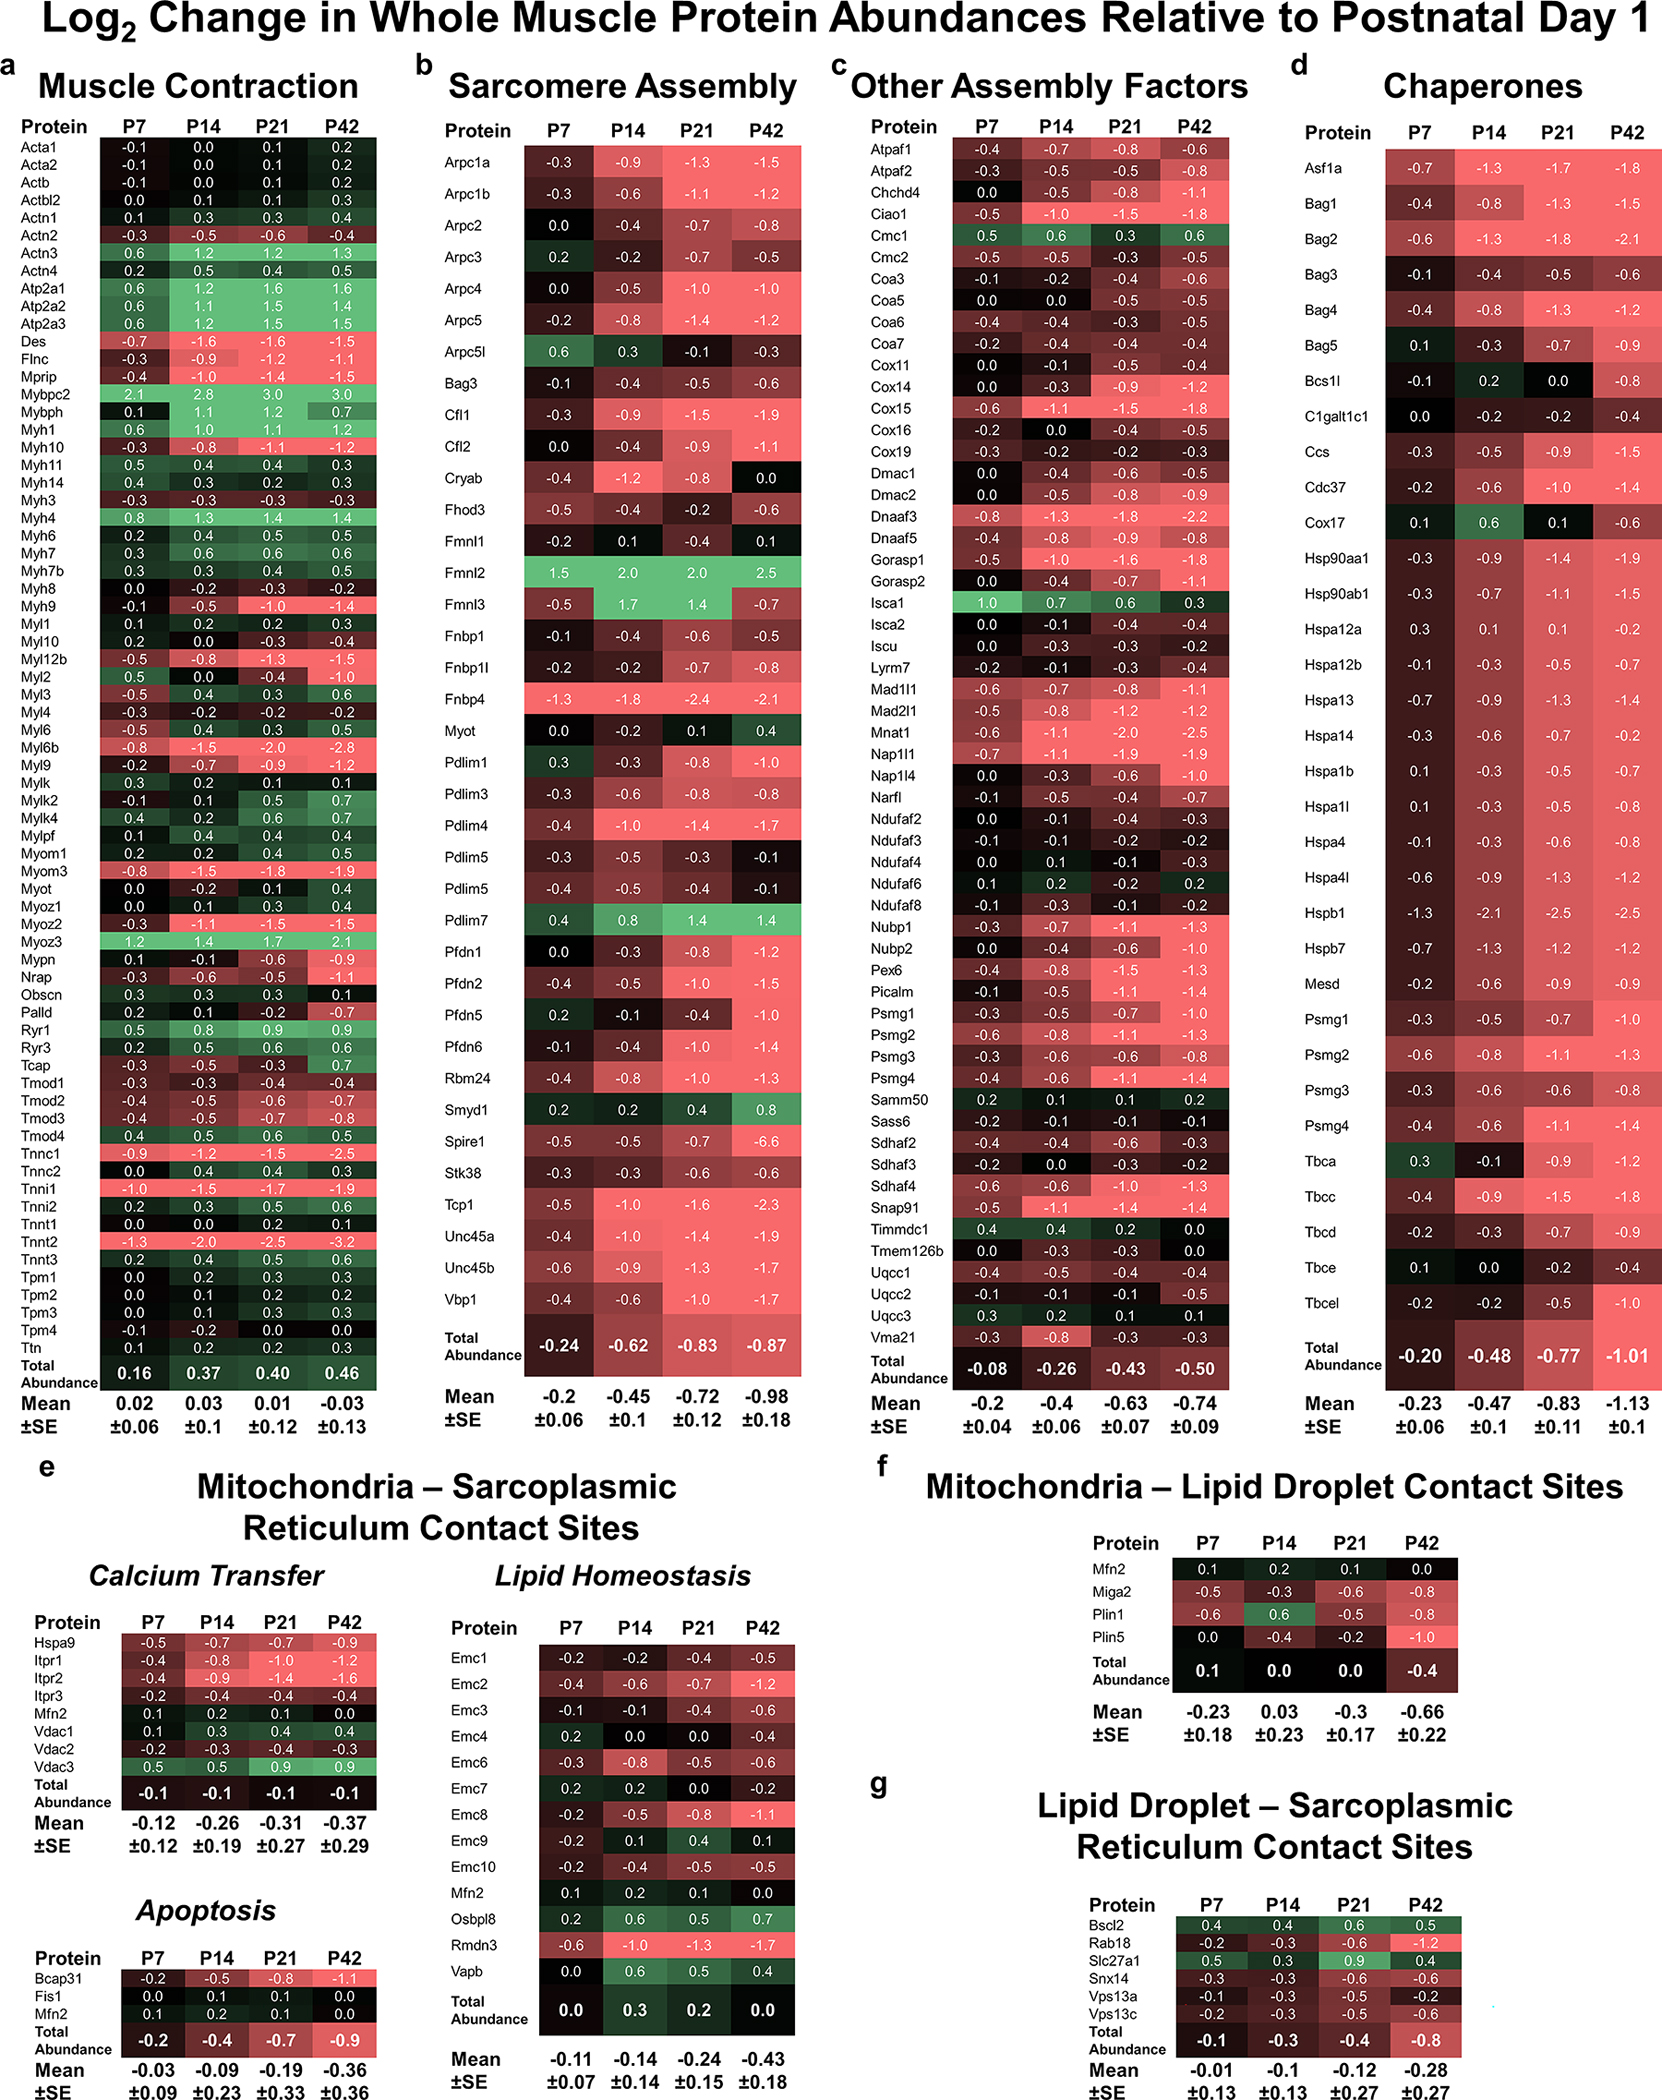
Skeletal muscle cellular development requires the integrated assembly of mitochondria and other organelles adjacent to the sarcomere in support of muscle contractile performance. However, it remains unclear how interactions among organelles and with the sarcomere relates to the development of muscle cell function. Here, we combine 3D volume electron microscopy, proteomic analyses, and live cell functional imaging to investigate the postnatal reorganization of mitochondria-organelle interactions in skeletal muscle. We show that while mitochondrial networks are disorganized and loosely associated with the contractile apparatus at birth, contact sites among mitochondria, lipid droplets and the sarcoplasmic reticulum are highly abundant in neonatal muscles. The maturation process is characterized by a transition to highly organized mitochondrial networks wrapped tightly around the muscle sarcomere but also to less frequent interactions with both lipid droplets and the sarcoplasmic reticulum. Concomitantly, expression of proteins involved in mitochondria-organelle membrane contact sites decreases during postnatal development in tandem with a decrease in abundance of proteins associated with sarcomere assembly despite an overall increase in contractile protein abundance. Functionally, parallel measures of mitochondrial membrane potential, NADH redox status, and NADH flux within intact cells revealed that mitochondria in adult skeletal muscle fibres maintain a more activated electron transport chain compared with neonatal muscle mitochondria. These data demonstrate a developmental redesign reflecting a shift from muscle cell assembly and frequent inter-organelle communication toward a muscle fibre with mitochondrial structure, interactions, composition and function specialized to support contractile function. KEY POINTS: Mitochondrial network organization is remodelled during skeletal muscle postnatal development. The mitochondrial outer membrane is in frequent contact with other organelles at birth and transitions to more close associations with the contractile apparatus in mature muscles. Mitochondrial energy metabolism becomes more activated during postnatal development. Understanding the developmental redesign process within skeletal muscle cells may help pinpoint specific areas of deficit in muscles with developmental disorders.

Keywords: 3D mitochondrial structure; functional cellular imaging; organelle interactions; postnatal muscle development; volume electron microscopy.


Conflict of interest statement

Competing Interests

The authors declare no competing interests.

Figures

Figure 1:
Figure 1:. Dynamic reorganization of mitochondrial networks during postnatal development.
a-f) Representative 3D rendering of individual mitochondria within networks in oxidative (O; SOL) and glycolytic (G; GAS) fibers of mice at postnatal (P) day 1, 14, and 42, respectively. Mitochondrial networks are arranged along muscle contraction axis (yellow arrow) and 90-degree rotated images are depicted in the upper-right corner. Each color indicates individual mitochondria. g) Total mitochondrial volume (% of muscle area). h) Mitochondrial number per 1000 μm3 of muscle. i) Mitochondrial network orientations are calculated in a ratio of parallel to perpendicular arrangement. j) Mitochondrial surface area within 30 nm of a sarcomere. k) Individual mitochondrial volume (μm3). l) Mitochondrial surface area to volume ratio (μm−1). N values: P1 oxidative – 609 mitochondria, 3 datasets; P14 oxidative – 1115 mitochondria, 3 datasets; P42 oxidative – 1414 mitochondria, 3 datasets; P1 glycolytic – 274 mitochondria, 3 datasets; P14 glycolytic – 1828 mitochondria, 3 datasets; P42 glycolytic – 462 mitochondria, 3 datasets. Points are means for each dataset. Bars are means ± SE. *P < 0.05, vs P1; #P < 0.05, vs P14; %P < 0.05, vs O (SOL); αP<0.05, main effect of development; βP<0.05, main effect of fiber type; χP<0.05, interaction effect of development and fiber type. scale bar = 1 μm.
Figure 2:
Figure 2:. Dynamic reorganization of mitochondrial networks during postnatal development.
a) 3D rendering of mitochondrial donuts within a P42 glycolytic muscle. b) Donut-shaped mitochondria are counted per 100 μm3 of mitochondrial volume. c) 3D rendering of mitochondrial nanotunnels (blue) extending out from a P42 glycolytic muscle mitochondrion (green). d) Nanotunnel volume as a proportion of total mitochondrial volume. Nanotunnels defined as regions with <150 nm diameters. e) 3D rendering of intermitochondrial junctions (IMJs, yellow) within a P1 soleus muscle mitochondrial network (transparent grey). f) 3D rendering of IMJs (yellow) within a P42 soleus muscle mitochondrial network (transparent grey). g) Individual IMJ area (μm3). h) IMJ area per mitochondrial surface area (%). i) Quantification of intermitochondrial junction (IMJ) orientation. N values: P1 oxidative – 609 mitochondria, 375 IMJ, 3 datasets; P14 oxidative – 1115 mitochondria, 523 IMJ, 3 datasets; P42 oxidative – 1414 mitochondria, 509 IMJ, 3 datasets; P1 glycolytic – 274 mitochondria, 173 IMJ, 3 datasets; P14 glycolytic – 1828 mitochondria, 786 IMJ, 3 datasets; P42 glycolytic – 462 mitochondria, 263 IMJ, 3 datasets. Points are means for each dataset. Bars are means ± SE. *P < 0.05, vs P1; #P < 0.05, vs P14; %P < 0.05, vs O (SOL); αP<0.05, main effect of development; χP<0.05, interaction effect of development and fiber type. Scale bars = 200 nm (a,c); 2 μm (e,f).
Figure 3:
Figure 3:. Mitochondria-lipid droplet (LD) contact sites decrease in frequency across postnatal development.
a-c) Representative 3D rendering of mitochondrial networks (colored in sky blue) and lipid droplets (colored in yellow) of oxidative fibers of mice at postnatal (P) day 1, 14, and 42, respectively. All images are aligned to contraction axis. d) Total lipid droplet volume (% of muscle). e) Individual lipid droplet volume (μm3). N values: P1 oxidative – 183 LD, 3 datasets; P14 oxidative – 117 LD, 3 datasets; P42 – 81 LD, 3 datasets; P1 glycolytic – 53 LD, 3 datasets; P14 glycolytic – 89 LD, 3 datasets; P42 glycolytic – 0 LD, 3 datasets. f) LD contact per mitochondrial surface area (%). g-i) Individual mitochondrial volume (μm3; g), Mitochondrial surface area to volume ratio (μm−1; h), and Intermitochondrial junction area (μm2; i) connected with LD (LD connected) and non-connected with LD (LD not connected). N values (LD connected): P1 oxidative – 183 mitochondria, 3 datasets; P14 oxidative – 117 mitochondria, 3 datasets; P42 – 81 mitochondria, 3 datasets; P1 glycolytic – 53 mitochondria, 3 datasets; P14 glycolytic – 89 mitochondria, 3 datasets; P42 glycolytic – 0 mitochondria, 3 datasets; N values (LD not connected): P1 oxidative – 414 mitochondria, 3 datasets; P14 oxidative – 406 mitochondria, 3 datasets; P42 – 428 mitochondria, 3 datasets; P1 glycolytic – 219 mitochondria, 3 datasets; P14 glycolytic – 697 mitochondria, 3 datasets; P42 glycolytic – 263 mitochondria, 3 datasets. Points are means for each dataset. Bars represent means±SE. *P < 0.05, vs P1; %P < 0.05, vs O (SOL); αP<0.05, main effect of development. βP<0.05, main effect of fiber type. Scale bar = 1 μm.
Figure 4:
Figure 4:. Mitochondria-sarcoplasmic reticulum interactions are highly abundant during early postnatal development.
a-d) Representative 3D rendering of mitochondrial network (colored in sky blue color), sarcoplasmic reticulum/t-tubules (SR/T; colored in magenta), and lipid droplets (colored in yellow) in oxidative (O: SOL) and glycolytic (G: GAS) fibers of mice at postnatal (P) day 1 and 42, respectively. These 3D images are arranged along muscle contraction axis and the 90-degree rotated images are depicted in the box of dotted lines. e) Total SR/T volume (% of muscle). f) Mitochondrial surface area in contact with SR/T (%). N values: P1 oxidative – 566 Mitochondria in contact with SR/T (M-SR/T), 3 datasets; P14 oxidative – 1111 M-SR/T, 3 datasets; P42 – 1023 M-SR/T, 3 datasets; P1 glycolytic – 296 M-SR/T, 3 datasets; P14 glycolytic – 1811 M-SR/T, 3 datasets; P42 glycolytic – 458 M-SR/T, 3 datasets. g) Mitochondria with at least 10% surface area contact with SR/T (%). N values: P1 oxidative – 566 Mitochondria in contact with SR/T (M-SR/T), 3 datasets; P14 oxidative – 1111 M-SR/T, 3 datasets; P42 – 1023 M-SR/T, 3 datasets; P1 glycolytic – 296 M-SR/T, 3 datasets; P14 glycolytic – 1811 M-SR/T, 3 datasets; P42 glycolytic – 458 M-SR/T, 3 datasets h-j) Individual mitochondrial volume (μm3; h), Mitochondrial surface area to volume ratio (μm−1; i), and Intermitochondrial junction area (% of mito surface area; j) in mitochondria highly connected with SR/T (>=10% SRC [large area connected] vs. <10% SRC [less area connected]). N values (>=10% SRC): P1 oxidative – 494 mitochondria, 3 datasets; P14 oxidative – 131 mitochondria, 3 datasets; P42 – 174 mitochondria, 3 datasets; P1 glycolytic – 252 mitochondria, 3 datasets; P14 glycolytic – 354 mitochondria, 3 datasets; P42 glycolytic – 110 mitochondria, 3 datasets; N values (<10% SRC): P1 oxidative – 72 mitochondria, 3 datasets; P14 oxidative – 980 mitochondria, 3 datasets; P42 – 849 mitochondria, 3 datasets; P1 glycolytic – 44 mitochondria, 3 datasets; P14 glycolytic – 1457 mitochondria, 3 datasets; P42 glycolytic – 348 mitochondria, 3 datasets. Points are means for each dataset. Bars represent means±SE. *P < 0.05, vs P1; %P < 0.05, vs O (SOL); #P < 0.05, vs P14; χP < 0.05, interaction effect of development and fiber type; αP<0.05, main effect of development. Scale bar = 1 μm.
Figure 5:
Figure 5:. Specialized mitochondria-organelle interactions transition from supporting cellular assembly to contractile function in skeletal muscle cells.
a,b) Representative single P1 mitochondrion (green) alone (a) and in contact (b) with other mitochondria (magenta), lipid droplets (blue), and SR/T (gold). c,d) Representative single P14 mitochondrion alone (c) and in contact (d) with other mitochondria, lipid droplets, and SR/T. e,f) Representative single P42 oxidative mitochondrion alone (e) and in contact (f) with other mitochondria, lipid droplets, and SR/T. g,h) Representative single P42 glycolytic mitochondrion alone (g) and in contact (h) with the SR/T. i) Total mitochondria-organelle contact area (%) per mitochondrion. Data equivalent to sum of figures 1n+2f+3f.
Figure 6:
Figure 6:. Abundance of contractile proteins, assembly factors, and organelle contact site tethers across postnatal muscle development.
a) Log2 ratio of Tibialis anterior muscle contractile protein abundances relative to P1. Total abundance is the sum of all contractile proteins. Mean±SE values weight each protein equally regardless of abundance differences across proteins. Green highlight indicates increase, black indicates no change, red indicates decrease. b) Sarcomere assembly factor abundances. c) Other assembly factor abundances. d) Chaperone abundances. e) Mitochondria-sarcoplasmic reticulum tether abundances grouped by putative function. f) Mitochondria-lipid droplet tether abundances. g) Lipid droplet-sarcoplasmic reticulum protein abundances. N = 4 separate samples for each group. One sample was pooled tissues from 3–5 mice for P1 and P7 groups, and tissue from 1 mouse for P14, P21, and P42, respectively.
Figure 7:
Figure 7:. Functional analysis of mitochondrial energetic function during skeletal muscle postnatal development.
a-d) Representative images of isolated flexor digitorum brevis muscle fiber NADH autofluorescence across postnatal development. Scale bars – 50 μm. e-h) Representative images of tetramethyl rhodamine, methyl ester (TMRM) fluorescence across postnatal development. Scale bars – 7 μm for e,h, 5 μm for f,g. i-l) Representative images of MitoTracker Green (MTG) fluorescence across postnatal development. Scale bars – 7 μm for i,l, 5 μm for j,k. m-p) Representative images of Rhod-2 fluorescence across postnatal development. Scale bars – 5 μm for m,n, 7 μm for o,p. q) NADH redox state across postnatal development. N = 5, 11, 9, 7 cells for P1, P14, P42 oxidative, and P42 glycolytic, respectively. r) NADH flux rates across postnatal development. N = 5, 11, 9, 7 cells for P1, P14, P42 oxidative, and P42 glycolytic, respectively. s) Mitochondrial membrane potential across postnatal development. N = 31, 37, 18, 18 cells for P1, P14, P42 oxidative, and P42 glycolytic, respectively. t) Mitochondrial calcium levels across postnatal development. N = 32, 12, 5, 5 cells for P1, P14, P42 oxidative, and P42 glycolytic, respectively.

Similar articles

Cited by

References

    1. Agbulut O, Noirez P, Beaumont F & Butler-Browne G. (2003). Myosin heavy chain isoforms in postnatal muscle development of mice. Biology of the Cell 95, 399–406. - PubMed
    1. Andrienko T, Kuznetsov AV, Kaambre T, Usson Y, Orosco A, Appaix F, Tiivel T, Sikk P, Vendelin M, Margreiter R & Saks VA. (2003). Metabolic consequences of functional complexes of mitochondria, myofibrils and sarcoplasmic reticulum in muscle cells. J Exp Biol 206, 2059–2072. - PubMed
    1. Bakeeva LE, Chentsov YS & Skulachev VP. (1981). Ontogenesis of mitochondrial reticulum in rat diaphragm muscle. Eur J Cell Biol 25, 175–181. - PubMed
    1. Bakeeva LE, Chentsov Yu S & Skulachev VP. (1978). Mitochondrial framework (reticulum mitochondriale) in rat diaphragm muscle. Biochim Biophys Acta 501, 349–369. - PubMed
    1. Beier T, Pape C, Rahaman N, Prange T, Berg S, Bock DD, Cardona A, Knott GW, Plaza SM, Scheffer LK, Koethe U, Kreshuk A & Hamprecht FA. (2017). Multicut brings automated neurite segmentation closer to human performance. Nat Methods 14, 101–102. - PubMed

LinkOut - more resources