. 2024 May;10(5):829-842.
doi: 10.1016/j.jacep.2024.01.003. Epub 2024 Feb 28.

Cardiac-Specific Deletion of Scn8a Mitigates Dravet Syndrome-Associated Sudden Death in Adults

Affiliations

Cardiac-Specific Deletion of Scn8a Mitigates Dravet Syndrome-Associated Sudden Death in Adults

D Ryan King et al. JACC Clin Electrophysiol. 2024 May.

Abstract

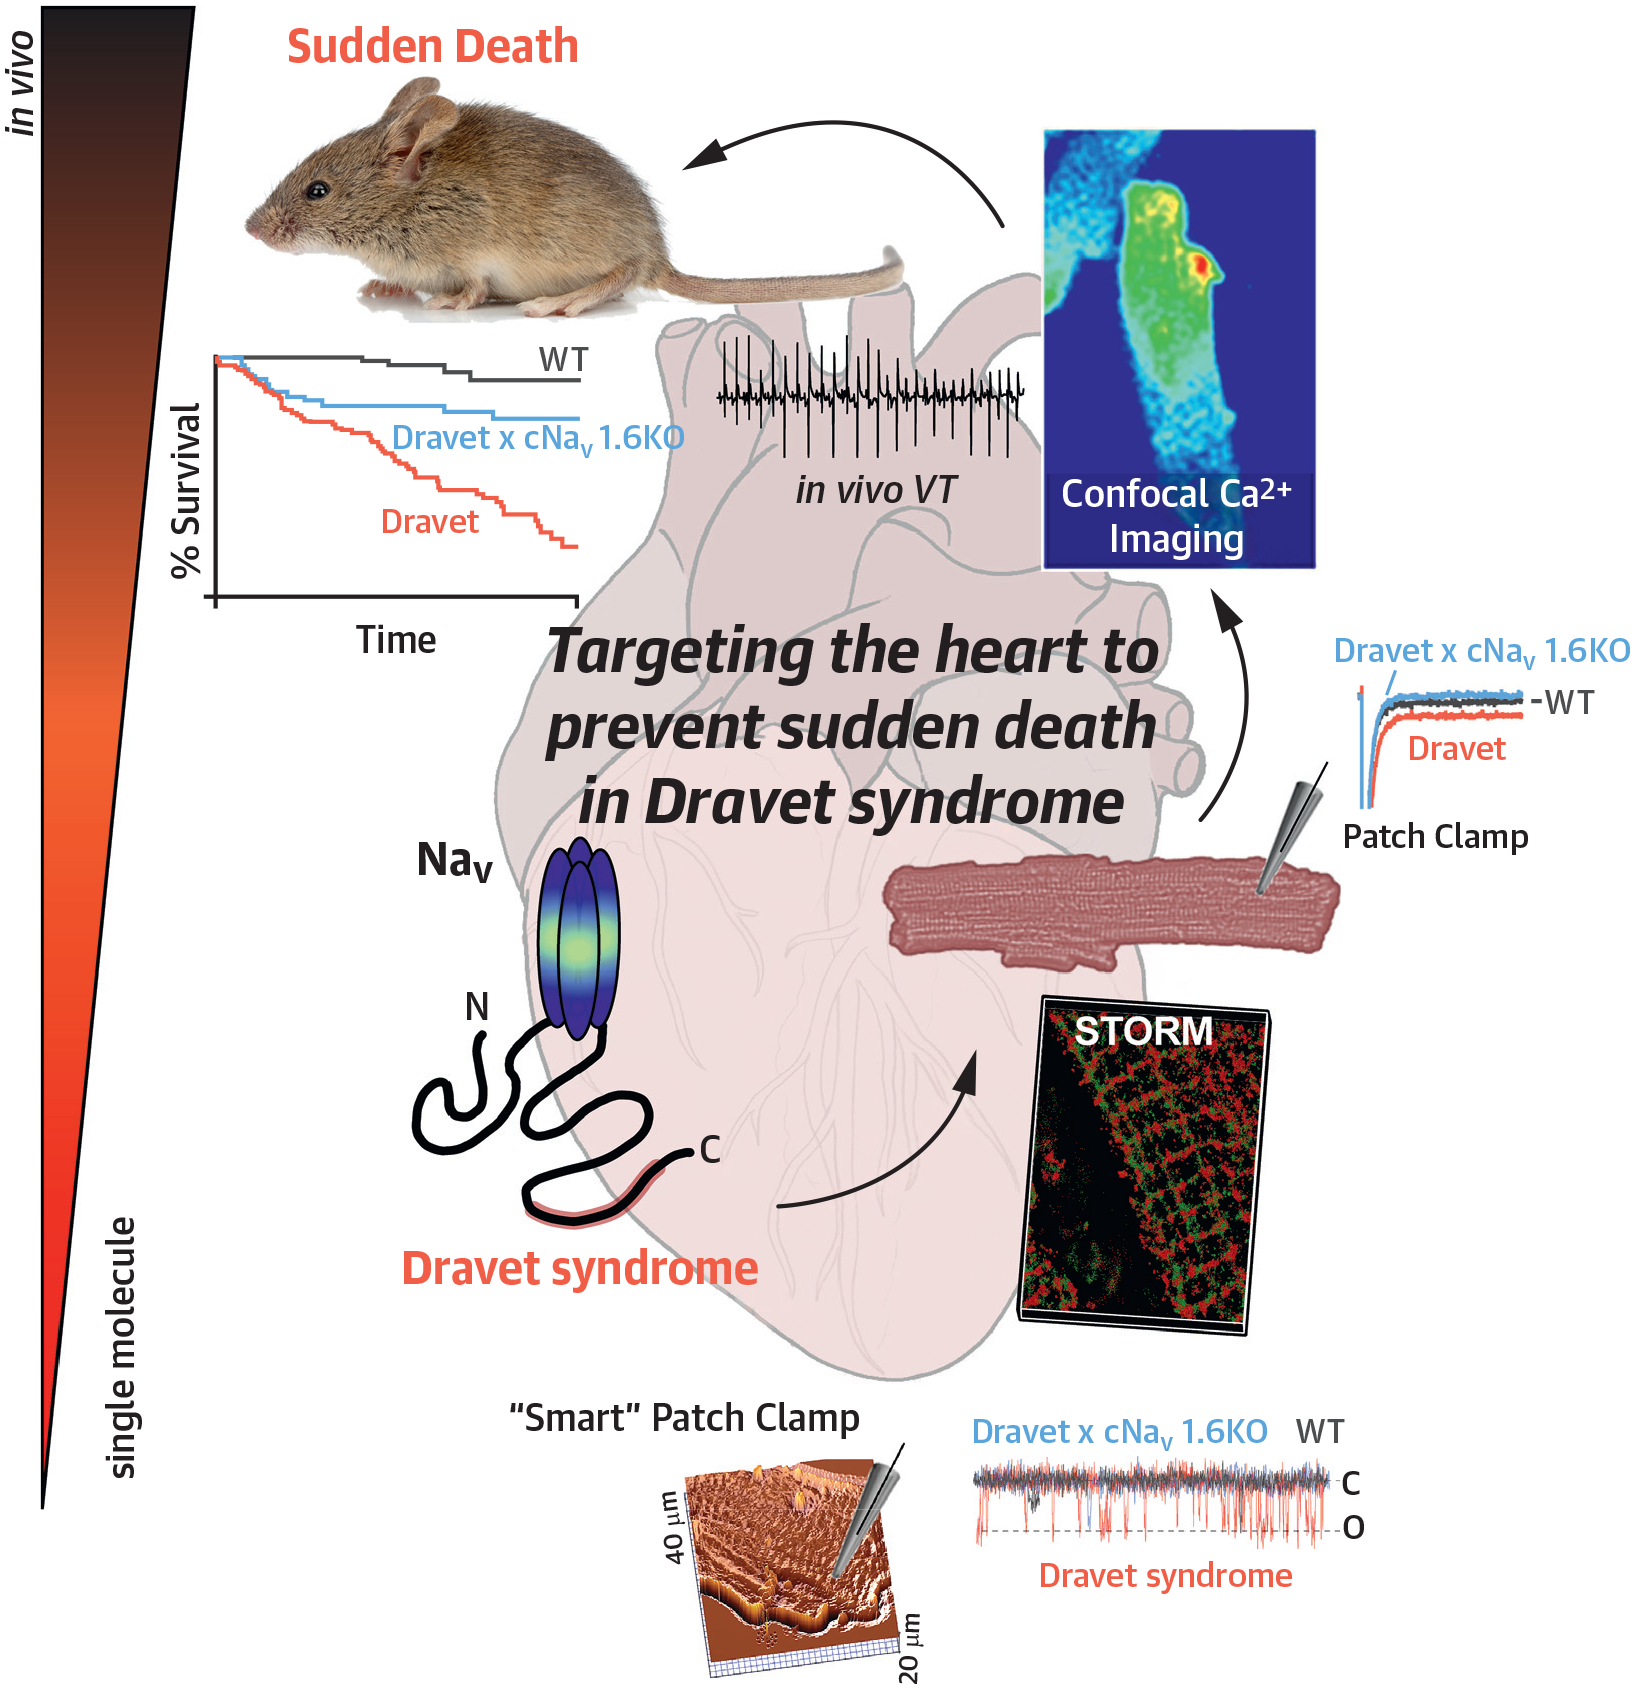
Background: Sudden unexpected death in epilepsy (SUDEP) is a fatal complication experienced by otherwise healthy epilepsy patients. Dravet syndrome (DS) is an inherited epileptic disorder resulting from loss of function of the voltage-gated sodium channel, NaV 1.1, and is associated with particularly high SUDEP risk. Evidence is mounting that NaVs abundant in the brain also occur in the heart, suggesting that the very molecular mechanisms underlying epilepsy could also precipitate cardiac arrhythmias and sudden death. Despite marked reduction of NaV 1.1 functional expression in DS, pathogenic late sodium current (INa,L) is paradoxically increased in DS hearts. However, the mechanisms by which DS directly impacts the heart to promote sudden death remain unclear.

Objectives: In this study, the authors sought to provide evidence implicating remodeling of Na+ - and Ca2+ -handling machinery, including NaV 1.6 and Na+/Ca2+exchanger (NCX) within transverse (T)-tubules in DS-associated arrhythmias.

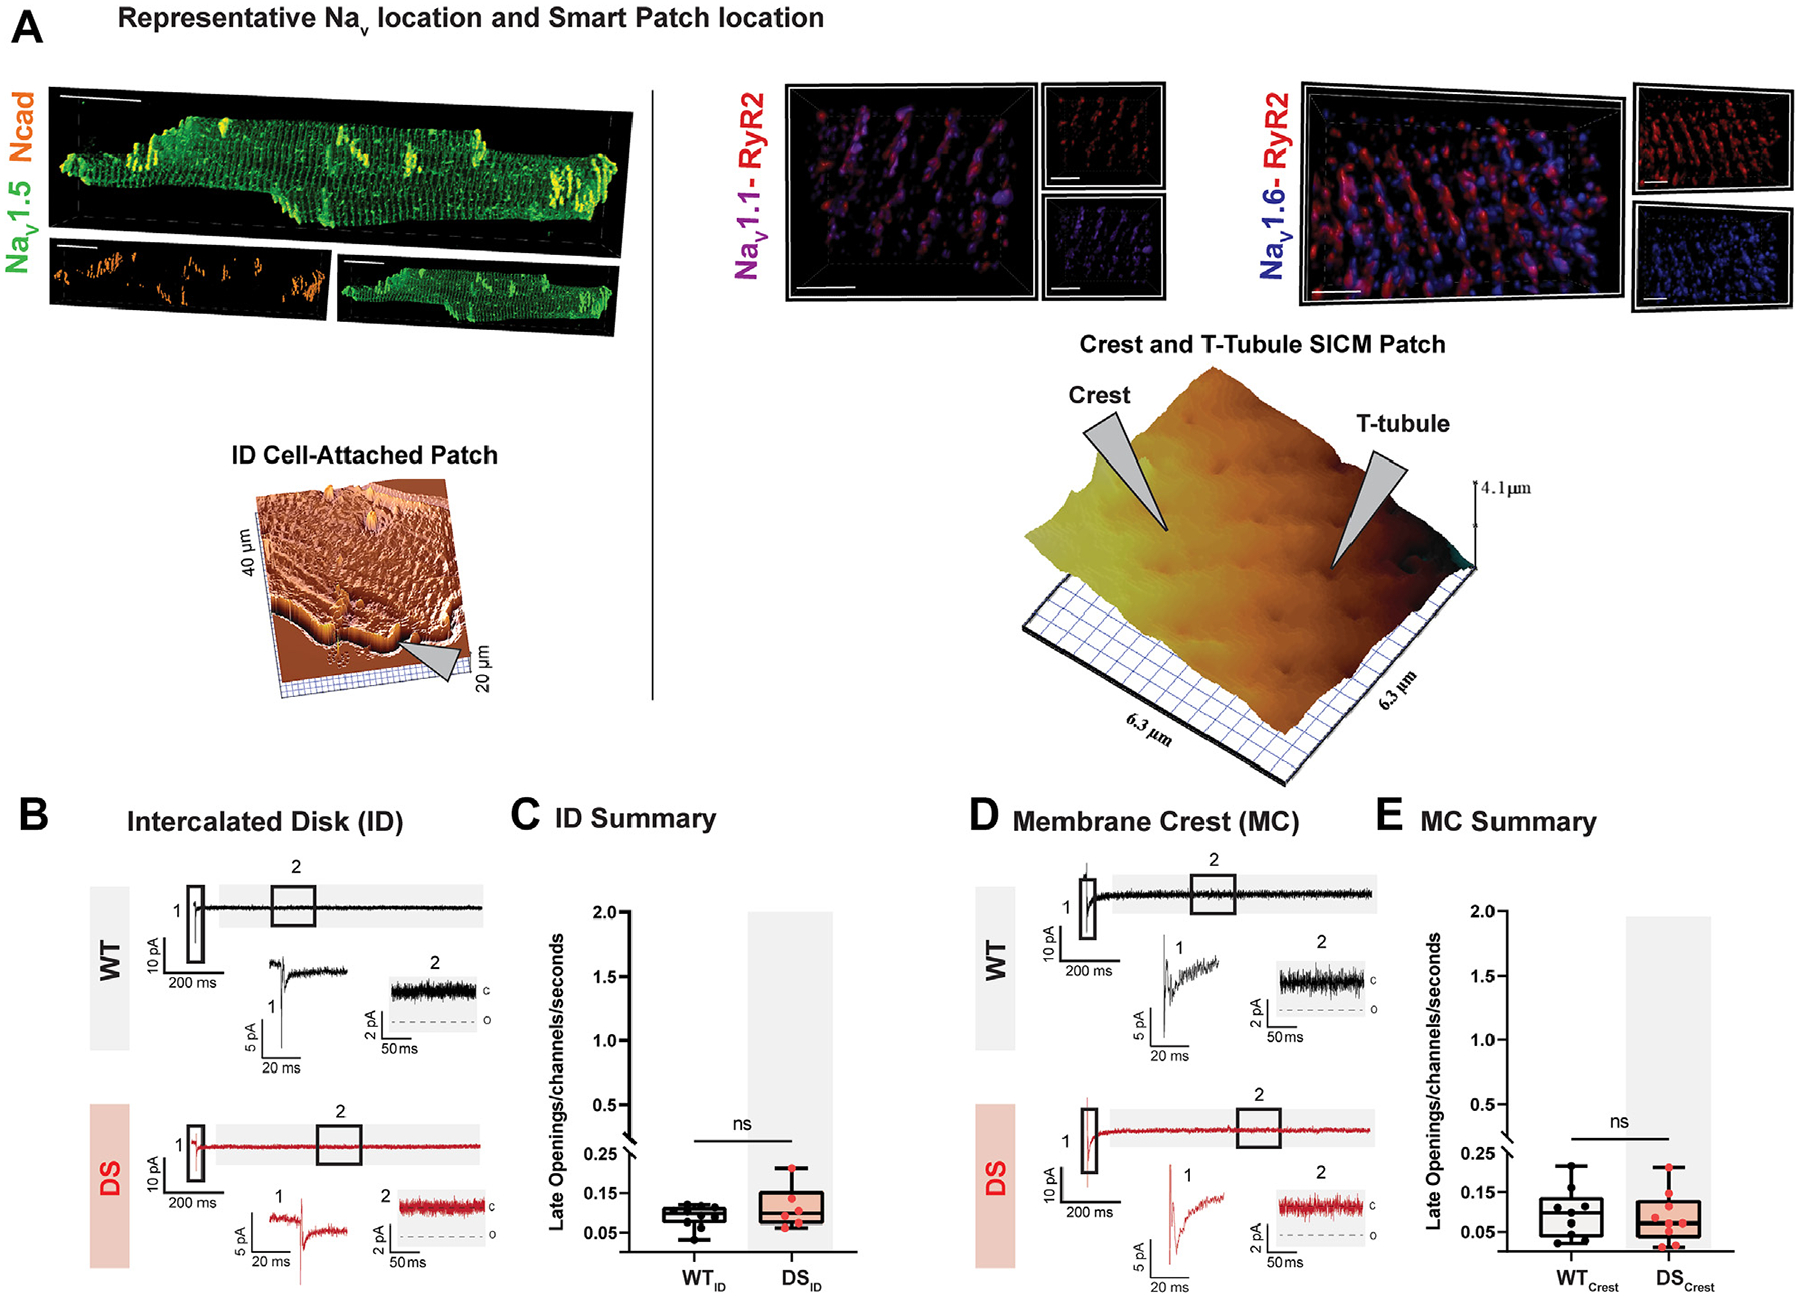
Methods: The authors undertook scanning ion conductance microscopy (SICM)-guided patch clamp, super-resolution microscopy, confocal Ca2+ imaging, and in vivo electrocardiography studies in Scn1a haploinsufficient murine model of DS.

Results: DS promotes INa,L in T-tubular nanodomains, but not in other subcellular regions. Consistent with increased NaV activity in these regions, super-resolution microscopy revealed increased NaV 1.6 density near Ca2+release channels, the ryanodine receptors (RyR2) and NCX in DS relative to WT hearts. The resulting INa,L in these regions promoted aberrant Ca2+ release, leading to ventricular arrhythmias in vivo. Cardiac-specific deletion of NaV 1.6 protects adult DS mice from increased T-tubular late NaV activity and the resulting arrhythmias, as well as sudden death.

Conclusions: These data demonstrate that NaV 1.6 undergoes remodeling within T-tubules of adult DS hearts serving as a substrate for Ca2+ -mediated cardiac arrhythmias and may be a druggable target for the prevention of SUDEP in adult DS subjects.

Keywords: Dravet syndrome; Na(V)1.6; sodium channels; sudden cardiac death; sudden unexpected death in epilepsy.


Conflict of interest statement

Funding Support and Author Disclosures This work was supported by National Institutes of Health grants R01NS121234 and R01HL155378 (to Dr Radwański), R01HL148736 (to Dr Veeraraghavan), R01HL156652 (to Dr Hund), K99HL157684 (to Dr Nassal), and T32HL149637-02 and L40NS129034 (to Dr King); National Science Foundation Graduate Research Fellowship, NSF Fellow ID: 2019259354 (to Dr Struckman); and American Heart Association postdoctoral fellowships 915300 (to Dr Tarasov) and 908824 (to Dr Moise). The authors have reported that they have no relationships relevant to the contents of this paper to disclose.

Figures

FIGURE 1
FIGURE 1. DS Is Associated With an Increase in Mortality and Predisposition to Arrhythmia Development, Which Are Mitigated by Reduction in NaV1.6
(A) Kaplan-Meier survival curves for WT (n = 163), DS (n = 238), DSxNaV1.6Het (n = 68), and DSxcNaV1.6KO (n = 92) mice. The data from all strains tested for WT and DS were pooled. *P < 0.001 relative to WT, &P < 0.001 relative to DS. (B) Representative ECG from WT and DS mice. (C) QT-interval prolongation in DS, mitigated by NaV1.6 reduction (WT: n = 11; DS: n = 18; DSxNaV1.6Het: n = 17; DSxcNaV1.6KO: n = 29 mice). (D) Representative ECGs following catecholamine challenge with caffeine and epinephrine illustrate SR followed by VT. (E) Summary data showing significant increase in arrhythmia burden in DS mice (WT: n = 38; DS: n = 59; DSxNaV1.6Het: n = 17; DSxcNaV1.6KO: n = 40). Arrhythmia scores: 0 = no abnormalities; 1 = premature ventricular complexes observed; 2 = bigeminy; 3 = VT; 4 = ventricular fibrillation. *q < 0.05, ****q < 0.0001 relative to DS. DS = Dravet syndrome; ECG = electrocardiogram; NaV = voltage-gated sodium channel; cNaV1.6KO = cardiac-specific NaV1.6 deletion; NaV1.6Het = Scn8a haploinsufficient; SR = sinus rhythm; VT = ventricular tachycardia; WT = wild type.
FIGURE 2
FIGURE 2. Whole-Cell Patch Clamp Recordings Reveal Increased Late INa in DS Cardiomyocytes, Which Are Mitigated by Reduction in NaV1.6
(A) Representative late INa recordings from cardiomyocytes of each experimental group; increased late INa in DS cardiomyocytes is mitigated by NaV1.6 reduction (WT: n = 10 cells, 4 mice; DS: n = 15 cells, 8 mice; DSxNaV1.6Het: n = 13 cells, 6 mice; DSxcNaV1.6KO: n = 9 cells, 5 mice). (B) Peak INa (WT: n = 5 cells, 3 mice; DS: n = 8 cells, 7 mice; DSxNaV1.6Het: n = 9 cells, 5 mice; DSxcNaV1.6KO: n = 12 cells, 4 mice). *q < 0.05, **q < 0.01 relative to DS. INa,L = voltage-gated sodium current; other abbreviations as in Figure 1.
FIGURE 3
FIGURE 3. No Changes in Late NaV Activity Within the Intercalated Disc or the Lateral Membrane Crests of DS Cardiomyocytes
(A, top) Representative immunofluorescence confocal microscopy images of NaV (NaV1.5: green; NaV1.1: purple; NaV1.6: blue) distributions relative to ID (N-cadherin: orange) and T-tubular (RyR2: red) regions and (bottom) representative scanning ion conductance microscopy images of cardiomyocyte topography (specific regions indicated by markers; left ID, right crest and T-tubule). Scale bars: (left) 20 μm and (right) 2 μm. (B) Cell-attached patch INa recordings from the ID. (D) Scanning ion conductance microscopy-guided “smart” patch INa recordings from the lateral membrane crest. (C and E) Summary data of late activity at the ID (WT: n = 10 cells, 3 mice; DS: n = 6 cells, 3 mice) and later membrane crest (WT: n = 9 cells, 3 mice; DS: n = 9 cells, 3 mice). ID = intercalate disc; ns = not significant; RyR2 = ryanodine receptors; T-tubule = transverse tubule; other abbreviations as in Figures 1 and 2.
FIGURE 4
FIGURE 4. NaV1.6 Contributes to Increased Late NaV Activity Within the T-Tubules of DS Cardiomyocytes
(A) Representative scanning ion conductance microscopy-guided “smart” patch INa recordings from T-tubule openings. (B) Summary data of late activity at the T-tubules (WT: n = 9 cells, 5 mice; DS: n = 13 cells, 7 mice; DSxNaV1.6Het: n = 13 cells, 5 mice; DSxcNaV1.6KO: n = 7 cells, 4 mice). *q < 0.05, **q < 0.01, ***q < 0.001 relative to DS. Abbreviations as in Figures 1 to 3.
FIGURE 5
FIGURE 5. Increased NaV1.6 Expression in DS Hearts
(A) Representative Western blots of NaV1.6 and GAPDH (loading control) in WT and DS hearts. (B) Summary Western blot data (n = 6). *P < 0.05 relative to DS. GAPDH = glyceraldehyde 3-phosphate dehydrogenase; other abbreviations as in Figures 1 to 3.
FIGURE 6
FIGURE 6. STORM Reveals Enhanced NaV1.6 Clustering in Close Proximity to NCX and RyR2 in DS Hearts
Representative stochastic optical reconstruction microscopy (STORM) images from (A and C) WT and (B and D) DS hearts immunolabeled for RyR2 (top, red), NaV1.6 (top and bottom, blue), and NCX (bottom, yellow). Protein distribution measured as percentage of molecules (E: NaV1.6 to RyR2; G: NaV1.6 to NCX) and percentage of clusters (F: NaV1.6 to RyR2; H: NaV1.6 to NCX) (n = 5 images/heart from 3 WT hearts and 3 DS hearts). Differences in distributions and medians were tested with the 2-sample Kolmogorov-Smirnov test and Wilcoxon rank-sum test test, respectively (P > 0.05: ns; *P ≤ 0.05; **P ≤ 0.01; ***P ≤ 0.001; ****P ≤ 0.0001). (I) Probability distribution and (J) cumulative distribution plots of NaV1.6 clusters relative to RyR2 in WT and DS mice. (K) Probability distribution and (L) cumulative distribution plots of NaV1.6 clusters relative to NCX in WT and DS mice (n = 5 images/heart from 3 WT hearts and 3 DS hearts). Scale bars: (A, left) 7 μm, (A, right) 2 μm, (B, left) 7 μm, (B, right) 2 μm, (C, left) 5 μm, (C, right) 1 μm, (D, left) 6 μm, and (D, right) 1 μm. NCX = sodium/calcium exchanger; other abbreviations as in Figures 1 to 3.
FIGURE 7
FIGURE 7. Monte Carlo Clustering Simulations Predict That Channel-Channel Interactions Are Sufficient to Explain Enhanced NaV1.6 Clustering in DS
(A) Representative map showing simulated NCX, NaV1.6, and NaV1.1 clustering. (B) Representative map of NCX, NaV1.6, and NaV1.1 clustering in DS. Note the smaller NaV1.1 cluster. (C) Distribution and cumulative distribution plots showing the distribution of NaV1.6 relative to NCX. Reduction in NaV1.1 in DS shifts NaV1.1 distribution to the left (red), without other changes in expression or NaV1.6-NCX interactions. (D) Distribution and cumulative distribution plots showing the distribution of NCX relative to NaV1.6. Reduction in NaV1.1 in DS does not change this distribution. The data shown in C and D are pooled from 5 simulations for each case. Abbreviations as in Figures 1 to 3 and 6.
FIGURE 8
FIGURE 8. NaV1.6 Remodeling Within T-Tubules in DS Contributes to Aberrant Ca2+ Release
(A) Representative Ca2+ line scans of isolated cardiomyocytes (top) and corresponding Ca2+ transients (bottom). (B) Summary of frequency and distribution of Ca2+ sparks (WT: n = 121 cells, 7 mice; DS: n = 102 cells, 13 mice; DSxNaV1.6Het: n = 211 cells, 7 mice; DSxcNaV1.6KO: n = 126 cells, 11 mice) and (C) Ca2+ waves. WT: n = 123 cells, 7 mice; DS: n = 181 cells, 15 mice; DSxNaV1.6Het: n = 103 cells, 4 mice; DSxcNaV1.6KO: n = 152 cells, 11 mice. *q < 0.05 relative to DS. Abbreviations as in Figures 1 to 3.
FIGURE 9
FIGURE 9. Remodeling of NaVs Within the Ca2+-Handling Machinery–Rich Regions of Cardiac T-Tubules in DS Serves as a Substrate for Arrhythmogenic Ca2+ Release
Reduction in NaV1.1 evidenced in DS facilitates the repopulation of cardiac sarcolemma (SL) sites typically occupied by NaV1.1 by NaV1.6. The resulting increase in subsarcolemmal Na+ through NaV1.6 promotes Na+/Ca2+ exchange and intracellular Ca2+ loading, thereby setting a stage for aberrant Ca2+ release from the sarcoplasmic reticulum (SR) via ryanodine receptors (RyR). Abbreviations as in Figures 1 to 3 and 6.
CENTRAL ILLUSTRATION
CENTRAL ILLUSTRATION. Targeting the Heart to Prevent Sudden Death in Dravet Syndrome
NAv = voltage-gated sodium channel; VT = ventricular tachycardia; WT = wild-type.

References

    1. Skluzacek JV, Watts KP, Parsy O, Wical B, Camfield P. Dravet syndrome and parent associations: the IDEA League experience with comorbid conditions, mortality, management, adaptation, and grief. Epilepsia. 2011;52(suppl 2):95–101. - PubMed
    1. Claes L, Del-Favero J, Ceulemans B, Lagae L, Van Broeckhoven C, De Jonghe P. De novo mutations in the sodium-channel gene SCN1A cause severe myoclonic epilepsy of infancy. Am J Hum Genet. 2001;68(6):1327–1332. - PMC - PubMed
    1. Panelli RJ. SUDEP: a global perspective. Epilepsy Behav. 2020;103(pt B):106417. 10.1016/j.yebeh.2019.07.018 - DOI - PubMed
    1. Delogu AB, Spinelli A, Battaglia D, et al. Electrical and autonomic cardiac function in patients with Dravet syndrome: cardiac autonomic function in Dravet syndrome. Epilepsia. 2011;52:55–58. - PubMed
    1. Kalume F, Westenbroek RE, Cheah CS, et al. Sudden unexpected death in a mouse model of Dravet syndrome. J Clin Invest. 2013;123(4):1798–1808. - PMC - PubMed

LinkOut - more resources