

Genome-wide association study of drought tolerance in wheat (Triticum aestivum L.) identifies SNP markers and candidate genes
- PMID: 38430317
- PMCID: PMC10908643
- DOI: 10.1007/s00438-024-02104-x
Genome-wide association study of drought tolerance in wheat (Triticum aestivum L.) identifies SNP markers and candidate genes
Abstract
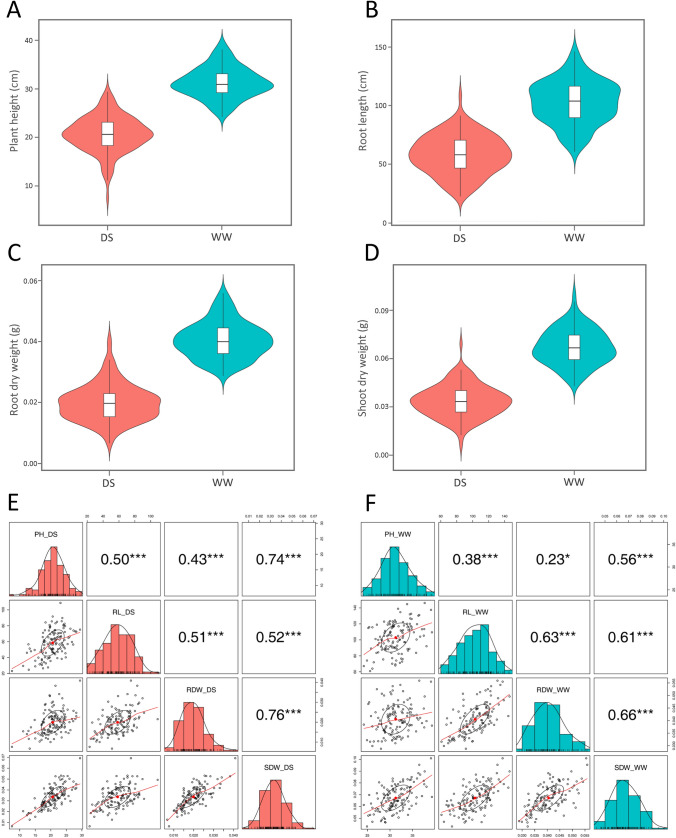
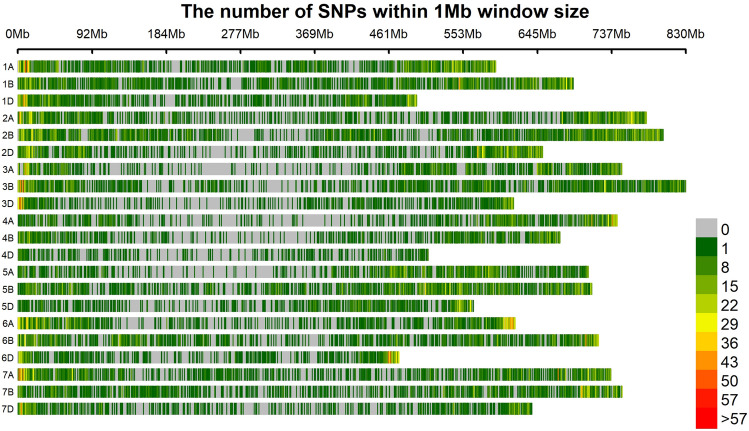
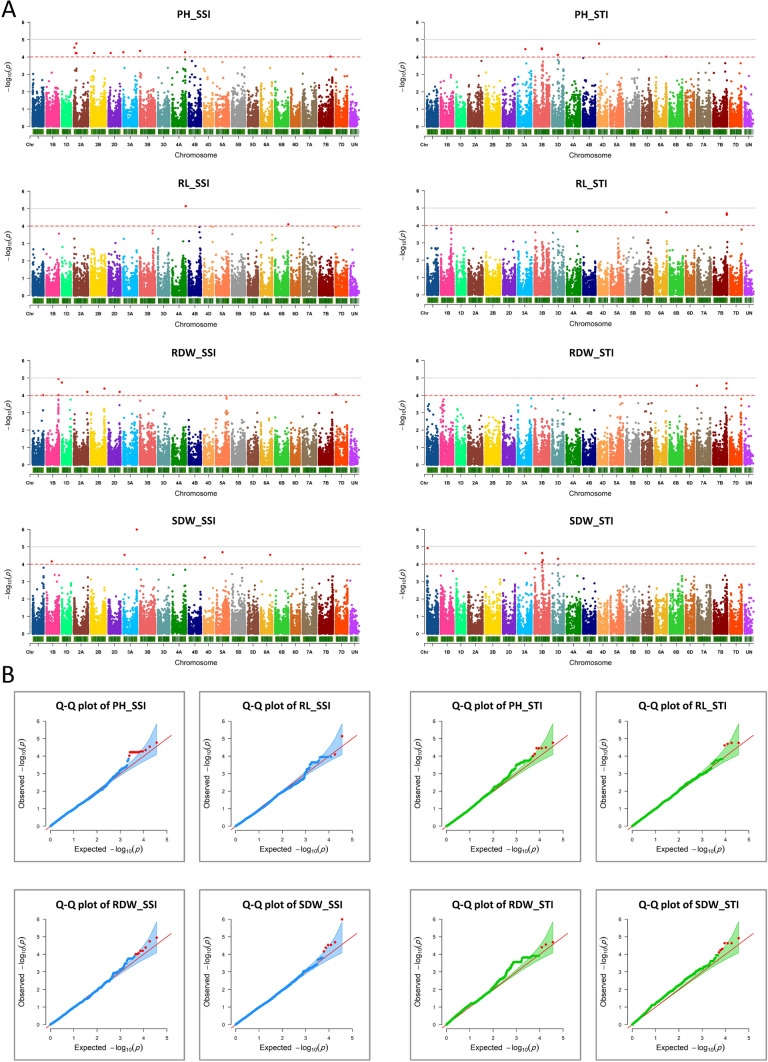
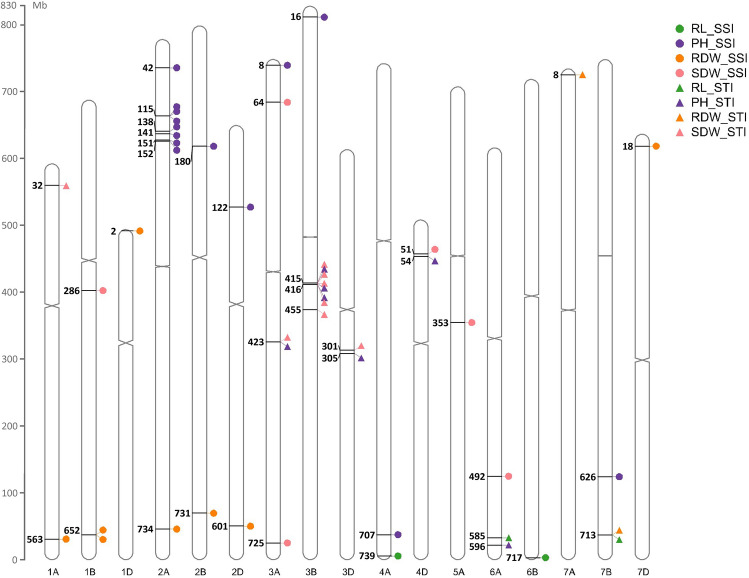
Drought stress poses a severe threat to global wheat production, necessitating an in-depth exploration of the genetic basis for drought tolerance associated traits. This study employed a 90 K SNP array to conduct a genome-wide association analysis, unravelling genetic determinants of key traits related to drought tolerance in wheat, namely plant height, root length, and root and shoot dry weight. Using the mixed linear model (MLM) method on 125 wheat accessions subjected to both well-watered and drought stress treatments, we identified 53 SNPs significantly associated with stress susceptibility (SSI) and tolerance indices (STI) for the targeted traits. Notably, chromosomes 2A and 3B stood out with ten and nine associated markers, respectively. Across 17 chromosomes, 44 unique candidate genes were pinpointed, predominantly located on the distal ends of 1A, 1B, 1D, 2A, 3A, 3B, 4A, 6A, 6B, 7A, 7B, and 7D chromosomes. These genes, implicated in diverse functions related to plant growth, development, and stress responses, offer a rich resource for future investigation. A clustering pattern emerged, notably with seven genes associated with SSI for plant height and four genes linked to both STI of plant height and shoot dry weight, converging on specific regions of chromosome arms of 2AS and 3BL. Additionally, shared genes encoding polygalacturonase, auxilin-related protein 1, peptide deformylase, and receptor-like kinase underscored the interconnectedness between plant height and shoot dry weight. In conclusion, our findings provide insights into the molecular mechanisms governing wheat drought tolerance, identifying promising genomic loci for further exploration and crop improvement strategies.
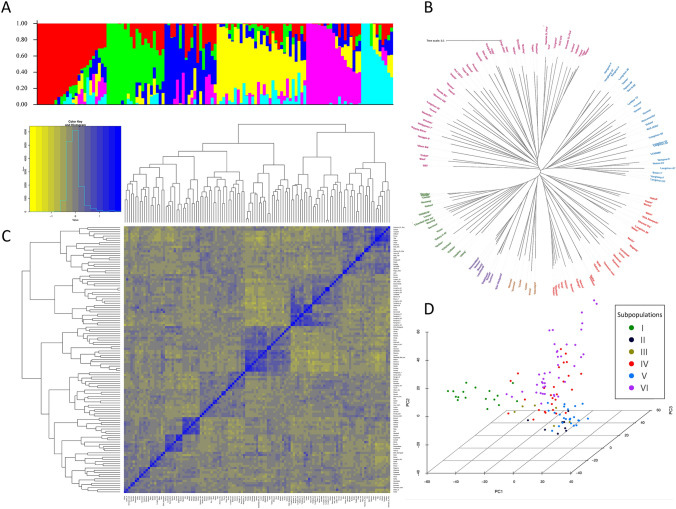
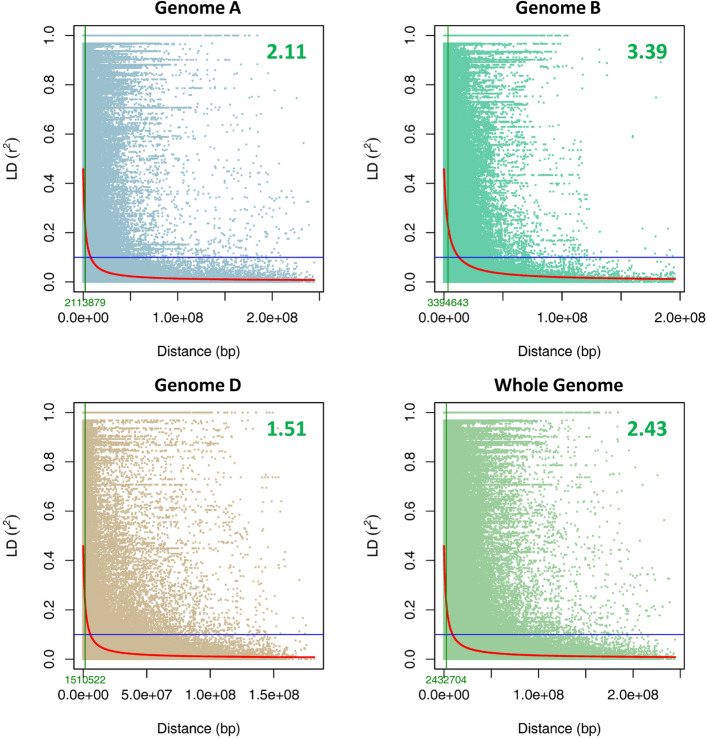
Keywords: Association mapping; Genetic structure analysis; Linkage disequilibrium; Stress susceptibility index (SSI); Stress tolerance index (STI).
© 2024. The Author(s).
Conflict of interest statement
The authors declare that they have no known competing financial interests or personal relationships that could have appeared to influence the work reported in this paper.
Figures
Similar articles
-
Genome-wide association mapping of spot blotch resistance in wheat association mapping initiative (WAMI) panel of spring wheat (Triticum aestivum L.).PLoS One. 2018 Dec 17;13(12):e0208196. doi: 10.1371/journal.pone.0208196. eCollection 2018. PLoS One. 2018. PMID: 30557301 Free PMC article.
-
Analysis of genetic diversity and genome-wide association study for drought tolerance related traits in Iranian bread wheat.BMC Plant Biol. 2023 Sep 15;23(1):431. doi: 10.1186/s12870-023-04416-3. BMC Plant Biol. 2023. PMID: 37715130 Free PMC article.
-
Genome-wide association mapping of black point reaction in common wheat (Triticum aestivum L.).BMC Plant Biol. 2017 Nov 23;17(1):220. doi: 10.1186/s12870-017-1167-3. BMC Plant Biol. 2017. PMID: 29169344 Free PMC article.
-
Genetic dissection for seedling root-related traits using multiple-methods in bread wheat (Triticum aestivum L.).Theor Appl Genet. 2025 Mar 7;138(3):66. doi: 10.1007/s00122-025-04847-6. Theor Appl Genet. 2025. PMID: 40053141 Review.
-
Recognizing the hidden half in wheat: root system attributes associated with drought tolerance.J Exp Bot. 2021 Jul 10;72(14):5117-5133. doi: 10.1093/jxb/erab124. J Exp Bot. 2021. PMID: 33783492 Review.
Cited by
-
Genetic Dissection of Drought Tolerance in Maize Through GWAS of Agronomic Traits, Stress Tolerance Indices, and Phenotypic Plasticity.Int J Mol Sci. 2025 Jun 29;26(13):6285. doi: 10.3390/ijms26136285. Int J Mol Sci. 2025. PMID: 40650063 Free PMC article.
-
Deciphering the genetic basis of novel traits that discriminate useful and non-useful biomass to enhance harvest index in wheat.Plant Genome. 2024 Dec;17(4):e20512. doi: 10.1002/tpg2.20512. Epub 2024 Sep 18. Plant Genome. 2024. PMID: 39295194 Free PMC article.
-
Spatial patterns and key driving factors of wheat harvest index under irrigation and rainfed conditions in arid regions.Front Plant Sci. 2025 Jun 9;16:1614204. doi: 10.3389/fpls.2025.1614204. eCollection 2025. Front Plant Sci. 2025. PMID: 40551775 Free PMC article.
-
Identification of novel marker-trait associations for agronomic traits in bread wheat under WANA environments through GWAS.PLoS One. 2025 Aug 8;20(8):e0329681. doi: 10.1371/journal.pone.0329681. eCollection 2025. PLoS One. 2025. PMID: 40779575 Free PMC article.
-
Natural variation in the chickpea metabolome under drought stress.Plant Biotechnol J. 2024 Dec;22(12):3278-3294. doi: 10.1111/pbi.14447. Epub 2024 Oct 16. Plant Biotechnol J. 2024. PMID: 39411896 Free PMC article.
References
-
- Ahmad A, Aslam Z, Javed T, Hussain S, Raza A, Shabbir R, et al. Screening of wheat (Triticum aestivum L.) genotypes for drought tolerance through agronomic and physiological response. Agronomy. 2022;12:287. doi: 10.3390/agronomy12020287. - DOI
-
- Ahmed HGM-D, Sajjad M, Li M, Azmat MA, Rizwan M, Maqsood RH, et al. Selection criteria for drought-tolerant bread wheat genotypes at seedling stage. Sustainability. 2019;11:2584. doi: 10.3390/su11092584. - DOI
-
- Alexander L, Kirigwi F, Fritz A, Fellers J. Mapping and quantitative trait loci analysis of drought tolerance in a spring wheat population using amplified fragment length polymorphism and diversity array technology markers. Crop Sci. 2012;52:253–261. doi: 10.2135/cropsci2011.05.0267. - DOI
MeSH terms
Grants and funding
LinkOut - more resources
Full Text Sources
Other Literature Sources
Research Materials
