. 2024 May;11(18):e2309984.
doi: 10.1002/advs.202309984. Epub 2024 Mar 2.

Elesclomol Loaded Copper Oxide Nanoplatform Triggers Cuproptosis to Enhance Antitumor Immunotherapy

Affiliations

Elesclomol Loaded Copper Oxide Nanoplatform Triggers Cuproptosis to Enhance Antitumor Immunotherapy

Xufeng Lu et al. Adv Sci (Weinh). 2024 May.

Abstract

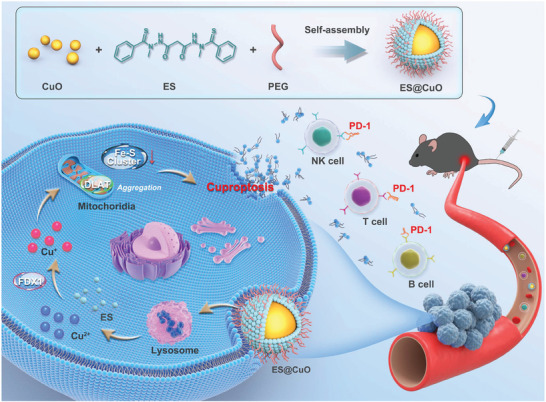
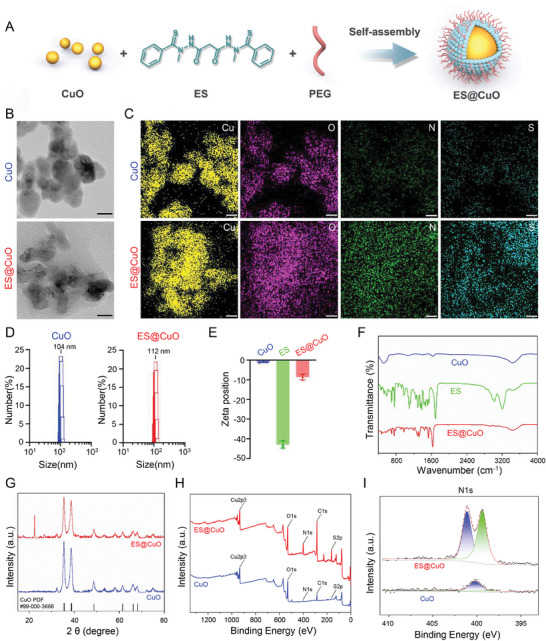
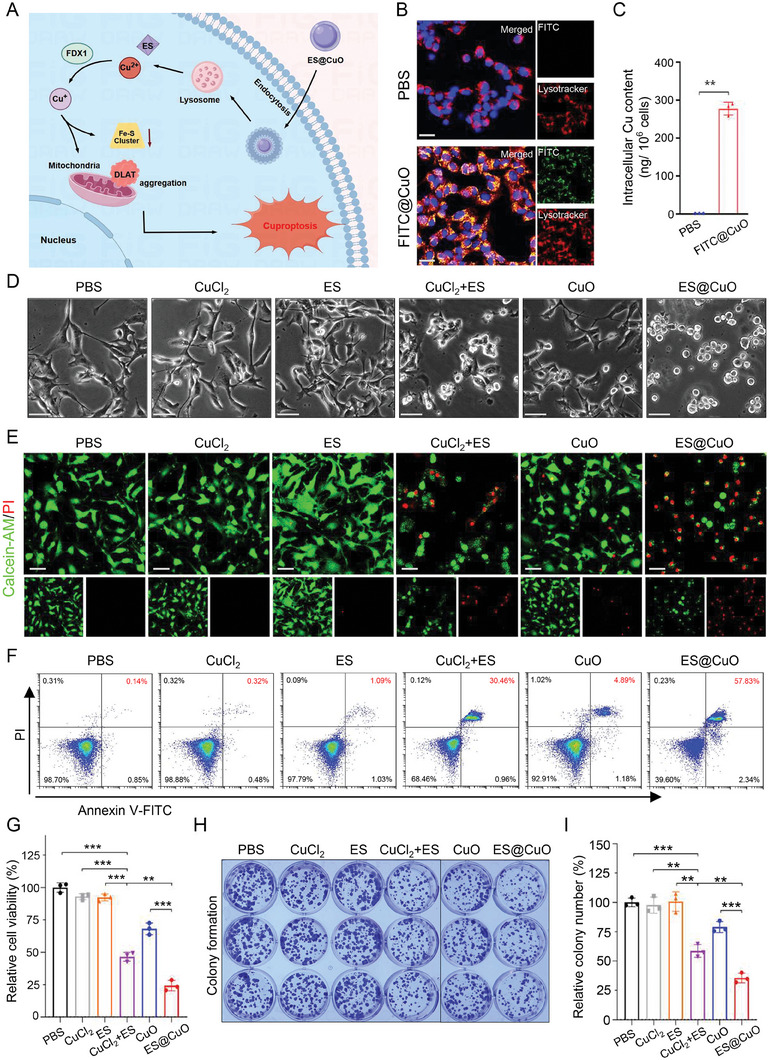
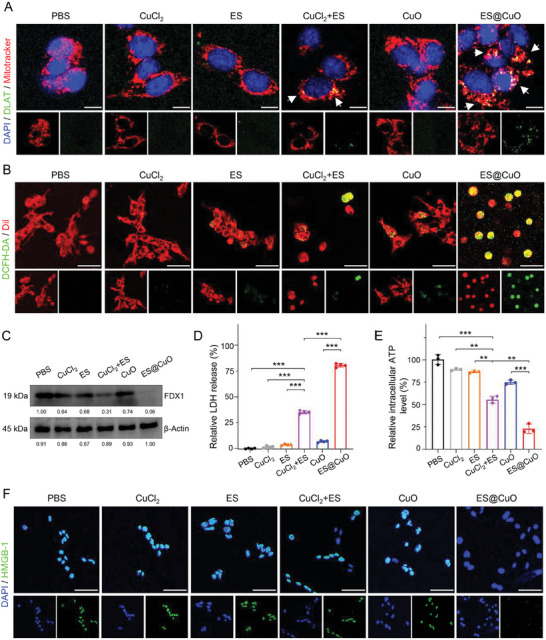
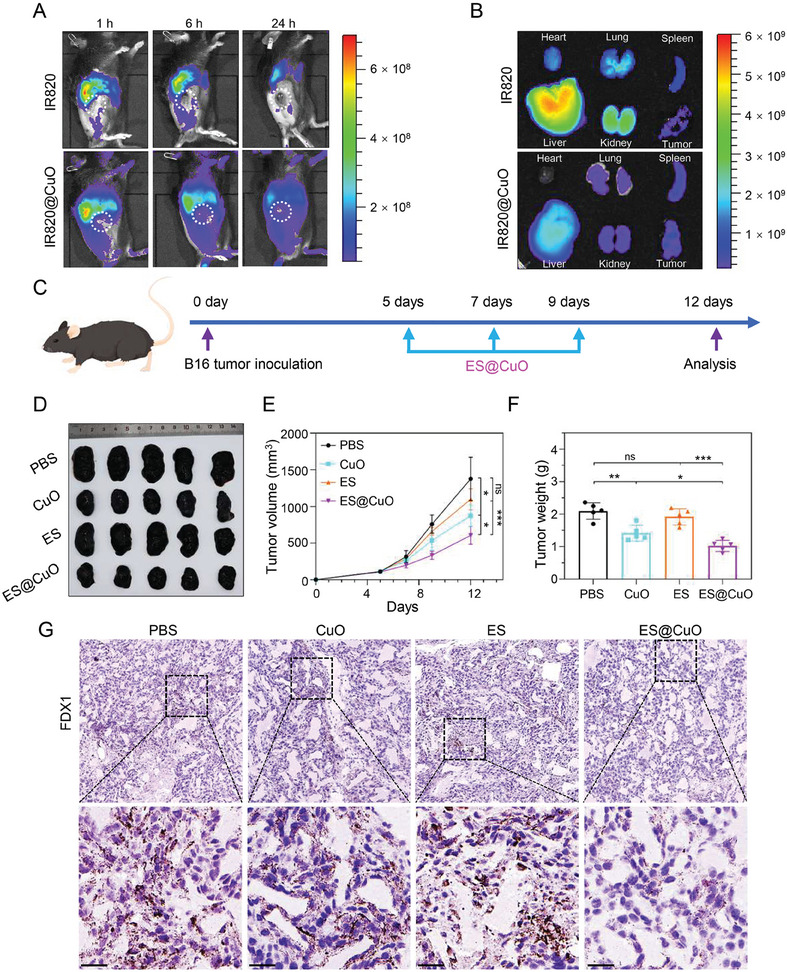
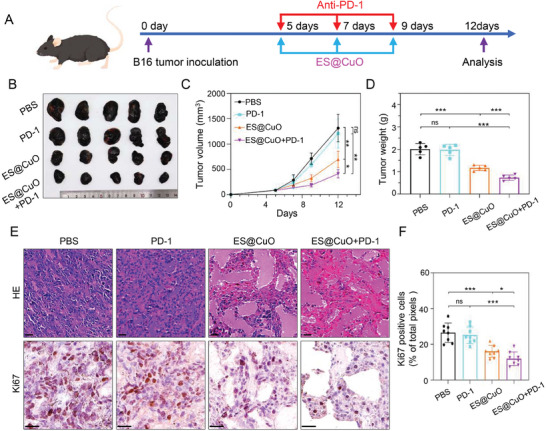
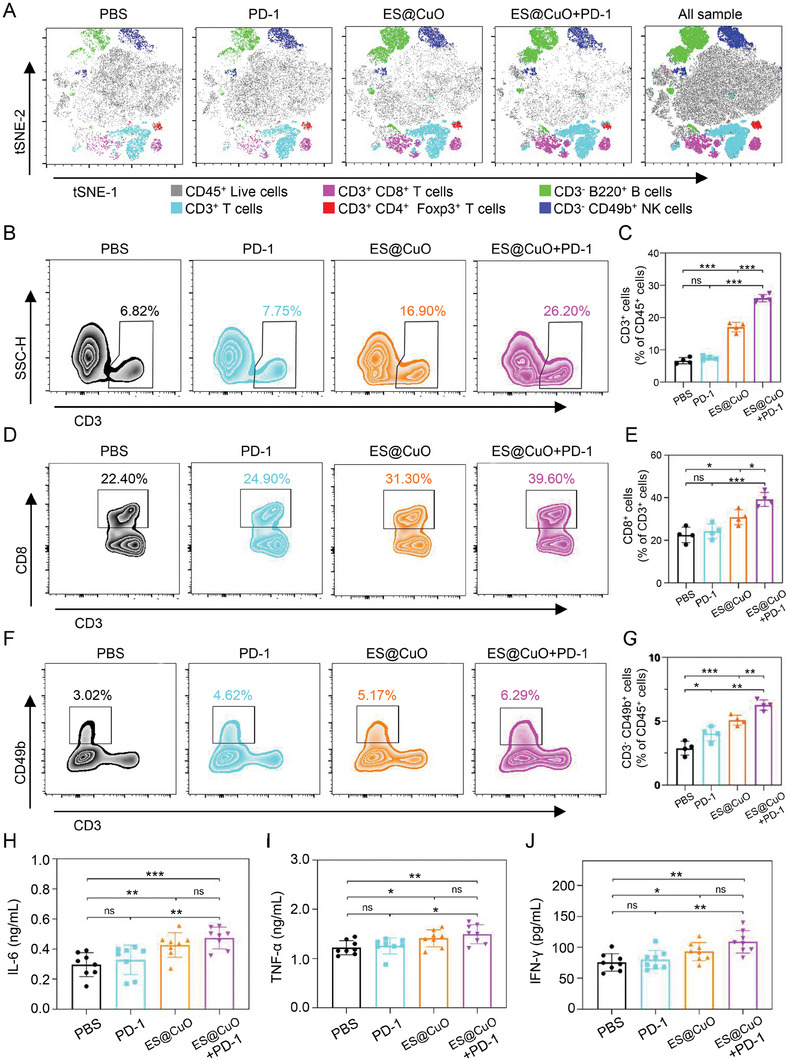
The induction of cuproptosis, a recently identified form of copper-dependent immunogenic cell death, is a promising approach for antitumor therapy. However, sufficient accumulation of intracellular copper ions (Cu2+) in tumor cells is essential for inducing cuproptosis. Herein, an intelligent cuproptosis-inducing nanosystem is constructed by encapsulating copper oxide (CuO) nanoparticles with the copper ionophore elesclomol (ES). After uptake by tumor cells, ES@CuO is degraded to release Cu2+ and ES to synergistically trigger cuproptosis, thereby significantly inhibiting the tumor growth of murine B16 melanoma cells. Moreover, ES@CuO further promoted cuproptosis-mediated immune responses and reprogrammed the immunosuppressive tumor microenvironment by increasing the number of tumor-infiltrating lymphocytes and secreted inflammatory cytokines. Additionally, combining ES@CuO with programmed cell death-1 (PD-1) immunotherapy substantially increased the antitumor efficacy in murine melanoma. Overall, the findings of this study can lead to the use of a novel strategy for cuproptosis-mediated antitumor therapy, which may enhance the efficacy of immune checkpoint inhibitor therapy.

Keywords: CuO; PD‐1; cuproptosis; elesclomol; immunotherapy.


Conflict of interest statement

The authors declare no conflict of interest.

Figures

Scheme 1
Scheme 1
Schematic illustration of the mechanism of a cuproptosis‐inducing nanosystem (denoted ES@CuO) combined with PD‐1 for synergistic tumor immunotherapy in melanoma.
Figure 1
Figure 1
Preparation and characterization of ES@CuO. A) Schematic diagram of the preparation of ES@CuO NPs. B) Representative transmission electron microscopy (TEM) images of CuO NPs and ES@CuO NPs. Scale bar: 20 nm. C) Representative element maps (Cu, O, N, and S) of CuO NPs and ES@CuO NPs. Scale bar: 20 nm. ES formula: C19H20N4O2S2. D) and E) The hydrodynamic size distributions and zeta potentials of CuO NPs and ES@CuO NPs (in ultrapure water) (n = 3). F) Fourier transform infrared (FTIR) spectra of CuO NPs, ES, and ES@CuO NPs. G) XRD analysis of CuO NPs and ES@CuO NPs. H) XPS analysis of CuO NPs and ES@CuO NPs. I) High‐resolution N1s XPS spectra of CuO NPs and ES@CuO NPs. The data are presented as the mean ± SD.
Figure 2
Figure 2
In vitro antitumor effect of ES@CuO on B16 tumor cells. A) Schematic of the possible mechanism of ES@CuO‐induced cuproptosis. B) Representative confocal microscopy images of B16 cells after incubation with FITC@CuO NPs for 6 h. The cell nuclei were stained with Hoechst 33342 (blue), and the lysosomes were stained with LysoTracker (red). Scale bars: 25 µm. C) Intracellular uptake of Cu by B16 cells after incubation with FITC@CuO NPs for 6 h. D) Representative morphological changes in B16 cells after different treatments. Scale bar: 50 µm. E) Live/dead staining of B16 cells after different treatments. Scale bar: 50 µm. F) After the indicated treatments, B16 tumor cells were stained with Annexin V‐FITC and PI and then analyzed by flow cytometry. G) Cell viability of B16 cells after 24 h of incubation with the indicated treatments (n = 3). H) Colony of B16 cells treated with different NPs and I) the corresponding quantification of colony number (n = 3). The data are presented as the mean ± SD; p values were calculated using an unpaired, 2‐tailed Student's t test with Welch's correction; **p < 0.01; ***p < 0.001.
Figure 3
Figure 3
ES@CuO induced cuproptosis in vitro. A) Representative confocal microscopy images of DLAT aggregation in B16 cells after the indicated treatment. The white arrows indicate DLAT aggregation. Scale bars: 10 µm. B) Representative confocal microscopy images of ROS in B16 cells stained with DCFH‐DA fluorescent probes after various treatments. Scale bars: 50 µm. C) Western blot analysis of cuproptosis‐related protein (FDX1) activation in B16 cells after different treatments. D) Lactic dehydrogenase (LDH) release assay of B16 cells following the indicated treatments (n = 4). E) Intracellular ATP levels of B16 cells after 24 h of incubation with the indicated treatments (n = 3). F) Representative confocal microscopy images of HMGB‐1 in B16 cells after the indicated treatment. Scale bars: 50 µm. Data are shown as the mean ± SD; p values were calculated using an unpaired, 2‐tailed Student's t test with Welch's correction; **p < 0.01; ***p < 0.001.
Figure 4
Figure 4
Antitumor effects mediated by ES@CuO in vivo. A) Biodistribution after intravenous injection of free IR820 and IR820@CuO NPs at the indicated time points. B) Ex vivo imaging of IR820 fluorescence intensity in major organs and tumors collected at 6 h post‐injection. C) Schematic illustration of the experimental schedule for B16 tumor‐bearing mice. D) Corresponding tumor photographs, E) tumor growth curves, and F) ex vivo tumor weights of the B16 tumor‐bearing mice after various treatments (n = 5). G) IHC analysis of FDX1 expression in tumor tissues after different treatments. Scale bar: 25 µm. Data are shown as the mean ± SD; p values were calculated using an unpaired, 2‐tailed Student's t test with Welch's correction; ns, not significant; *p < 0.05; **p < 0.01; ***p < 0.001.
Figure 5
Figure 5
The antitumor efficacy of combined ES@CuO and PD‐1 therapy in vivo. A) Schematic illustration of the therapeutic schedule of combined ES@CuO and PD‐1 therapy in the B16 tumor model. B) Corresponding tumor photographs, C) tumor growth curves, and D) ex vivo tumor weights of the B16 tumor‐bearing mice after the indicated treatments (n = 5). E) Representative H&E staining and Ki67 immunohistochemical staining of tumor tissues from mice given various treatments; scale bar: 25 µm. F) Quantification of Ki67 expression in tumor tissue from mice given the indicated treatments (n = 8). Data are shown as the mean ± SD; p values were calculated using an unpaired, 2‐tailed Student's t test with Welch's correction; ns, not significant; *p < 0.05; **p < 0.01; ***p < 0.001.
Figure 6
Figure 6
Assessment of antitumor immunity mediated by ES@CuO and PD‐1 combined therapy in vivo. A) T‐SNE analyses of the populations of tumor‐infiltrating lymphocytes, including CD45+ live lymphocytes, CD3+ T cells, CD3+CD8+ T cells, CD3+CD4+Foxp3+ Treg cells, CD3B220+ B cells and CD3CD49b+ NK cells, in the tumor tissues. B and C) Representative flow cytometry plots and the corresponding percentages of the CD3+ T‐cell population in tumor tissues from mice subjected to various treatments (n = 4). D and E) Representative flow cytometry plots and the corresponding percentages of the CD3+CD8+ T‐cell population in tumor tissues from mice subjected to various treatments (n = 4). F and G) Representative flow cytometry plots and the corresponding percentages of the CD3CD49b+ NK cell population in tumor tissues from mice subjected to various treatments (n = 4). H–J) The serum levels of inflammatory factors (IL‐6, TNF‐α, and IFN‐γ) were measured via ELISAs (n = 8). Data are shown as the mean ± SD; p values were calculated using an unpaired, 2‐tailed Student's t test with Welch's correction; ns, not significant; *p < 0.05; **p < 0.01; ***p < 0.001.

References

    1. Guo W., Wang H., Li C., Signal Transduction and Targeted Therapy. 2021, 6, 424. - PMC - PubMed
    1. Darp R., Ceol C., Pigment Cell & Melanoma Research. 2021, 34, 280. - PubMed
    1. Carr S., Smith C., Wernberg J., Surgical Clinics. 2020, 100, 1. - PubMed
    1. Sadeq M. A., Ashry M. H., Ghorab R. M. F., Afify A. Y., Sci. Rep. 2023, 13, 10257. - PMC - PubMed
    1. Xiong K., Qi M., Stoeger T., Zhang J., Chen S., Frontiers in Immunology. 2022, 13, 1000927. - PMC - PubMed

LinkOut - more resources