. 2024 May;11(17):e2302988.
doi: 10.1002/advs.202302988. Epub 2024 Mar 2.

Remodeling of the Intra-Conduit Inflammatory Microenvironment to Improve Peripheral Nerve Regeneration with a Neuromechanical Matching Protein-Based Conduit

Affiliations

Remodeling of the Intra-Conduit Inflammatory Microenvironment to Improve Peripheral Nerve Regeneration with a Neuromechanical Matching Protein-Based Conduit

Jia-Yi Wang et al. Adv Sci (Weinh). 2024 May.

Abstract

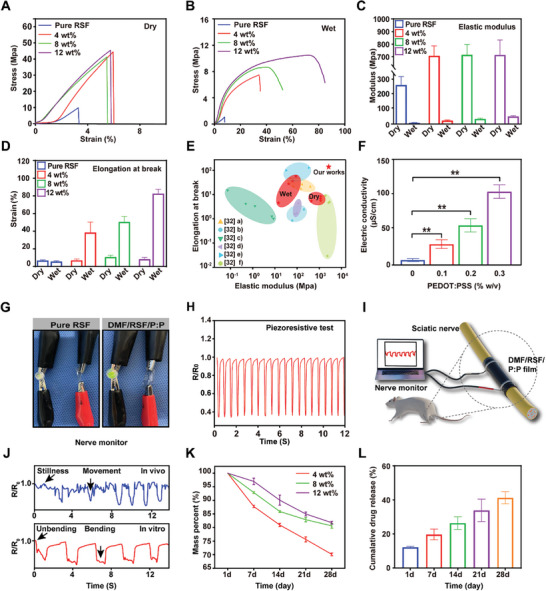
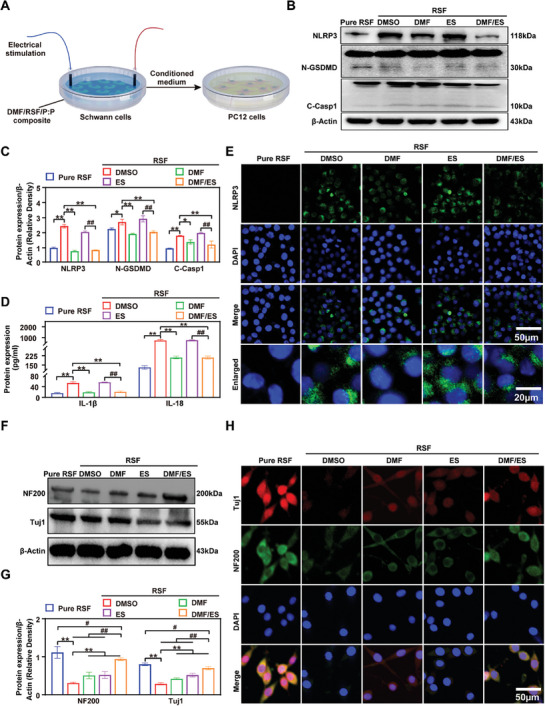
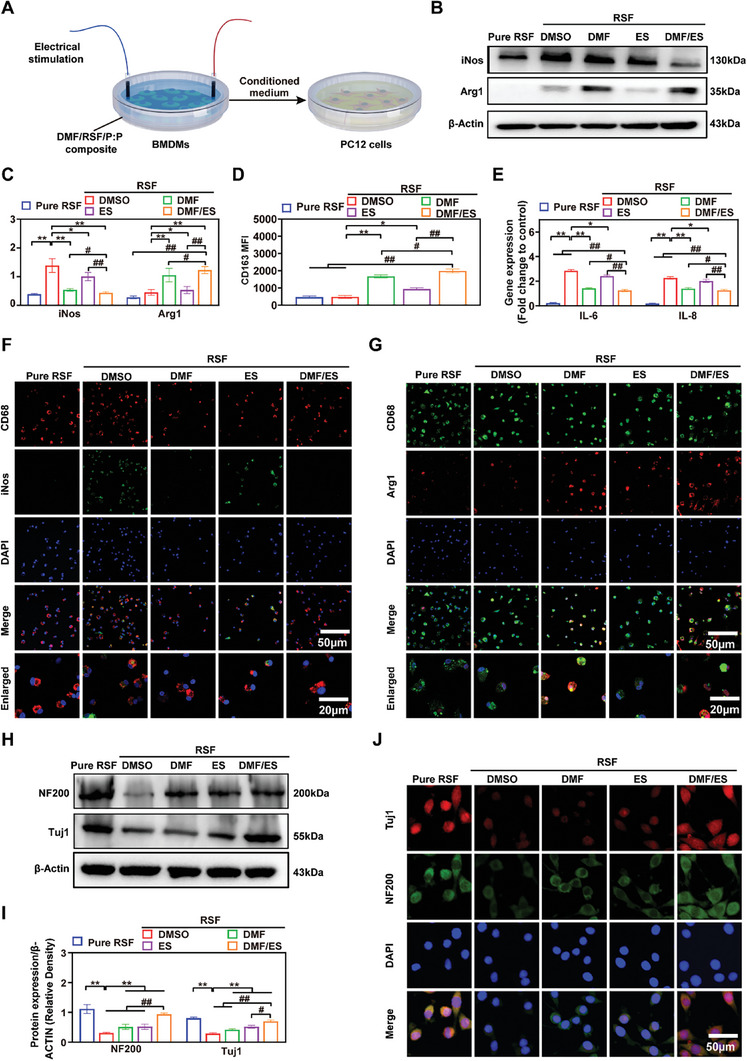
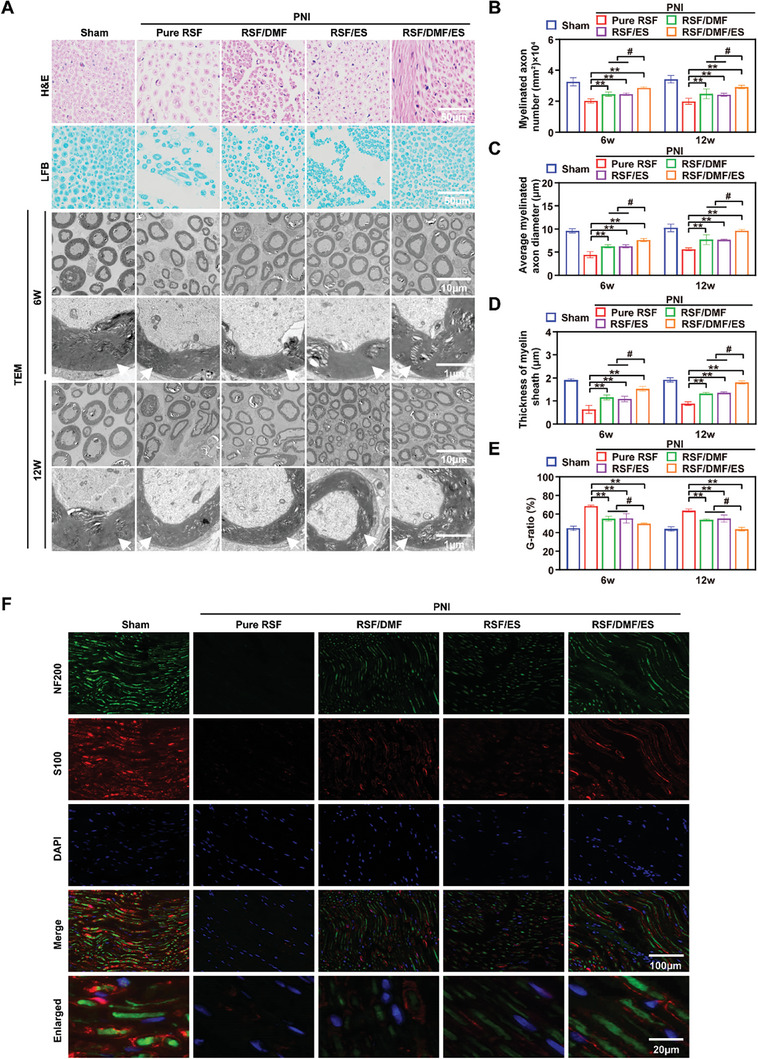
Peripheral nerve injury (PNI) remains a challenging area in regenerative medicine. Nerve guide conduit (NGC) transplantation is a common treatment for PNI, but the prognosis of NGC treatment is unsatisfactory due to 1) neuromechanical unmatching and 2) the intra-conduit inflammatory microenvironment (IME) resulting from Schwann cell pyroptosis and inflammatory-polarized macrophages. A neuromechanically matched NGC composed of regenerated silk fibroin (RSF) loaded with poly(3,4-ethylenedioxythiophene): poly(styrene sulfonate) (P:P) and dimethyl fumarate (DMF) are designed, which exhibits a matched elastic modulus (25.1 ± 3.5 MPa) for the peripheral nerve and the highest 80% elongation at break, better than most protein-based conduits. Moreover, the NGC can gradually regulate the intra-conduit IME by releasing DMF and monitoring sciatic nerve movements via piezoresistive sensing. The combination of NGC and electrical stimulation modulates the IME to support PNI regeneration by synergistically inhibiting Schwann cell pyroptosis and reducing inflammatory factor release, shifting macrophage polarization from the inflammatory M1 phenotype to the tissue regenerative M2 phenotype and resulting in functional recovery of neurons. In a rat sciatic nerve crush model, NGC promoted remyelination and functional and structural regeneration. Generally, the DMF/RSF/P:P conduit provides a new potential therapeutic approach to promote nerve repair in future clinical treatments.

Keywords: electrical stimulation; intra‐conduit inflammatory microenvironment; neuromechanical matching; peripheral nerve regeneration; silk fibroin.


Conflict of interest statement

The authors declare no conflict of interest.

Figures

Scheme 1
Scheme 1
Scheme showing the fabrication and application of multifunctional conduits for peripheral nerve regeneration. I) Fabrication process of DMF/RSF/P:P conduits. II) Concept and mechanisms of DMF/RSF/P:P conduits combined with electrical stimulation (ES) to alleviate the inflammatory response in the microenvironment at nerve injury sites by inducing macrophage polarization toward the M2 subtype and inhibiting Schwann cell pyroptosis.
Figure 1
Figure 1
Morphology and structure of DMF/RSF/P:P conduits. A) Macrograph of a pure RSF in the tiled state and a DMF/4 wt% RSF/P:P conduit in the curved state. B) Scanning electron microscopy images of DMF/RSF/P:P conduits with different RSF concentrations. C) Cryo‐SEM images of pure RSF and DMF/RSF/P:P conduits (4 wt.% RSF). D) AFM image of DMF/RSF/P:P conduits with different RSF concentrations. E) FT‐IR spectra of DMF/RSF/P:P conduits with different RSF concentrations. F) Fitting analysis of different conduits based on the amide I band in the FT‐IR spectra. G) XRD patterns of the different conduit samples. H) Deconvolution analysis of the XRD curves. I) WAXS results of Pure RSF and DMF/RSF/P:P conduits. J) Contact angles of DMF/RSF/P:P conduits. Figure 1F was analyzed using one‐way ANOVA followed by Tukey's post hoc test and are presented as the means ± SDs. ** p < 0.01 compared to the Pure RSF group. * p < 0.05 compared to the Pure RSF group. n = 6. P:P, PEDOT:PSS.
Figure 2
Figure 2
Multifunctional properties of DMF/RSF/P:P conduits. Stress‐strain curves of pure RSF conduits and DMF/RSF/P:P composites in the dry A) and wet B) states. C) The elastic modulus of Pure RSF conduits and DMF/RSF/P:P composites with different RSF concentrations in the dry and wet states. D) Elongation at break of DMF/RSF/P:P composites with different RSF concentrations in the dry and wet states. E) Ashby plot with elongation at break versus elastic modulus, where the red area represents the DMF/RSF/P:P conduit. F) Electrical conductivity of conduits with different PEDOT:PSS concentrations. G) Electrically conductive paths made of pure RSF conduits and DMF/RSF/P:P composites for LED illumination. H) Piezoresistive test of DMF/RSF/P:P composites. I) Schematic diagram of DMF/RSF/P:P conduits monitoring sciatic nerve movements. J) Results of DMF/RSF/P:P conduits monitoring sciatic nerve movements in vivo and in vitro. K) Degradation behavior of DMF/RSF/P:P composites in vitro. L) Cumulative DMF release results for DMF/4 wt.% RSF/P:P conduits after 28 days were determined by using HPLC in vitro. Figure 2F was analyzed using one‐way ANOVA followed by Tukey's post hoc test and are presented as the means ± SDs. ** p < 0.01, * p < 0.05, and ** indicate statistical significance between the indicated groups; n = 6. HPLC, high‐performance liquid chromatography.
Figure 3
Figure 3
DMF/RSF/P:P conduits combined with ES attenuate the inhibitory effects of Schwann cell pyroptosis on PC12 cell function in vitro. A) Schematic diagram of DMF/RSF/P:P conduits combined with ES attenuating the inhibitory effects on PC12 cell function induced by Schwann cell pyroptosis. B,C) Protein levels and quantitative analysis of the pyroptosis‐related proteins NLRP3, N‐GSDMD, and C‐Casp1 in Schwann cells seeded in different conduit groups. β‐Actin was used as an internal control. D) IL‐18 and IL‐1β protein levels in culture supernatants of Schwann cells seeded in different conduit groups determined via ELISA. E) Immunofluorescence staining for NLRP3 (green) in Schwann cells seeded in different groups of membranes. (DAPI: blue). F,G) Protein levels and quantitative analysis of NF200 and Tuj1 in PC12 cells cultured in conditioned media obtained from Schwann cells seeded on different membranes. β‐Actin was used as an internal control. (H) Immunofluorescence staining for NF200 (green) and Tuj1 (red) in PC12 cells treated with Schwann cell‐conditioned media (DAPI: blue). Figure 3C,D,G were analyzed using one‐way ANOVA followed by Tukey's post hoc test and are presented as the means ± SDs. ** p < 0.01 compared to the RSF/DMSO group. * < 0.05 compared to the RSF/DMSO group. ## p < 0.01 compared to the RSF/DMF/ES group. # p < 0.05 compared to the RSF/DMF/ES group. n = 3.
Figure 4
Figure 4
DMF/RSF/P:P conduits combined with ES promote PC12 cell function by inducing macrophage polarization toward the M2 subtype in vitro. A) Schematic diagram of DMF/RSF/P:P conduits combined with ES indirectly promoting PC12 cell function by facilitating M1 to M2 macrophage polarization. B,C) Protein levels and quantitative analysis of iNOS and Arg1 in BMDMs seeded in different conduit groups for 24 h. β‐Actin was used as an internal control. D) CD163 MFI in BMDMs treated with different interventions. E) Real‐time PCR analysis of IL‐6 and IL‐8 in BMDMs from different groups. F) Immunofluorescence staining for CD68 (red) and iNOS (green) in BMDMs treated with different interventions for 24 h. G) Immunofluorescence staining for CD68 (green) and Arg1 (red) in BMDMs from different groups. H,I) Protein levels and quantitative analysis of NF200 and Tuj1 in PC12 cells cultured in conditioned media from BMDMs treated with different interventions for 24 h. β‐Actin was used as an internal control. J) Immunofluorescence staining for NF200 (green) and Tuj1 (red) in PC12 cells cultured in conditioned media from BMDMs (DAPI: blue). Figure 4C–E,I were analyzed using one‐way ANOVA followed by Tukey's post hoc test and are presented as the means ± SDs. ** p < 0.01 compared to the RSF/DMSO group. * p < 0.05 compared to the RSF/DMSO group. ## p < 0.01 compared to the RSF/DMF/ES group. # p < 0.05 compared to the RSF/DMF/ES group. n = 3.
Figure 5
Figure 5
Effect of conductive DMF/RSF/P:P conduits on inhibiting Schwann cell pyroptosis and inducing macrophage polarization toward the M2 subtype in vivo. A,B) Real‐time PCR analysis of NLRP3 and inflammation‐related factors in regenerated nerve tissue. C,D) Protein levels and quantitative analysis of the pyroptosis‐related proteins NLRP3, N‐GSDMD, and C‐Casp1 in regenerated nerves 2 weeks after crush injury. β‐Actin was used as an internal control. E) Immunofluorescence staining for S100 (green) and NLRP3 (red) in regenerated nerves 2 weeks postoperatively (DAPI: blue). F) Real‐time PCR analysis of iNOS and Arg1. G,H) Protein levels and quantitative analysis of iNOS and Arg1 in the regenerated nerves. β‐Actin was used as an internal control. I,J) Immunofluorescence staining for CD68 (green) and Arg1 (red) in regenerated nerves 2 weeks postoperatively (DAPI: blue). Figure 5A,B,D,F,H were analyzed using one‐way ANOVA followed by Tukey's post hoc test and are presented as the means ± SDs. ** p < 0.01 compared to the Pure RSF group. * p < 0.05 compared to the Pure RSF group. ## p < 0.01 compared to the RSF/DMF/ES group. # p < 0.05 compared to the RSF/DMF/ES group. n = 6.
Figure 6
Figure 6
Functional assessment of nerve regeneration A) Schematic diagram of the peripheral nerve injury model and assessment of nerve regeneration. B) Repair of crushed nerves using DMF/RSF/P:P conduits. C,D) Footprints and gaits were recorded using SFI analysis at 4, 8, and 12 weeks postoperatively. E) Von Frey withdrawal threshold test (% preoperatively) at 4, 8, and 12 weeks postoperatively. F) Electrophysiological analysis. G) Peak amplitude of the CMAP at 4, 8, and 12 weeks postoperatively. H) Latency of CMAP onset in the five groups. Figure 6D,E,G,H were analyzed using one‐way ANOVA followed by Tukey's post hoc test and are presented as the means ± SDs. ** p < 0.01 compared to the Pure RSF group. * p < 0.05 compared to the Pure RSF group. ## p < 0.01 compared to the RSF/DMF/ES group. # p < 0.05 compared to the RSF/DMF/ES group; n = 6. ES, electrical stimulation; SFI, sciatic function index; CMAP, compound muscle action potential.
Figure 7
Figure 7
Remyelination of regenerated nerves. A) H&E staining, LFB staining, and TEM analysis of regenerated nerves. B) Several myelinated axons. C) Mean diameter of myelinated axons (µm). D) Myelin sheath thickness (µm). E) G‐ratio. F) Immunofluorescence staining for NF200 (green) and S100 (red) in the regenerated nerve at 12 weeks postoperatively (DAPI: blue). Figure 7B–E were analyzed using one‐way ANOVA followed by Tukey's post hoc test and are presented as the means ± SDs. ** p < 0.01 compared to the Pure RSF group. * p < 0.05 compared to the Pure RSF group. ## p < 0.01 compared to the RSF/DMF/ES group. # p < 0.05 compared to the RSF/DMF/ES group. n = 6 H&E, hematoxylin–eosin; LFB, Luxol fast blue; TEM, transmission electron microscopy. Red arrowheads indicate myelinated nerve fibers.
Figure 8
Figure 8
Examination of the reinnervated gastrocnemius muscle. A) Digital images, Masson, and H&E analysis of the gastrocnemius muscle. B–E) Muscle weight (ratio of injured/healthy leg), collagen volume fraction (%), muscle fiber area, and muscle fiber diameter were compared between groups. The data are expressed as the mean ± standard deviation. Figure 8B–E were analyzed using one‐way ANOVA followed by Tukey's post hoc test and are presented as the means ± SDs. ** p < 0.01 compared to the Pure RSF group. * p < 0.05 compared to the Pure RSF group. ## p < 0.01 compared to the RSF/DMF/ES group. # <p 0.05 compared to the RSF/DMF/ES group. n = 6 H&E, hematoxylin–eosin; LFB, Luxol fast blue; TEM, transmission electron microscopy.

References

    1. Yu T., Xu Y., Ahmad M. A., Javed R., Hagiwara H., Tian X., Curr. Neuropharmacol. 2021, 19, 2141. - PMC - PubMed
    1. Jin X. H., Fang J. Q., Wang J. G., Xu B., Wang X., Liu S. H., Chen F., Liu J. J., J. Mater. Chem. B. 2022, 10, 8771. - PubMed
    1. Zhang G., Ma L., Bai L., Li M., Guo T., Tian B., He Z., Fu Q., J. Control Rel. 2021, 334, 114. - PubMed
    1. Li W., Liang J., Li S., Wang L., Xu S., Jiang S., Song M., Meng H., Zhai D., Tang L., Yang Y., Zhang L., Zhang B., Int. Immunopharmacol. 2022, 110, 109026. - PubMed
    1. Zhang D., Li Z., Shi H., Yao Y., Du W., Lu P., Liang K., Hong L., Gao C., Bioact. Mater. 2022, 9, 134. - PMC - PubMed

Publication types

LinkOut - more resources