

Conventional and unconventional T-cell responses contribute to the prediction of clinical outcome and causative bacterial pathogen in sepsis patients
- PMID: 38430552
- PMCID: PMC11097916
- DOI: 10.1093/cei/uxae019
Conventional and unconventional T-cell responses contribute to the prediction of clinical outcome and causative bacterial pathogen in sepsis patients
Abstract
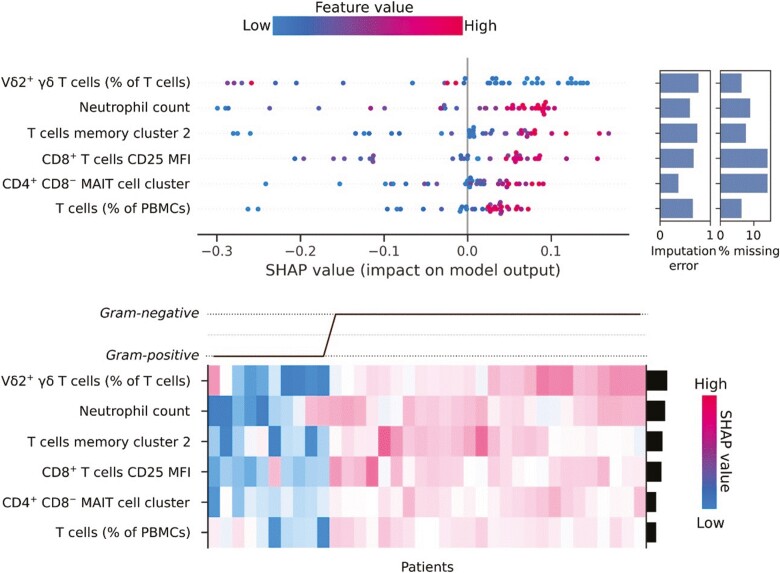
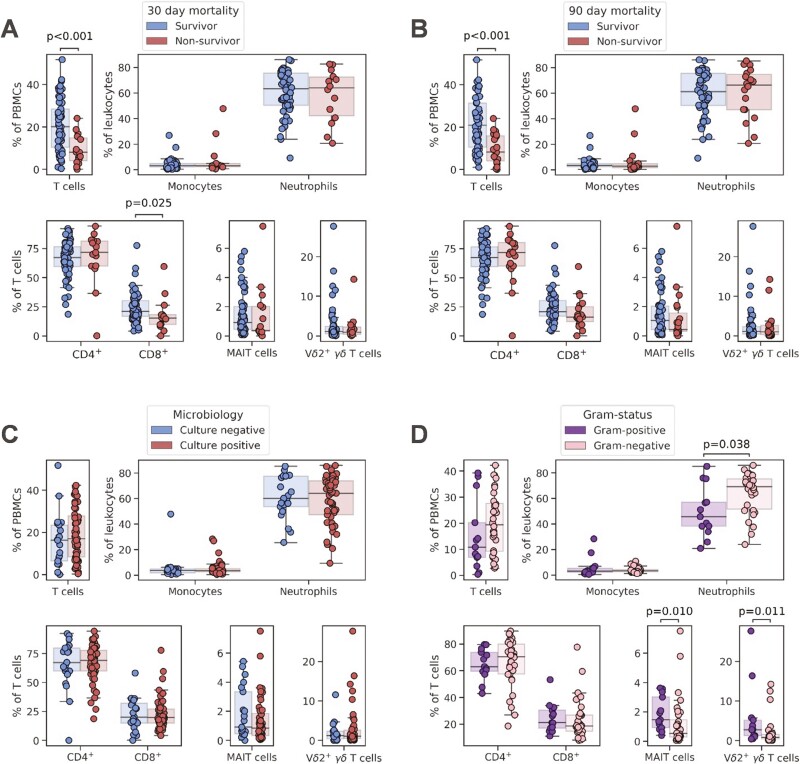
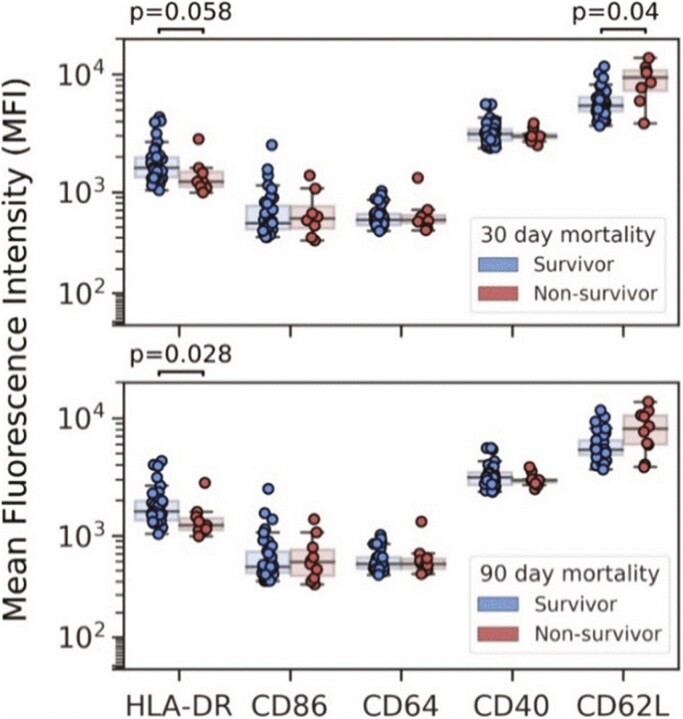
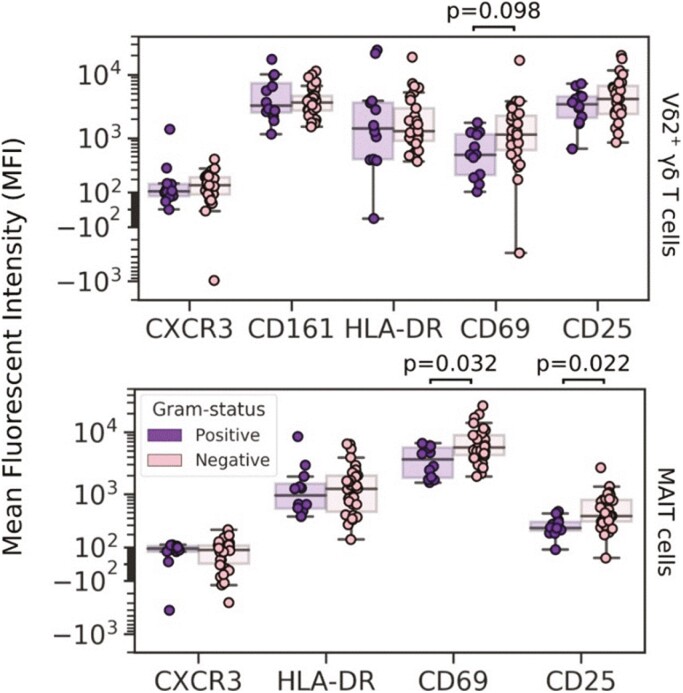
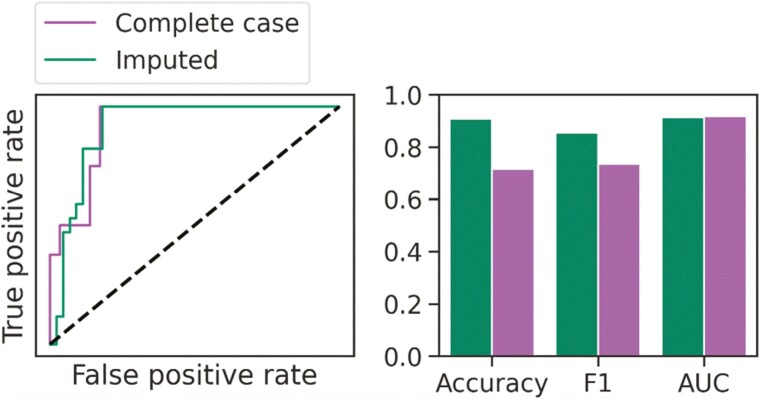
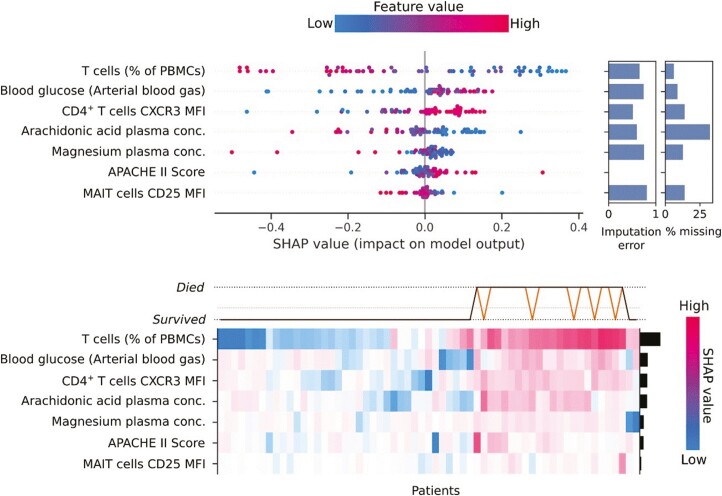
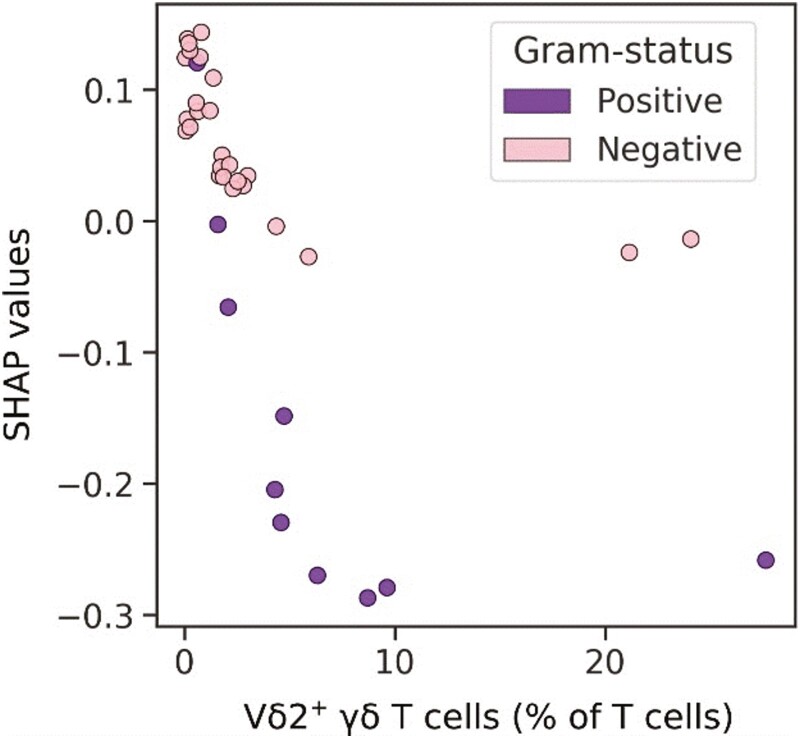
Sepsis is characterized by a dysfunctional host response to infection culminating in life-threatening organ failure that requires complex patient management and rapid intervention. Timely diagnosis of the underlying cause of sepsis is crucial, and identifying those at risk of complications and death is imperative for triaging treatment and resource allocation. Here, we explored the potential of explainable machine learning models to predict mortality and causative pathogen in sepsis patients. By using a modelling pipeline employing multiple feature selection algorithms, we demonstrate the feasibility of identifying integrative patterns from clinical parameters, plasma biomarkers, and extensive phenotyping of blood immune cells. While no single variable had sufficient predictive power, models that combined five and more features showed a macro area under the curve (AUC) of 0.85 to predict 90-day mortality after sepsis diagnosis, and a macro AUC of 0.86 to discriminate between Gram-positive and Gram-negative bacterial infections. Parameters associated with the cellular immune response contributed the most to models predictive of 90-day mortality, most notably, the proportion of T cells among PBMCs, together with expression of CXCR3 by CD4+ T cells and CD25 by mucosal-associated invariant T (MAIT) cells. Frequencies of Vδ2+ γδ T cells had the most profound impact on the prediction of Gram-negative infections, alongside other T-cell-related variables and total neutrophil count. Overall, our findings highlight the added value of measuring the proportion and activation patterns of conventional and unconventional T cells in the blood of sepsis patients in combination with other immunological, biochemical, and clinical parameters.
Keywords: cytokines; endotoxin shock; inflammation; sepsis; unconventional T cells.
© The Author(s) 2024. Published by Oxford University Press on behalf of the British Society for Immunology.
Conflict of interest statement
All authors of the article declare that they have no conflict of interests.
Figures

Similar articles
-
Sepsis is characterized by the increases in percentages of circulating CD4+CD25+ regulatory T cells and plasma levels of soluble CD25.Tohoku J Exp Med. 2008 Sep;216(1):61-8. doi: 10.1620/tjem.216.61. Tohoku J Exp Med. 2008. PMID: 18719339
-
[Polymyxin-B direct hemoperfusion (PMX-DHP) in gram negative sepsis].G Ital Nefrol. 2006 May-Jun;23 Suppl 36:S94-102. G Ital Nefrol. 2006. PMID: 17068736 Clinical Trial. Italian.
-
Effect of Interleukin-36β on Activating Autophagy of CD4+CD25+ Regulatory T cells and Its Immune Regulation in Sepsis.J Infect Dis. 2020 Oct 1;222(9):1517-1530. doi: 10.1093/infdis/jiaa258. J Infect Dis. 2020. PMID: 32421784
-
Clinical gram-positive sepsis: does it fundamentally differ from gram-negative bacterial sepsis?Crit Care Med. 1999 Aug;27(8):1608-16. doi: 10.1097/00003246-199908000-00039. Crit Care Med. 1999. PMID: 10470773 Review.
-
Immunopathogenesis of abdominal sepsis.Langenbecks Arch Surg. 2014 Jan;399(1):1-9. doi: 10.1007/s00423-013-1129-7. Langenbecks Arch Surg. 2014. PMID: 24121723 Review.
Cited by
-
Dynamic alterations of circulating lymphocytes during the trajectory of Hantaan virus-induced hemorrhagic fever with renal syndrome.Front Immunol. 2025 May 29;16:1567306. doi: 10.3389/fimmu.2025.1567306. eCollection 2025. Front Immunol. 2025. PMID: 40510360 Free PMC article.
-
Immunogenic cell death biomarkers for sepsis diagnosis and mechanism via integrated bioinformatics.Sci Rep. 2025 May 27;15(1):18575. doi: 10.1038/s41598-025-03282-3. Sci Rep. 2025. PMID: 40425742 Free PMC article.
-
Prediction of the infecting organism in peritoneal dialysis patients with acute peritonitis using interpretable Tsetlin Machines.Bioinform Adv. 2025 Jun 19;5(1):vbaf140. doi: 10.1093/bioadv/vbaf140. eCollection 2025. Bioinform Adv. 2025. PMID: 40630500 Free PMC article.
References
MeSH terms
Substances
Grants and funding
LinkOut - more resources
Full Text Sources
Medical
Research Materials
