. 2024 Mar 12;57(3):462-477.e9.
doi: 10.1016/j.immuni.2024.02.004. Epub 2024 Mar 1.

The transcription factor NF-κB orchestrates nucleosome remodeling during the primary response to Toll-like receptor 4 signaling

Affiliations

The transcription factor NF-κB orchestrates nucleosome remodeling during the primary response to Toll-like receptor 4 signaling

An-Chieh Feng et al. Immunity. .

Abstract

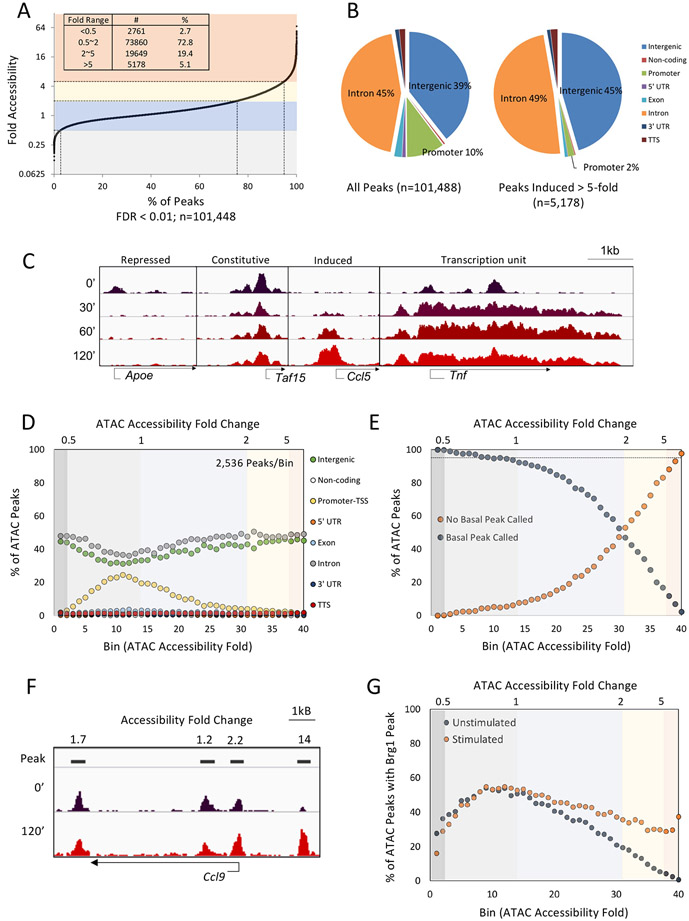
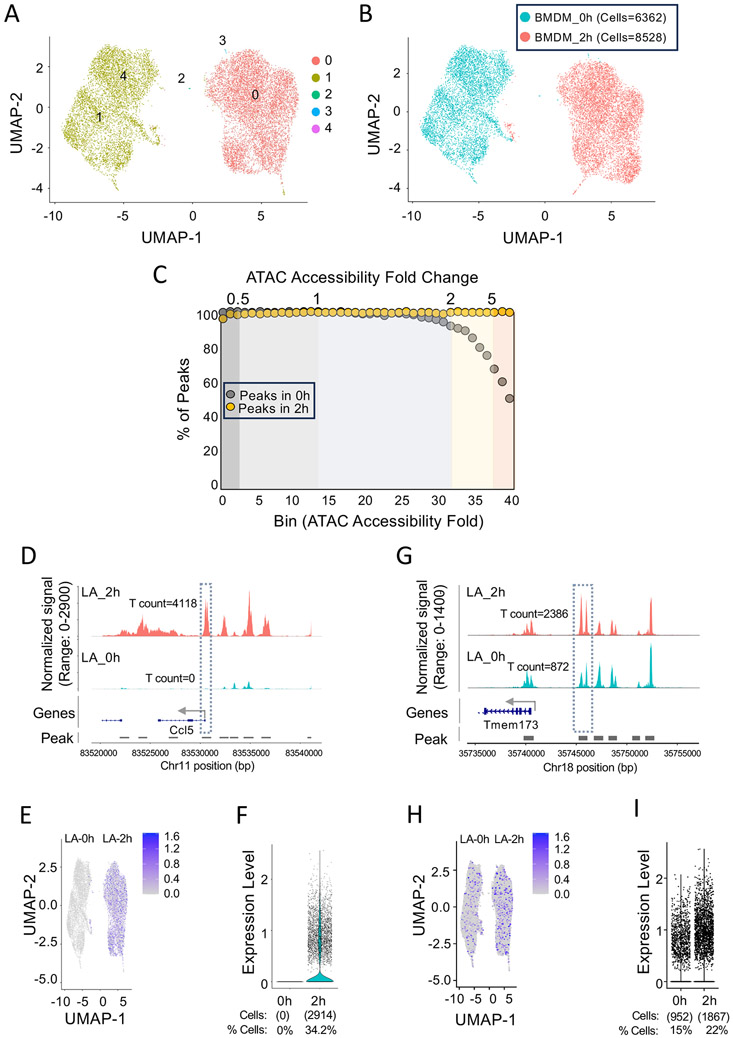
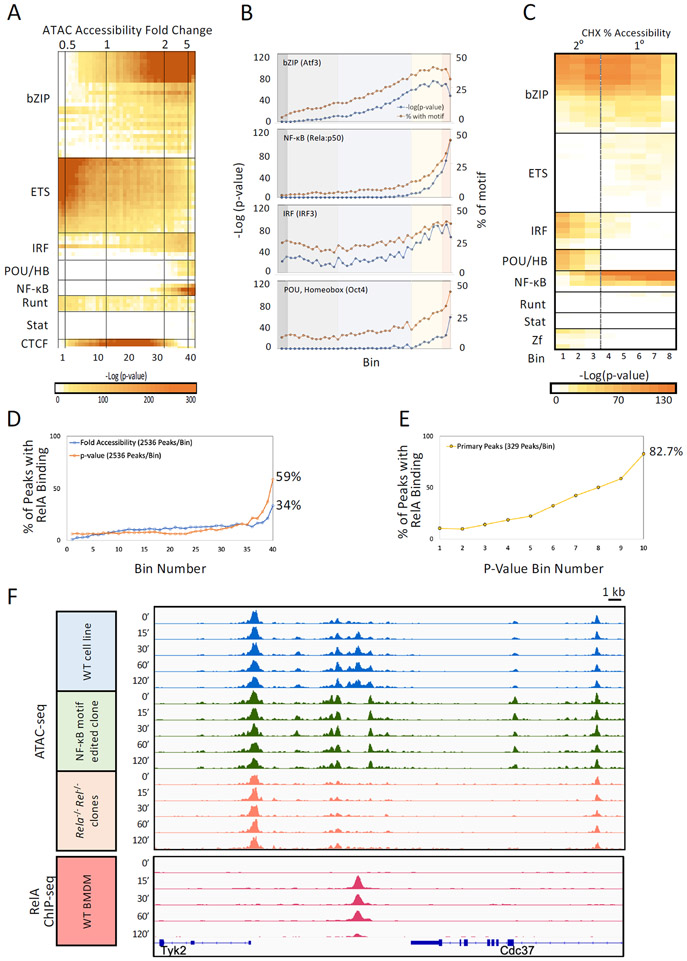
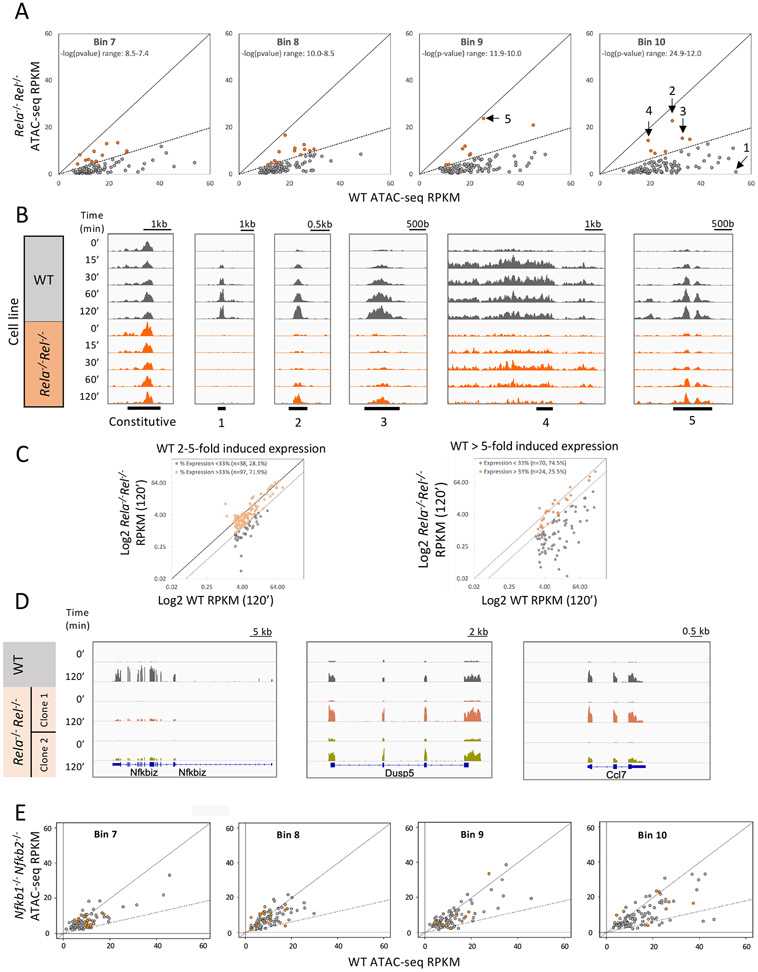
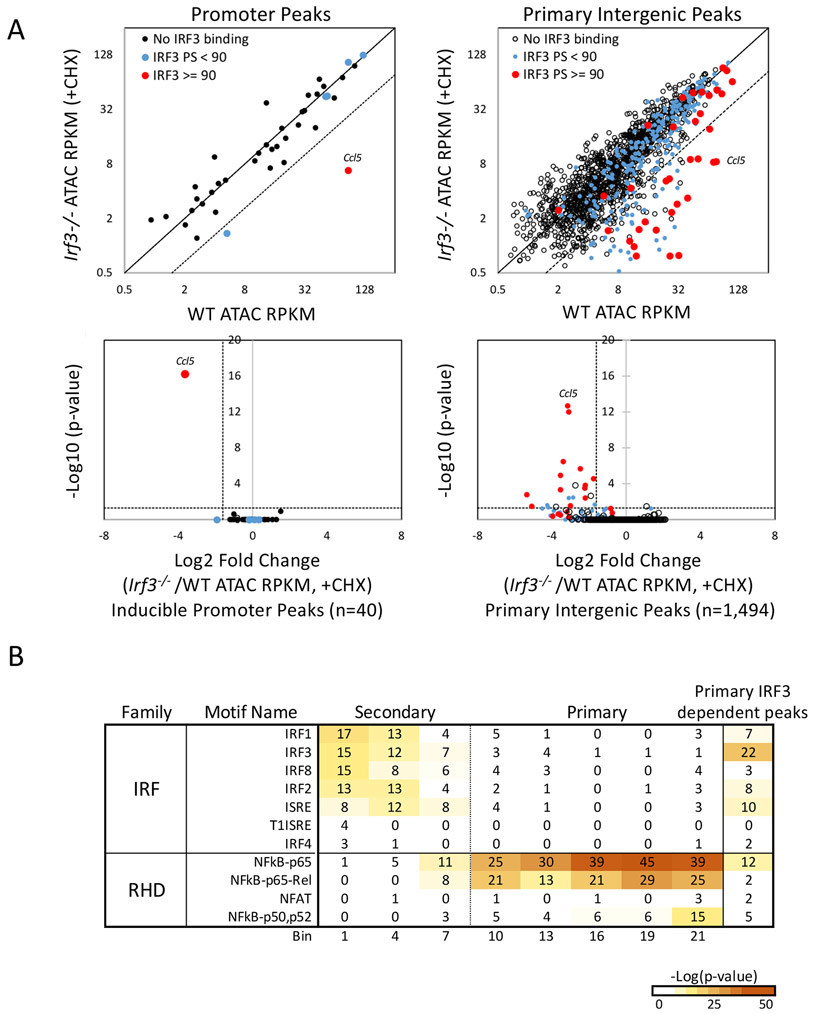
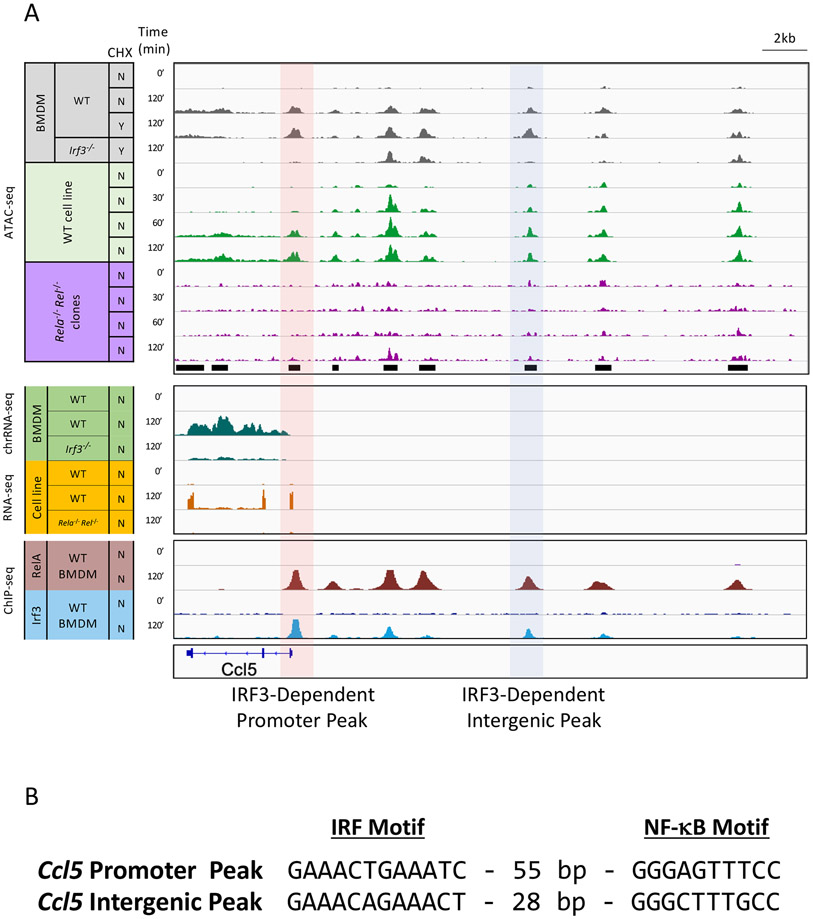
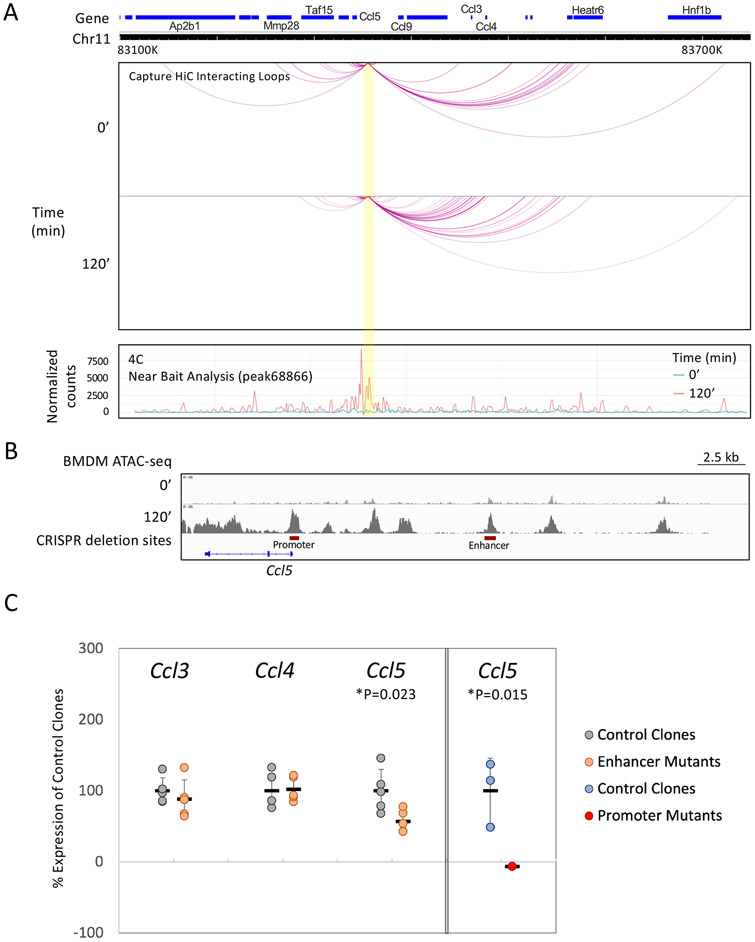
Inducible nucleosome remodeling at hundreds of latent enhancers and several promoters shapes the transcriptional response to Toll-like receptor 4 (TLR4) signaling in macrophages. We aimed to define the identities of the transcription factors that promote TLR-induced remodeling. An analysis strategy based on ATAC-seq and single-cell ATAC-seq that enriched for genomic regions most likely to undergo remodeling revealed that the transcription factor nuclear factor κB (NF-κB) bound to all high-confidence peaks marking remodeling during the primary response to the TLR4 ligand, lipid A. Deletion of NF-κB subunits RelA and c-Rel resulted in the loss of remodeling at high-confidence ATAC-seq peaks, and CRISPR-Cas9 mutagenesis of NF-κB-binding motifs impaired remodeling. Remodeling selectivity at defined regions was conferred by collaboration with other inducible factors, including IRF3- and MAP-kinase-induced factors. Thus, NF-κB is unique among TLR4-activated transcription factors in its broad contribution to inducible nucleosome remodeling, alongside its ability to activate poised enhancers and promoters assembled into open chromatin.

Keywords: IRF3; NF-κB; chromatin; macrophages; nucleosome remodeling; transcription.


Conflict of interest statement

Declaration of interests The authors declare no competing interests.

Figures

Figure 1.
Figure 1.. ATAC-seq profiling of the TLR4 response
(A) Maximum fold-induction values (y-axis) for 101,448 ATAC-seq peaks (x-axis) are shown for BMDMs stimulated with lipid A for 0, 30, 60 and 120 min. The peaks represent a merger of all peaks reproducibly observed in at least one time point. Two (30 and 60 min), three (0 min), or five (120 min) replicates were examined. Dotted lines denote the 0.5-, two-, and five-fold thresholds. Numbers of peaks and percentage of total peaks in each fold-ranges are indicated. (B) The genomic location distribution of all ATAC-seq peaks and peaks induced >5-fold are shown. (C) ATAC-seq tracks are shown for representative promoters with repressed, constitutive, or induced ATAC-seq signals. Tracks at the right show a gene for which the ATAC-seq signal spans the transcription unit. (D) ATAC-seq peaks were ranked by maximum fold-change across the stimulation time-course and were then separated into 40 bins (2,536 peaks/bin). The percentage of peaks at eight genomic locations (y-axis) in each bin (x-axis) are displayed. (E) ATAC-seq peaks were separated into 40 bins as in panel D. The percentage of peaks (y-axis) with a statistically called peak (blue) or lacking a peak (orange) in unstimulated cells are shown for each bin. (F) ATAC-seq tracks near a representative inducible gene (Ccl9) emphasize the distinction between strong and weak induction. (G) ATAC-seq peaks were separated into 40 bins. The percentage of peaks (y-axis) in each bin coinciding with a called Brg1 ChIP-seq peak are shown for both unstimulated and stimulated (120 min) BMDMs.
Figure 2.
Figure 2.. scATAC-seq analysis of TLR4-induced BMDMs.
(A) UMAP projections are shown after combining scATAC-seq counts from 6362 unstimulated and 8582 stimulated (2 hrs) BMDMs. Five cell clusters (0-4) were identified using the FindClusters function with the Louvain method “algorithm=3” at a resolution = 0.1 in the Signac software package in R. (B) The locations of unstimulated (blue) and stimulated (red) cells are shown with respect to the UMAP clusters in panel A. (C) Beginning with the 101,448 bulk ATAC-seq peaks separated into 40 bins (Figure 1E), the percentage of peaks in each bin that overlap with one of the 266,098 peaks identified by pseudo-bulk analysis of the scATAC-seq data are shown for unstimulated (grey) and stimulated (yellow) BMDMs. The high percentages are due to the low peak-calling stringency implemented by the Cell Ranger ATAC software pipeline (10X Genomics) for scATAC-seq. (D) A peak coinciding with the Ccl5 promoter (dashed box) provides an example of a strongly induced ATAC-seq peak from Figure 1E, bin 40. Total counts at this location in unstimulated and stimulated cells are shown. Peak locations are indicated by horizontal lines. (E) Ccl5 promoter peak counts are indicated by Feature plot analysis. (F) Normalized counts in each unstimulated and stimulated cell for the Ccl5 promoter peak are displayed by violin plot using the VlnPlot function in Signac. No counts are observed in unstimulated cells. Counts are observed in 2914 (34.2%) of stimulated cells. (G) Similar to panel D, a pseudo-bulk analysis is displayed for a representative region upstream of the Tmem173 gene showing a 2.7-fold increase in counts in stimulated cells. (H) Peak counts within the Tmem173 region are indicated, showing substantial numbers of both unstimulated and stimulated cells with counts. (I) Normalized Tmem173 counts in each unstimulated and stimulated cell are displayed as in panel F. Counts are observed in 15% (952) and 22% (1867) of unstimulated and stimulated cells, respectively. The 2.7-fold induction represents the combined impact of the small increase in the percentage of cells with counts and the small increase in mean counts per cell containing counts.
Figure 3.
Figure 3.. Initial evidence of a broad role for NF-κB in TLR4-induced remodeling
(A) ATAC-seq peaks were separated into 40 bins (see Figure 1). Transcription factor motif enrichment (HOMER) was performed with each bin. Motifs are grouped by transcription factor family, with motifs for different members of each family shown in individual rows. Induction ranges are shown (top). (B) Line graphs show enrichment of motifs in each of the 40 bins (panel A) quantified as −log(p-value) (y-axis, blue) and as percentage of peaks with the motif (y-axis, orange) for representative motifs in four transcription factor families. (C) ATAC-seq was performed with lipid A-stimulated macrophages (0, 30, 60, and 120 min) in the absence and presence of CHX. Peaks induced >5-fold were separated into eight bins based on sensitivity of peak induction to CHX, with motif enrichment determined as in panel A. Bins 1 and 8 contain peaks with the greatest (secondary response) and least (primary response) CHX sensitivity, respectively. Arbitrary separations between the primary and secondary responses are shown. (D) ATAC-seq peaks were separated into 40 bins by fold-induction (blue) or statistical confidence (−log[p-value], orange). The percentage of ATAC-seq peaks in each bin overlapping a RelA ChIP-seq peak (y-axis) is shown. Numerical percentages are indicated for bin 40. (E) To further examine the prevalence of RelA binding at high-confidence, inducible ATAC-seq peaks, 3,290 primary response peaks displaying an average induction >5-fold were separated into 10 bins on the basis of their statistical significance of induction (−log[p-value]). The percentage of peaks overlapping with a RelA ChIP-seq peak (y-axis) is shown for each bin (x-axis). In bin 40, 82.7% of ATAC-seq peaks overlap with a RelA peaks. (F) Tracks are shown for a region between the Tyk2 and Cdc37 genes containing a strongly induced ATAC-seq peak and a RelA ChIP-seq peak. ATAC-seq tracks are shown from a wild-type macrophage line (tracks 1-5), a clonal line in which substitution mutations were introduced into two NF-κB motifs underlying the ATAC-seq peak (tracks 6-10), and a mixture of lines in which the Rela and Rel genes were simultaneously inactivated by CRISPR deletion (tracks 11-15). RelA ChIP-seq tracks from wild-type BMDMs are shown (tracks 16-20). Tracks are shown for five time points (noted at left). Black horizontal lines denote locations of constitutive (left) and inducible (right) ATAC-seq peaks.
Figure 4.
Figure 4.. Broad impacts on ATAC-seq and mRNA induction in Rela−/− Rel−/− cells
(A) ATAC-seq was performed with a wild-type macrophage line and two clonal Rela−/− Rel−/− lines. 1001 primary response ATAC-seq peaks induced >5-fold in the wild-type line were separated into ten bins based on statistical significance (−log[p-value]) of maximum induction at the time point at which maximum induction was achieved in two independent experiments. Scatter plots are shown for the four bins with the strongest statistical significance ranges. The scatter plots show ATAC-seq RPKM from wild-type (x-axis) and Rela−/− Rel−/− (y-axis) cells at the time point that yields the maximum difference (p-value). The solid diagonal line represents equal RPKM and the dashed line, average RPKM in the mutant lines that is 33% of the wild-type RPKM. Peaks that are >33% of wild-type in the mutant lines are colored in red. Numbered peaks (1-5) are shown in panel B. (B) Browser tracks are shown for a representative constitutive ATAC-seq peak and for five inducible peaks (numbered in panel A) across the time-course from wild-type and Rela−/− Rel−/− mutant cells (tracks contained merged data from two wild-type experiments or two mutant lines). Peak 1 is from an Nfkb1 intron. Peak 2 is downstream of the constitutive Tgds gene. Peak 3 is adjacent to the inducible Ptgs2 gene. Peak 4 appears to result from readthrough transcription downstream of the inducible Plk2 gene. Peak 5 is from an intron for the inducible Dcbld2 gene. Scale ranges are consistent among tracks for each peak, but differ from peak to peak. (C) Scatter plots show Log2 RPKM from mRNA-seq experiments performed with the wild-type transformed line and two Rela−/− Rel−/− mutant lines. The plots show all genes induced 2-5-fold (left) or >5-fold (right) 120-min after stimulation (maximum RPKM >3). Values are averages of two experiments with wild-type cells or with two mutant lines. The solid diagonal line represents equal RPKM in wild-type and mutant and the dashed line represents 33% RPKM in the mutant samples in comparison to wild-type. Grey dots represent genes whose transcript levels are <33% of wild-type. (D) Tracks are shown for a strongly induced gene that exhibits reduced mRNA levels in two independent Rela−/− Rel−/− lines (Nfkbiz), along with tracks for two primary response genes (Dusp5 and Ccl7) that remain strongly induced in the Rela−/− Rel−/− lines. (E) Scatter plots are shown for the four peak bins examined in panel A. The scatter plots compare average RPKM for each peak in a wild-type macrophage line (x-axis; average of two replicates at 0- and-2 hr time points) and Nfkb1−/− Nfkb2−/− macrophage lines (y-axis; average of three replicates from two mutant lines at 0- and 2-hr time points.). RNA-seq revealed similarly modest impacts on lipid A-induced mRNA levels in the mutant cells (Daly et al., unpublished results).
Figure 5.
Figure 5.. IRF3-dependence of ATAC-seq peaks
(A) ATAC-seq was performed with wild-type and Irf3−/− BMDMs left unstimulated or stimulated for 120 min in the presence of CHX to prevent secondary response proteins from masking IRF3 requirements during the primary response. Induced ATAC-seq signals (RPKM) from wild-type and mutant cells were compared by scatter plot (top) and volcano plot (bottom) for the 40 promoters (left) and 1,494 intergenic (right) ATAC-seq peaks induced >5-fold. Peaks overlapping with a strong (peak score >90) IRF3 ChIP-seq peak (red) are distinguished from peaks with weak (peak score <90) IRF3 peaks (blue) and from peaks lacking IRF3 peaks (black). (B) IRF and Rel-homology domain (RHD, NF-κB and NFAT) family member motif enrichment is shown for primary and secondary response ATAC-seq bins (see Figure 3C) and for IRF3-dependent primary response peaks (right). Because only 107 IRF3-dependent ATAC-seq peaks were identified, wild-type BMDM ATAC-seq peaks were divided into bins with 107 or 108 peaks each, to allow an accurate comparison between the wild-type and Irf3−/− datasets. Only a subset of the wild-type bins is shown.
Figure 6.
Figure 6.. NF-κB/IRF3 co-dependence of IRF3-dependent ATAC-seq peaks
(A) Tracks are shown for the Ccl5 promoter and its upstream region. ATAC-seq tracks are shown for unstimulated and stimulated wild-type BMDMs (tracks 1 and 2); wild-type and Irf3−/− BMDM stimulated in the presence of CHX (tracks 3 and 4); and wild-type and Rela−/− Rel−/− macrophages lines (tracks 5-12). Chromatin-associated RNA-seq tracks are shown for wild-type BMDMs stimulated in the absence and presence of CHX (tracks 13-14) and for Irf3−/− BMDM stimulated in the presence of CHX (track 15). mRNA-seq tracks are shown for wild-type and Rela−/− Rel−/− macrophage lines (tracks 16-18). RelA and IRF3 ChIP-seq tracks are shown from wild-type BMDMs (tracks 19-22). Stimulation time points and the presence or absence of CHX are to the left. (B) IRF3 and NF-κB motifs and their spacing near the ATAC-seq summits at the Ccl5 promoter and IRF3-dependent intergenic peak are shown.
Figure 7.
Figure 7.. Analysis of an Ccl5 intergenic NF-κB/IRF3 co-dependent region
(A) 4C and capture Hi-C results are shown for the region surrounding the Ccl5 intergenic IRF3-dependent ATAC-seq peak. This peak was used as a target bait for the experiments. The black line and gray areas above the tracks represent the 4C trend line reflecting the breadth and strength of genomic interactions. The arcs represent the most significant capture Hi-C long-range interactions. Experiments were performed with unstimulated and stimulated (120 min) BMDMs. (B) The locations of deletions introduced into the Ccl5 promoter and intergenic region are shown (red bars). (C) RT-PCR was used to compare the impact of the Ccl5 promoter deletion on Ccl5 mRNA (right), and the impact of the intergenic region deletion on Ccl5, Ccl3, and Ccl4 mRNA (left). For the intergenic deletion, the results of five biological replicates are shown, with results presented as a percentage in comparison to the mean of the wild-type clone signals. P-values are shown for the Ccl5 data.

Similar articles

Cited by

References

    1. Heinz S, Romanoski CE, Benner C, and Glass CK (2015). The selection and function of cell type-specific enhancers. Nat. Rev. Mol. Cell. Biol 16, 144–154. - PMC - PubMed
    1. Glass CK, and Natoli G (2016). Molecular control of activation and priming in macrophages. Nat. Immunol 17, 26–33. - PMC - PubMed
    1. Monticelli S, and Natoli G (2017). Transcriptional determination and functional specificity of myeloid cells: making sense of diversity. Nat. Rev. Immunol 17, 595–607. - PubMed
    1. Natoli G, and Ostuni R (2019). Adaptation and memory in immune responses. Nat. Immunol 20, 783–792. - PubMed
    1. Sheu K,M, and Hoffmann A (2022). Functional hallmarks of healthy macrophage responses: their regulatory basis and disease relevance. Annu. Rev. Immunol 40, 295–321. - PMC - PubMed

Publication types

MeSH terms