. 2024 Mar 25;4(3):100716.
doi: 10.1016/j.crmeth.2024.100716. Epub 2024 Mar 1.

An autologous ex vivo model for exploring patient-specific responses to viro-immunotherapy in glioblastoma

Affiliations

An autologous ex vivo model for exploring patient-specific responses to viro-immunotherapy in glioblastoma

Eftychia Stavrakaki et al. Cell Rep Methods. .

Abstract

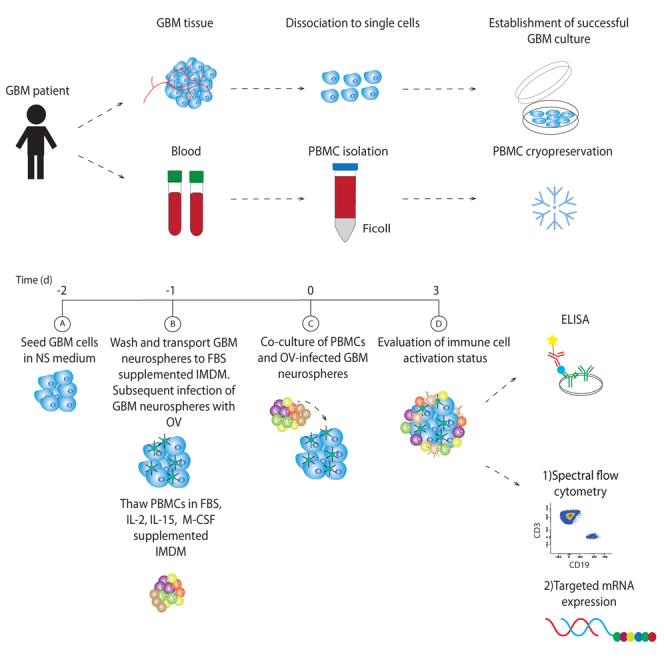
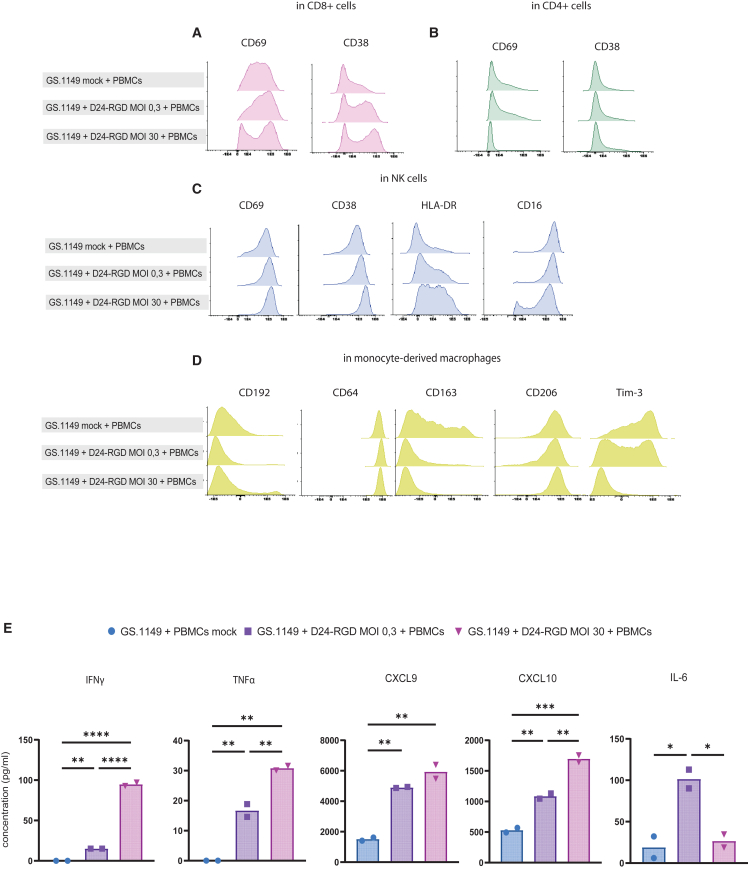
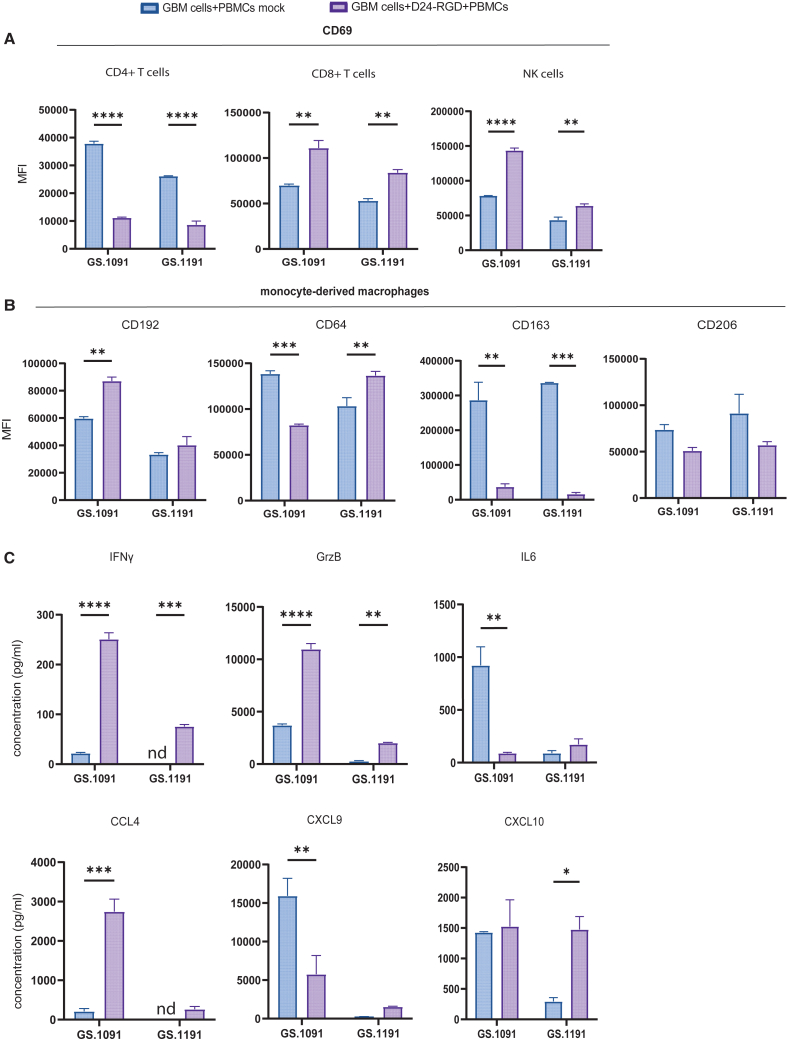
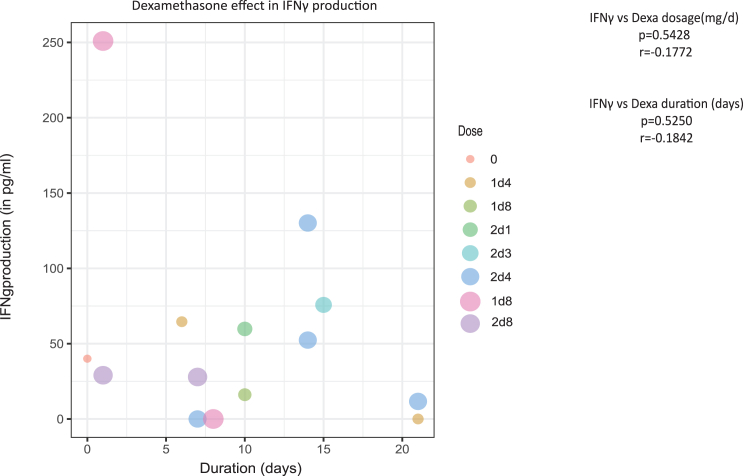
Oncolytic virus (OV) clinical trials have demonstrated remarkable efficacy in subsets of patients with glioblastoma (GBM). However, the lack of tools to predict this response hinders the advancement of a more personalized application of OV therapy. In this study, we characterize an ex vivo co-culture system designed to examine the immune response to OV infection of patient-derived GBM neurospheres in the presence of autologous peripheral blood mononuclear cells (PBMCs). Co-culture conditions were optimized to retain viability and functionality of both tumor cells and PBMCs, effectively recapitulating the well-recognized immunosuppressive effects of GBM. Following OV infection, we observed elevated secretion of pro-inflammatory cytokines and chemokines, including interferon γ, tumor necrosis factor α, CXCL9, and CXCL10, and marked changes in immune cell activation markers. Importantly, OV treatment induced unique patient-specific immune responses. In summary, our co-culture platform presents an avenue for personalized screening of viro-immunotherapies in GBM, offering promise as a potential tool for future patient stratification in OV therapy.

Keywords: CP: Cancer biology; Delta24-RGD; GBM neurospheres; PBMCs; autologous co-culture; co-culture model; glioblastoma; immune response; individualized screening; oncolytic viruses; spectral flow cytometry.


Conflict of interest statement

Declaration of interests The authors declare no competing interests.

Figures

None
Graphical abstract
Figure 1
Figure 1
Evaluation of PBMC viability and glioblastoma (GBM) neurosphere growth (A) Viability percentages of CD4 T cells, CD8 T cells, NK cells, B cells, and macrophages from 5 distinct patients with GBM. (B) A schematic illustration of the experimental setup designed to assess the GBM neurosphere growth in 3 distinct media. (C) The relative luminescence units (RLUs) of 5 primary patient-derived cell cultures on days 1, 3, and 6, following culture in NS medium, IMDM, or a combination of NS and IMDM. Statistical significance between groups was evaluated by two-way ANOVA with correction for multiple comparisons using Sidak method (∗p < 0.05, ∗∗p < 0.01, ∗∗∗p < 0.005, and ∗∗∗∗p < 0.001; mean with standard deviation).
Figure 2
Figure 2
Evaluation of GBM:PBMC co-culture ratios (A) A schematic illustration of the experimental co-culture setup. (B) Mean mRNA fold change relative to β-actin of IFNG, TNF, IL6, and IL10 after co-culturing with different GBM:PBMC ratios in mock or Delta24-RGD MOI 10-infected co-cultures. (B) Average cytokine production of IFNγ, granzyme B (GrzB), IL-6, and CCL4 after co-culturing with different GBM:PBMC ratios in mock or Delta24-RGD-infected co-cultures. Data are presented for 4 distinct patients: GS.1067 (blue), GS.1098 (red), GS.1100 (green), and GS.1108 (purple). Statistical significance between groups was evaluated by ordinary one-way ANOVA (∗p < 0.05; line at median).
Figure 3
Figure 3
Immunomodulatory effects of GBM neurospheres on PBMCs Gene expression grouped according to mRNA function and represented as pathway scores. (A) Heatmap depicting immune-related pathway scores of 6 PBMC samples to 6 matched GBM:PBMC co-cultures. (B) Bar plots comparing selected immune-related pathways of 6 PBMC samples to 6 matched GBM:PBMC co-cultures. Statistical significance between groups was assessed using two-way ANOVA with correction for multiple comparisons using the Sidak method (∗p < 0.05, ∗∗p < 0.01, ∗∗∗p < 0.005, and ∗∗∗∗p < 0.001; whiskers min to max).
Figure 4
Figure 4
Immunophenotyping and cytokine production capture OV-dose effects in the co-culture model Histograms depicting expression patterns for (A) CD69 and CD38 on CD8+ T cells in mock co-cultures and Delta24-RGD MOI 0.3- and MOI 30-infected co-cultures; (B) CD69 and CD38 on CD4+ T cells in mock co-cultures and Delta24-RGD MOI 0.3- and MOI 30-infected co-cultures; (C) CD69, CD38, HLA-DR, and CD16 on NK cells in mock co-cultures and Delta24-RGD MOI 0.3- and MOI 30-infected co-cultures; and (D) CD192, CD64, CD163, CD206, and Tim-3 on monocyte-derived macrophages in mock co-cultures and Delta24-RGD MOI 0.3- and MOI 30-infected co-cultures. (E) Bar graphs depicting mean production of IFNγ, TNF-α, CXCL9, CXCL10, and IL-6 in mock co-cultures and Delta24-RGD MOI 0.3- and MOI 30-infected co-cultures. Statistical significance between groups was evaluated by two-way ANOVA with correction for multiple comparisons using Sidak method (∗p < 0.05, ∗∗p < 0.01, ∗∗∗p < 0.005, and ∗∗∗∗p < 0.001).
Figure 5
Figure 5
Differential PBMC activation in co-cultures from two patients with GBM with similar tumor Delta24-RGD sensitivity (A) Median fluorescence intensity (MFI) of CD69 on CD8+ T cells, CD4+ T cells, and NK cells in mock or Delta24-RGD-infected co-cultures derived from GS.1091 or GS.1191. (B) MFI of CD192, CD64, CD163, and CD206 on monocyte-derived macrophages in mock or Delta24-RGD-infected co-cultures derived from GS.1091 or GS.1191. (C) Average cytokine production of IFNγ, granzyme B, IL-6, CCL4, CXCL9, and CXCL10 in mock or Delta24-RGD-infected co-cultures derived from GS.1091 or GS.1191. Statistical significance between groups was evaluated by two-way ANOVA with correction for multiple comparisons using Sidak method (∗p < 0.05, ∗∗p < 0.01, ∗∗∗p < 0.005, and ∗∗∗∗p < 0.001; mean with standard deviation).
Figure 6
Figure 6
Correlation analysis of patient dexamethasone use and IFNγ production in Delta24-RGD-infected co-cultures Dot plot showing mean IFNγ production of 14 Delta24-RGD-infected co-cultures versus dose and dexamethasone duration of corresponding patients’ dexamethasone use (Spearman’s rank correlation analysis).

Similar articles

Cited by

References

    1. De Witt Hamer P.C., Ho V.K.Y., Zwinderman A.H., Ackermans L., Ardon H., Boomstra S., Bouwknegt W., van den Brink W.A., Dirven C.M., van der Gaag N.A., et al. Between-hospital variation in mortality and survival after glioblastoma surgery in the Dutch Quality Registry for Neuro Surgery. J. Neuro Oncol. 2019;144:313–323. - PMC - PubMed
    1. Bausart M., Préat V., Malfanti A. Immunotherapy for glioblastoma: the promise of combination strategies. J. Exp. Clin. Cancer Res. 2022;41:35. - PMC - PubMed
    1. Desjardins A., Gromeier M., Herndon J.E., 2nd, Beaubier N., Bolognesi D.P., Friedman A.H., Friedman H.S., McSherry F., Muscat A.M., Nair S., et al. Recurrent Glioblastoma Treated with Recombinant Poliovirus. N. Engl. J. Med. 2018;379:150–161. - PMC - PubMed
    1. Lang F.F., Conrad C., Gomez-Manzano C., Yung W.K.A., Sawaya R., Weinberg J.S., Prabhu S.S., Rao G., Fuller G.N., Aldape K.D., et al. Phase I Study of DNX-2401 (Delta-24-RGD) Oncolytic Adenovirus: Replication and Immunotherapeutic Effects in Recurrent Malignant Glioma. J. Clin. Oncol. 2018;36:1419–1427. - PMC - PubMed
    1. Nassiri F., Patil V., Yefet L.S., Singh O., Liu J., Dang R.M.A., Yamaguchi T.N., Daras M., Cloughesy T.F., Colman H., et al. Oncolytic DNX-2401 virotherapy plus pembrolizumab in recurrent glioblastoma: a phase 1/2 trial. Nat. Med. 2023;29:1370–1378. - PMC - PubMed