

ISGylation of DRP1 closely balances other post-translational modifications to mediate mitochondrial fission
- PMID: 38431611
- PMCID: PMC10908869
- DOI: 10.1038/s41419-024-06543-7
ISGylation of DRP1 closely balances other post-translational modifications to mediate mitochondrial fission
Erratum in
-
Publisher Correction: ISGylation of DRP1 closely balances other post-translational modifications to mediate mitochondrial fission.Cell Death Dis. 2024 Jul 9;15(7):488. doi: 10.1038/s41419-024-06857-6. Cell Death Dis. 2024. PMID: 38982063 Free PMC article. No abstract available.
Abstract
Dynamin related protein 1 (DRP1), a pivotal mitochondrial fission protein, is post-translationally modified by multiple mechanisms. Here we identify a new post-translational modification of DRP1 by the ubiquitin-like protein, interferon-stimulated gene 15 (ISG15). DRP1 ISGylation is mediated by ISG15 E3 ligase, HERC5; this promotes mitochondrial fission. DeISGylation of DRP1 however leads to hyperfusion. Heterologous expression of SARS-CoV2 PLpro, a deISGylating enzyme, results in similar mitochondrial filamentation, significant decrease in total DRP1 protein levels and efflux of mtDNA. We report that deISGylated DRP1 gets ubiquitylated and degraded by TRIM25, instead of PARKIN and MITOL. While the cytosolic pool of DRP1 is primarily ISGylated, both mitochondrial and cytosolic fractions may be ubiquitylated. It is known that phosphorylation of DRP1 at S616 residue regulates its mitochondrial localisation; we show that ISGylation of phospho-DRP1 (S616) renders fission competence at mitochondria. This is significant because DRP1 ISGylation affects its functionality and mitochondrial dynamics in Alzheimer's disease pathophysiology.
© 2024. The Author(s).
Conflict of interest statement
The authors declare no competing interests.
Figures
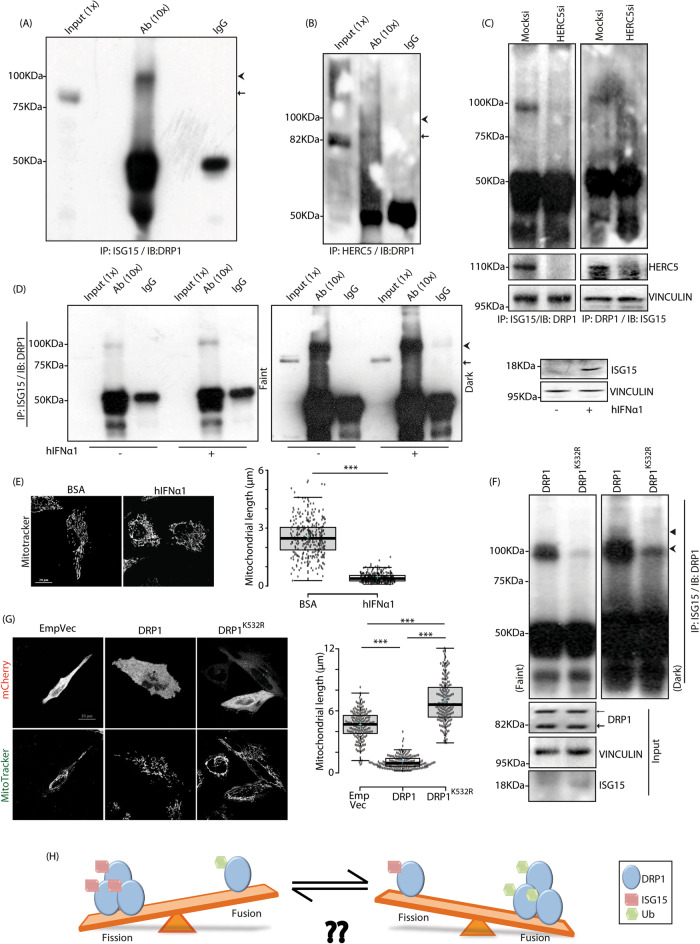
 endogenous DRP1,
  ISGylated endogenous DRP1. B Cell lysates co-immunoprecipitated to verify interaction between HERC5 with DRP1. The proportion of lysate loaded as input and used for immunoprecipitation is denoted in brackets by ‘X’.
  endogenous DRP1,
  ISGylated endogenous DRP1. C Mock or HERC5 siRNAs-treated cell lysates were immunoprecipitated (IP) with anti-ISG15 antibody (left panel). Note Western blot (IB) analysis with anti-DRP1 antibody shows decrease in ISGylated-DRP1 in HERC5-depleted samples. Reverse co-IP on the right corroborates the same. HERC5 and VINCULIN confirm knockdown and loading efficiencies. D A549 cells treated with 10 ng/ml of human IFNα1 (hIFNα1) for 48 h were lyzed and checked for ISGylation of DRP1 by co-IP between ISG15 and DRP1. Note that treatment with hIFNα1 induces enhanced ISGylation of DRP1. Similarly hIFNα1 treatment results in higher ISG15 expression, VINCULIN served as loading control. The proportion of lysates and immunoprecipitates denoted by ‘X’ in brackets.
  endogenous DRP1,
  ISGylated endogenous DRP1. E Cells treated with the hIFNα1 as described in panel D and treated with MitoTracker Red FM were imaged under live-cell conditions. Scale bar, 20μm. Box plots showing quantification of mitochondrial length for the experiment. ~150 cells from 3 independent experiments were analysed. The central line and the plus (+) symbol in each box show the median and mean value, respectively. ***p ≤ 0.001 using unpaired 2-tailed Student’s t-test. F A549 cells were transfected with indicated mCherry-tagged constructs and co-immunoprecipitated against ISG15 and DRP1. Note that K532R mutation in DRP1 compromises its ISGylation; ISGylated DRP1 band being more prominent in the dark exposure. ISG15 and VINCULIN served as loading control.
  ISGylated endogenous DRP1, ◄ ISG15-modified mCherry-tagged DRP1,
  endogenous DRP1, ← mCherry-tagged DRP1. G Cells were transfected with indicated mCherry-tagged constructs and treated with MitoTracker Green FM were imaged under live-cell conditions. Scale bar, 20μm. Box plots showing quantification of mitochondrial length for the experiment. ~200 cells from 3 independent experiments were analysed. The central line and the plus (+) symbol in each box show the median and mean value, respectively. ***p ≤ 0.001 using unpaired 2-tailed Student’s t-test. H Experimental hypothesis regarding differential effects of post-translational modifications (ISGylation and ubiquitylation) of DRP1 on mitochondrial dynamics.
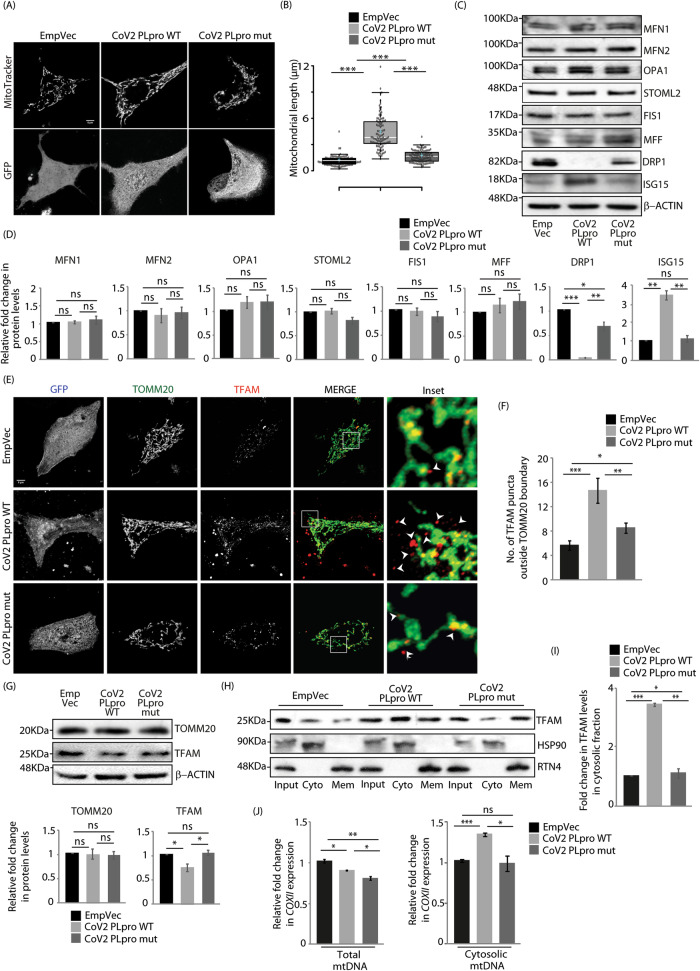


 endogenous DRP1, ← mCherry-tagged DRP1. VINCULIN was used as loading control. F Cells transfected with CoV2 PLpro WT were treated with the indicated siRNAs and immunoblotted against DRP1. Knockdown efficiency was confirmed by immunoblotting against PARKIN, TRIM25 and MITOL. VINCULIN was used as loading control. Graph shows the changes in the protein levels of DRP1. Data represents 3 independent experiments. ns, not significant (p > 0.07), ***p ≤ 0.001 using unpaired 2-tailed Student’s t-test. G Mock or TRIM25 siRNAs treated cells transfected with indicated GFP-tagged constructs were immunoblotted with anti-DRP1 antibody. Note increased DRP1 levels upon TRIM25 depletion. Input levels of TRIM25 and VINCULIN served as loading controls. Graph plots protein levels of DRP1. Data represents 3 independent experiments. ns, not significant (p > 0.08), *p ≤ 0.05, **p ≤ 0.01, ***p ≤ 0.001 using unpaired 2-tailed Student’s t-test. H A549 cell lysates were immunoprecipitated against DRP1 and immunoblotted with TRIM25 antibody. The proportion of lysate loaded as input and used for immunoprecipitation is denoted in brackets by ‘X’. I Mock or TRIM25 siRNAs treated cells were co-immunoprecipitated against ISG15 and DRP1. Note similar ISGylated DRP1 levels across samples. TRIM25 levels in the lysates confirm knockdown efficiency, VINCULIN served as loading control. DRP1 levels were also checked in cell lysates. J Cells expressing the indicated GFP-tagged constructs were depleted off TRIM25 and analysed for co-IP between DRP1 and Ub. Note significantly reduced DRP1 ubiquitylation in TRIM25 depleted cells expressing CoV2 PLpro WT. Lysates were immunoblotted against DRP1, TRIM25 and VINCULIN.
 Unmodified DRP1, ← and likely to be post-translationally modified forms of DRP1. Note reduced DRP1 levels in input (exposure 1), mitochondrial (exposure 2) and cytosolic (exposure 3) fractions in CoV2 PLpro WT samples. (B) Total RNA isolated from A549 cells transfected with the indicated GFP-tagged constructs was subjected to qRT-PCR using primers against GAPDH (control) and DRP1. Samples were present in triplicate. 2-ΔΔCt values were plotted. Graph shows results from 3 independent experiments. ns, not significant (p > 0.1) using unpaired 2-tailed Student’s t-test. Error bars, ±SEM. C Cytosolic and mitochondrial fractions obtained from semi-permeabilised cells were analysed for co-IP between DRP1 and ISG15. Note that cytosolic DRP1 pool is primarily ISGylated. VINCULIN and VDAC1 served as controls for cytosolic and mitochondrial fractions, respectively. D Cells fractionated as in panel C were probed for co-IP between DRP1and Ub. Note ubiquitylated DRP1 present in both the fractions. VDAC1 and VINCULIN levels in the total lysates served as loading controls. E Cells transfected with the indicated GFP-tagged constructs, fractionated as in panel C were divided into two. One part was immunoprecipitated with anti-ISG15 antibody and immunoblotted against DRP1. Note lower levels of ISGylated DRP1 in samples with CoV2 PLpro WT than the mutant. VINCULIN and VDAC1 served as controls. F Second part generated in panel E was analysed for co-IP between DRP1 and Ub. VDAC1 and VINCULIN levels confirm fractionation efficiency. G Cytosolic and mitochondrial fractions obtained from semi-permeabilised cells were analysed for TRIM25. VINCULIN and VDAC1 served as controls.

References
Publication types
MeSH terms
Substances
Grants and funding
LinkOut - more resources
Full Text Sources
Molecular Biology Databases
Research Materials
Miscellaneous
