. 2024 Mar 2;15(1):1947.
doi: 10.1038/s41467-024-46180-4.

A GREB1-steroid receptor feedforward mechanism governs differential GREB1 action in endometrial function and endometriosis

Affiliations

A GREB1-steroid receptor feedforward mechanism governs differential GREB1 action in endometrial function and endometriosis

Sangappa B Chadchan et al. Nat Commun. .

Abstract

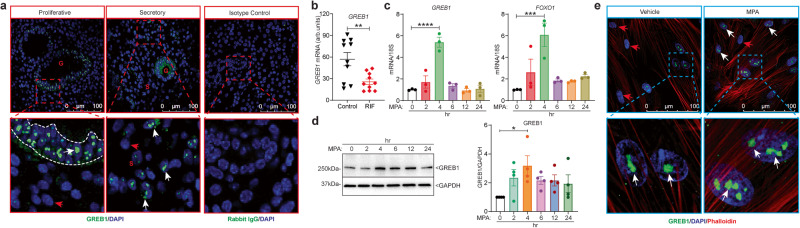
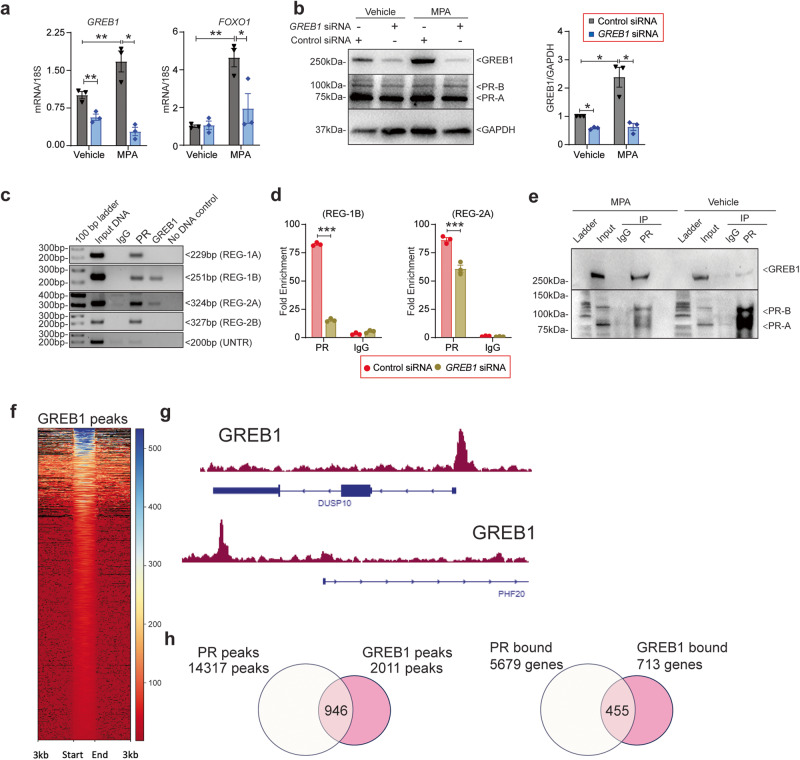
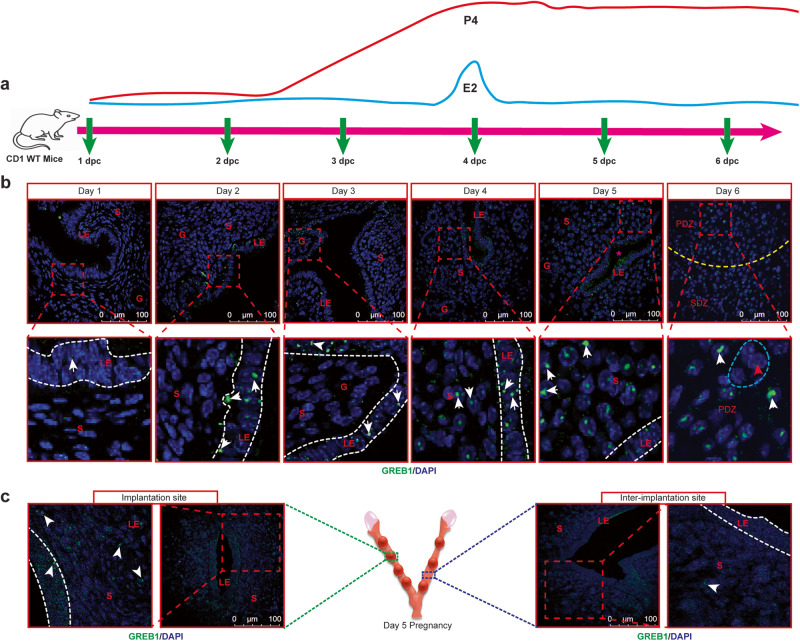
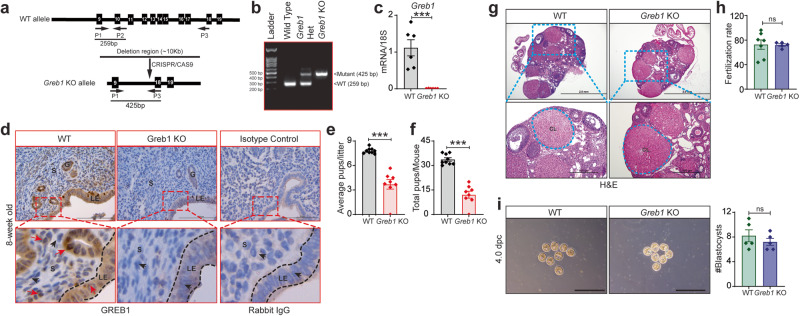
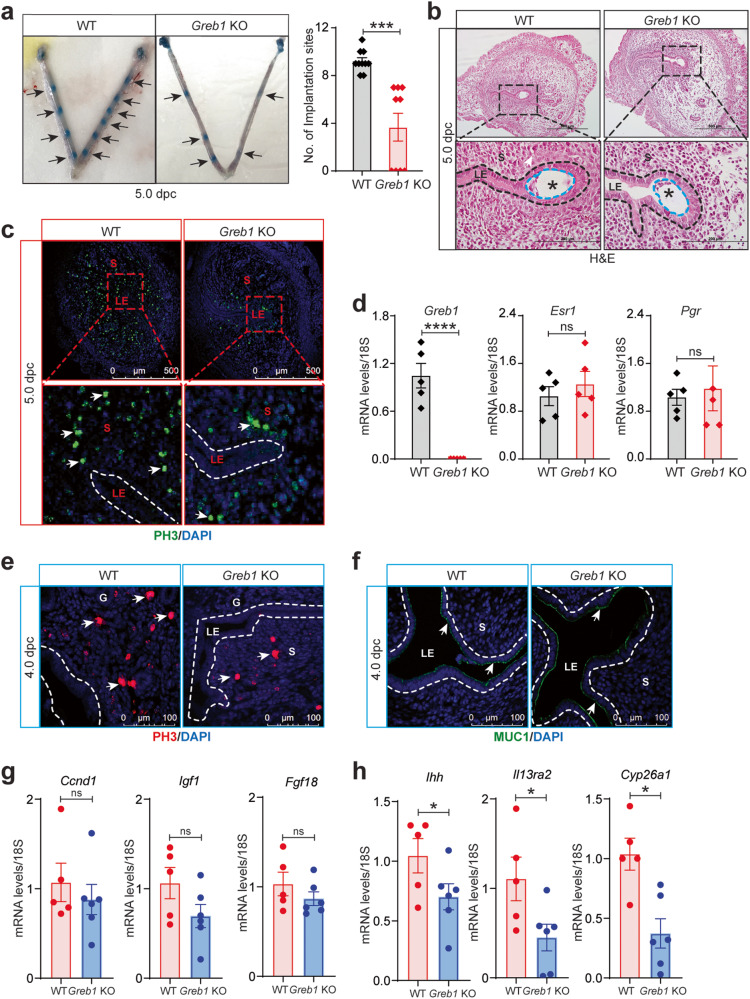
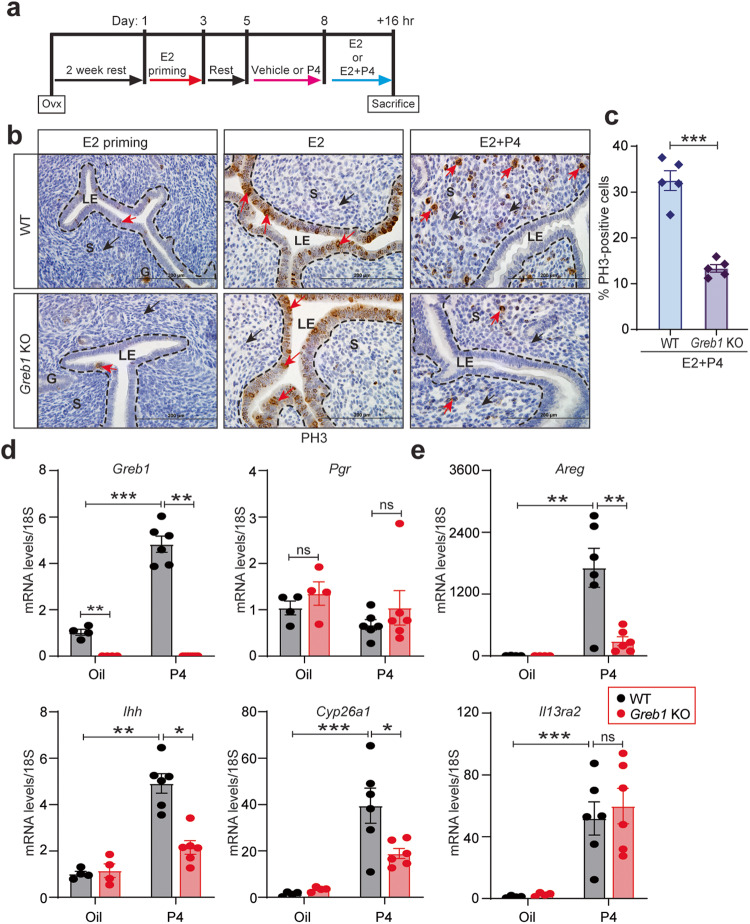
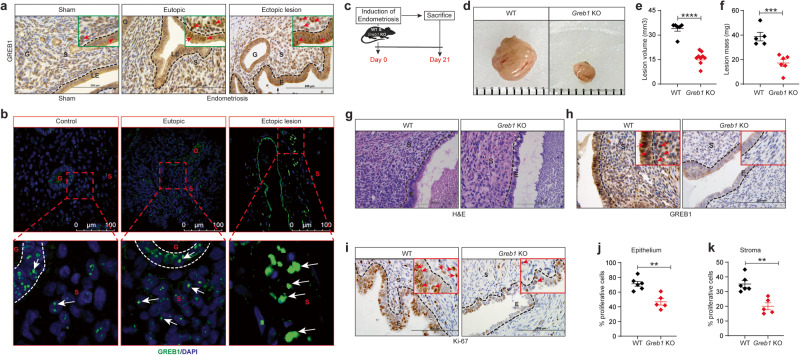
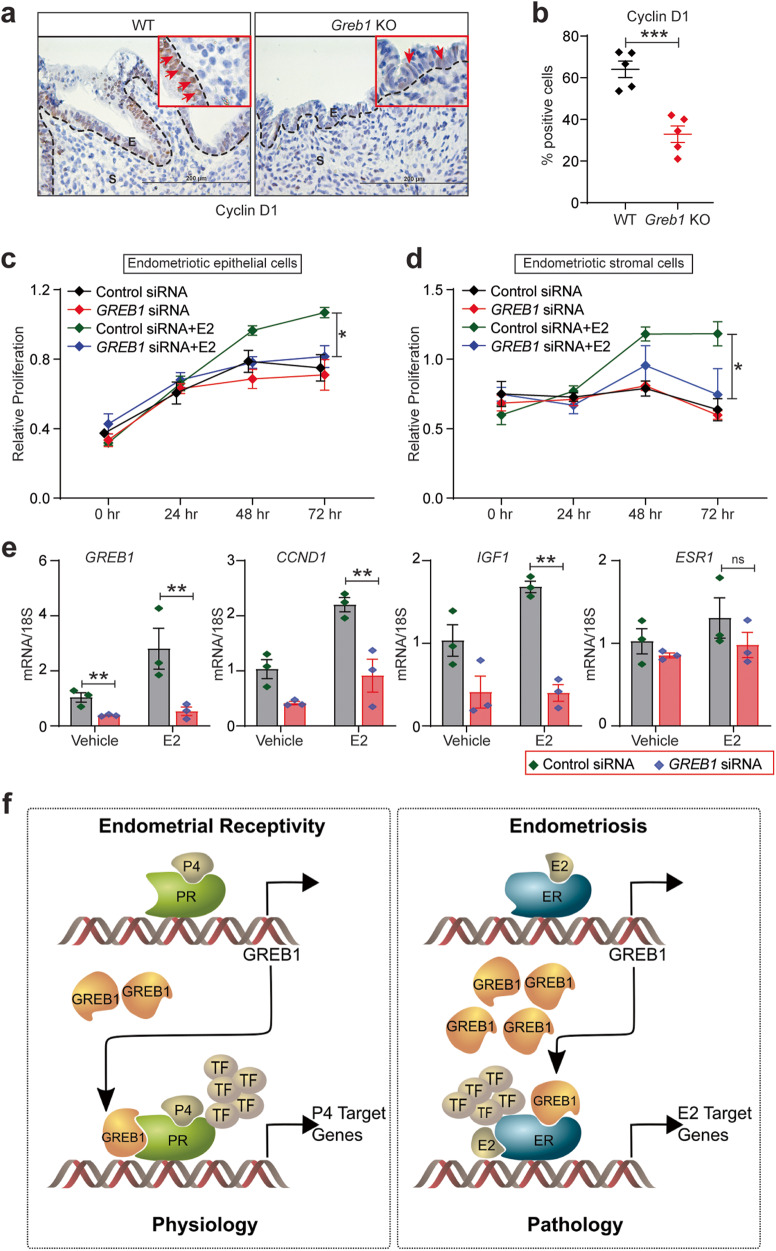
Cellular responses to the steroid hormones, estrogen (E2), and progesterone (P4) are governed by their cognate receptor's transcriptional output. However, the feed-forward mechanisms that shape cell-type-specific transcriptional fulcrums for steroid receptors are unidentified. Herein, we found that a common feed-forward mechanism between GREB1 and steroid receptors regulates the differential effect of GREB1 on steroid hormones in a physiological or pathological context. In physiological (receptive) endometrium, GREB1 controls P4-responses in uterine stroma, affecting endometrial receptivity and decidualization, while not affecting E2-mediated epithelial proliferation. Of mechanism, progesterone-induced GREB1 physically interacts with the progesterone receptor, acting as a cofactor in a positive feedback mechanism to regulate P4-responsive genes. Conversely, in endometrial pathology (endometriosis), E2-induced GREB1 modulates E2-dependent gene expression to promote the growth of endometriotic lesions in mice. This differential action of GREB1 exerted by a common feed-forward mechanism with steroid receptors advances our understanding of mechanisms that underlie cell- and tissue-specific steroid hormone actions.


Conflict of interest statement

The authors declare no competing interests.

Figures

Fig. 1
Fig. 1. GREB1 expression in the human endometrium is regulated by steroid hormones.
a Representative images of GREB1 staining in human endometrium from the proliferative (n = 9) and secretory (n = 9) phase. White arrow, GREB1-positive cells; red arrow, GREB1-negative cells. Right panel represents staining with the isotype control Rabbit IgG. b GREB1 raw transcript scores in mid-secretory phase endometrium from women with and without recurrent implantation failure (RIF) measured from a publicly available GEO data set (GSE65102); (n = 10). Paired, two-tailed, t-test. Data reported as the mean ± SEM. *P < 0.05, ***P < 0.001, ****P < 0.0001. Relative amounts of GREB1 and FOXO1 mRNA (c), and GREB1 protein (d) in human endometrial stromal cells treated with 1 µM MPA for the indicated number of hours. Analyzed by one-way ANOVA with Tukey’s multiple comparisons post-test. Data reported as the mean ± SEM. *P < 0.05, ***P < 0.001, ****P < 0.0001. e Representative GREB1 immunofluorescence in human endometrial stromal cells treated with 1 µM MPA for 4 hr. Blue, DAPI; Green, GREB1; and Red, Phalloidin, data are reported as the mean ± SEM from three biological replicates from a representative experiment (experiment repeated three times). *P < 0.05, ***P < 0.001, ****P < 0.0001.
Fig. 2
Fig. 2. GREB1 acts as a PR cofactor in human endometrial stromal cells.
a Relative GREB1 and FOXO1 mRNA abundance in human endometrial stromal cells transfected with control or GREB1 siRNA and treated with MPA or vehicle for 4 hr. Analyzed by one-way ANOVA with Tukey’s multiple comparisons post-test. Data reported as the mean ± SEM. *P < 0.05, ***P < 0.001, ****P < 0.0001. b Relative GREB1 and PR protein concentrations in human endometrial stromal cells transfected with control or GREB1 siRNA and treated with vehicle or MPA. Right side panel depicts the GREB1 protein quantification. GAPDH serves as a loading control. Analyzed by one-way ANOVA with Tukey’s multiple comparisons post-test. Data reported as the mean ± SEM. *P < 0.05, ***P < 0.001, ****P < 0.0001. c PCR products amplified with the indicated FOXO1 primers (shown in map in Supplementary Fig 1a, after immunoprecipitating DNA with anti-GREB1 or anti-PR antibody. UNTR, untranscribed region. d ChIP-qPCR validation of PR binding on the FOXO1 region in HESCs treated with control siRNA or GREB1 siRNA prior to 4 hr MPA treatment. Data are represented as fold enrichment of IgG and PR over that of the negative control region. Analyzed by one-way ANOVA with Tukey’s multiple comparisons post-test. Data reported as the mean ± SEM. *P < 0.05, ***P < 0.001, ****P < 0.0001. e Whole-cell lysates isolated from human endometrial stromal cells treated with 1 µM MPA or vehicle for 4 h, immunoprecipitated with PR antibody or control IgG, and immunoblotted with GREB1 (top panel) or PR (bottom panel) antibody. Data are presented as the mean ± SEM from three biological replicates from a representative experiment (experiment repeated three times). *P < 0.05, **P < 0.01, ***P < 0.001. f The heatmap of GREB1 binding peaks from HESCs using CUT&RUN sequencing analysis. g IGV track visualization of GREB1 peaks on DUSP10 and PHF20 gene clusters. h Venn diagrams illustrating the overlap between GREB1 and PR peaks (left) and called genes (right) from the GREB1 and PR cistromes.
Fig. 3
Fig. 3. GREB1 expression in the murine endometrium increases at the time of embryo implantation.
a Schematic representation of collection of uteri at different days of pregnancy (days post-coitum) in mice. b Representative images of GREB1 (green) localization in wild-type CD1 mouse uteri at the indicated days of pregnancy. Asterisk indicates the location of a blastocyst. G gland, LE luminal epithelium, S stroma, PDZ Primary decidual zone, SDZ Secondary Decidual zone; Scale bar:100 µm. White arrows, GREB1-positive cells; Red arrows, GREB1-negative cells; Blue dashed outline, decidual polygonal cells. c Representative images of GREB1 (green) localization at an implantation site and an inter-implantation site in a uterus from a wild-type CD1 mouse at 5 days. Middle schema (created with BioRender.com) depicts the implantation site and inter-implantation sites. In each time point, at least 5 independent samples (n = 5) from different mice were examined. All uteri were collected at 9:00 a.m. to 10:00 a.m. on the indicated day of pregnancy.
Fig. 4
Fig. 4. Greb1 knockout (Greb1 KO) mice have impaired fertility.
a Schematic of Greb1 knockout strategy. b Confirmation of wild type (WT) and mutant alleles by PCR. Representative image of PCR, observed in at least five specimens from different mice c Analysis of Greb1 transcripts in uteri from WT (n = 6) and Greb1 KO mice (n = 6). Paired, two-tailed, t-test. Data reported as the mean ± SEM. *P < 0.05, ***P < 0.001, ****P < 0.0001. d Representative cross-sectional images of uteri from WT and Greb1 KO mice stained for GREB1 by immunohistochemistry. Scale bar, 200 μm; Red arrow, GREB1-positive cells; black arrow, GREB1-negative cells. G, glandular epithelia; LE, luminal epithelia; S, stroma. Representative image of at least three specimens analyzed per genotype. e, f, Graphs depicting the number of pups per litter and the total number of pups per mice from WT (n = 9) and Greb1 KO (n = 8) in six-month fertility tests. Paired, two-tailed, t-test. Data reported as the mean ± SEM. *P < 0.05, ***P < 0.001, ****P < 0.0001. g Representative (n = 5) Hematoxylin and Eosin-stained cross-section images of the ovary from 8-week-old WT and Greb1 KO mice; scale bar: 2.0 mm and 200 μm. CL corpus luteum. Representative image of at least five specimens analyzed per genotype. h In vitro fertilization rate of oocytes recovered from 4-week-old WT (n = 7) and Greb1 KO mice (n = 5). Paired, two-tailed, t-test. Data reported as the mean ± SEM. *P < 0.05, ***P < 0.001, ****P < 0.0001. i Representative images and quantification of blastocysts (graph on right) retrieved from WT (n = 5) and Greb1 KO (n = 5) mice on 4 dpc. Paired, two-tailed, t-test. Data are presented as mean ± SEM, (n = 5-9 WT and n = 5-8 Greb1 KO). ***P < 0.001 and ns, non-significant.
Fig. 5
Fig. 5. Greb1 KO mice have impaired embryo implantation and uterine receptivity.
a Embryo implantation sites at 5 dpc in WT (n = 10) and Greb1 KO (n = 11) mice. Black arrows indicate the implantation sites. Paired, two-tailed, t-test, data reported as the mean ± SEM. *P < 0.05, ***P < 0.001, ****P < 0.0001. b Representative Hematoxylin and Eosin-stained cross-section images of the uterus at 5 dpc in WT and Greb1 KO mice; scale bars, 500 μm and 200 μm. Representative image of at least three specimens analyzed per genotype. c Representative cross-sectional images of uteri of WT and Greb1 KO mice at 5 dpc stained for Phospho-Histone H3, scale bar 500 μm. White arrows indicate positive cells. Representative image of at least three specimens analyzed per genotype. d Relative mRNA expression of indicated genes at 5 dpc in WT and Greb1 KO females. Paired, two-tailed, t test, data reported as the mean ± SEM. *P < 0.05, ***P < 0.001, ****P < 0.0001 and ns, non-significant e, f, Representative cross-sectional images of WT and Greb1 KO mice at 4 dpc uteri stained for Phospho-Histone H3 (e), and MUC1 (f) Representative image of at least three specimens analyzed per genotype. g Relative mRNA levels of estrogen target genes Ccnd1, Igf1 and Fgf18, and h progesterone target genes Ihh, Il13ra2 and Cyp26a1, in the uteri of Greb1 KO and WT mice at dpc 4 (n = 5 for each genotype). Asterisks denote the blastocysts. LE, luminal epithelia; S, stroma. Scale bar, 100 μm. Paired, two-tailed, t-test, data are presented as mean ± SEM (n = 5–6 mice per group). ***P < 0.001, ****P < 0.0001, and ns, non-significant.
Fig. 6
Fig. 6. GREB1 is required for P4-responses but not E2-responses in receptive endometrium.
a Experimental protocol for hormonal induction of uterine receptivity in ovariectomized mice. b Representative images of uteri from WT and Greb1 KO mice from indicated groups, stained for phospho-Histone H3. G, glandular epithelia; LE luminal epithelia, S stroma. c The graph displays the percentage of phospho-Histone H3 positive endometrial stromal cells in WT and Greb1 KO mice from the E2 + P4 group. Red arrow, PH3-positive cells; black arrow, PH3-negative cells; n = 5 mice per group. Paired, two-tailed, t-test. Data are presented as mean ± SEM. *P < 0.05, **P < 0.01, ***P < 0.001 and ns, non-significant Relative mRNA expression of Greb1 and Pgr (d) and indicated PR target genes (e), in uteri from WT and Greb1 KO mice in the indicated treatment groups, n = 5 mice per group. Analyzed by one-way ANOVA with Tukey’s multiple comparisons post-test. Data are presented as mean ± SEM. *P < 0.05, **P < 0.01, ***P < 0.001, and ns, non-significant.
Fig. 7
Fig. 7. GREB1 is required for endometriotic lesion growth in mice.
a-b, Representative images of GREB1 localization in mouse eutopic endometrium and ectopic lesion, (n = 5) (a) and human eutopic endometrium and ectopic lesion (n = 10 control, n = 10 eutopic and n = 10 ectopic lesion) (b). Red/White arrows, GREB1-positive cells. c Experimental timeline and procedure. Ectopic endometriotic lesion representative images (d), volumes WT (n = 6) and Greb1 KO (n = 9) (e), and masses WT (n = 5) and Greb1 KO (n = 6), f from mice 21 days after surgical induction of endometriosis. Paired, two-tailed, t-test. Data are presented as the mean ± SEM. *P < 0.05, **P < 0.01, ***P < 0.001 and ns non-significant. Representative images of ectopic lesions from WT and Greb1 KO mice stained with Hematoxylin and Eosin (g), anti-GREB1 antibody (h), and anti-Ki-67 antibody (i); red arrows, indicates respective positive cells (n = 5). Graphs display percentage of Ki-67-positive cells in endometriotic lesion epithelium (j), and stroma (k) from WT (n = 6) and Greb1 KO mice (n = 5). E epithelium, G gland, LE luminal epithelium, S stroma. Paired, two-tailed, t-test. Data are presented as the mean ± SEM. *P < 0.05, **P < 0.01, ***P < 0.001 and ns non-significant.
Fig. 8
Fig. 8. GREB1 is required for estrogen-dependent action in endometriosis.
a Representative images of ectopic lesions from wild type and Greb1 KO (n = 5) mice stained with anti-Cyclin D1. Red arrow, Cyclin D1-positive cells. E epithelium, S stroma. b Graph displays percentage of Cyclin D1-positive cells in endometriotic lesion epithelium. Paired, two-tailed, t-test. Data are presented as mean ± SEM. *P < 0.05, **P < 0.01, ***P < 0.001 and ns, non-significant. c-d Representative MTT proliferation assays of Immortalized Human Endometriotic Epithelial Cells. c, and primary stromal cells isolated from human endometriotic lesions (HEnSCs) d from the indicated groups and time points. Data are presented as the mean ± SEM from triplicate samples from one experiment (three experiments were conducted in total). *P < 0.05, **P < 0.01, ***P < 0.001 and ns, non-significant. e Relative abundance of GREB1, CCND1, IGF1, and ESR1 transcripts in Human Endometriotic Epithelial Cells transfected with control or GREB1 siRNA and treated with estrogen or vehicle for 6 h. Data are presented as the mean ± SEM from triplicate samples from one experiment (three experiments were conducted in total). Analyzed by one-way ANOVA with Tukey’s multiple comparisons post-test, *P < 0.05, **P < 0.01, ***P < 0.001 and ns non-significant. f Schematic illustration (created with in association with InPrint at Washington University in St. Louis) of the hypothesis that GREB1 participates in both endometrial physiology and pathology.

References

    1. Tsai MJ, O’Malley BW. Molecular mechanisms of action of steroid/thyroid receptor superfamily members. Annu. Rev. Biochem. 1994;63:451–486. doi: 10.1146/annurev.bi.63.070194.002315. - DOI - PubMed
    1. Lonard DM, Lanz RB, O’Malley BW. Nuclear receptor coregulators and human disease. Endocr. Rev. 2007;28:575–587. doi: 10.1210/er.2007-0012. - DOI - PubMed
    1. Lonard DM, O’Malley BW. Nuclear receptor coregulators: judges, juries, and executioners of cellular regulation. Mol. Cell. 2007;27:691–700. doi: 10.1016/j.molcel.2007.08.012. - DOI - PubMed
    1. Lonard DM, O’Malley BW. Nuclear receptor coregulators: modulators of pathology and therapeutic targets. Nat. Rev. Endocrinol. 2012;8:598–604. doi: 10.1038/nrendo.2012.100. - DOI - PMC - PubMed
    1. Moggs JG, Orphanides G. Estrogen receptors: orchestrators of pleiotropic cellular responses. EMBO Rep. 2001;2:775–781. doi: 10.1093/embo-reports/kve185. - DOI - PMC - PubMed