. 2024 Mar 2;15(1):1932.
doi: 10.1038/s41467-024-46240-9.

Widespread stable noncanonical peptides identified by integrated analyses of ribosome profiling and ORF features

Affiliations

Widespread stable noncanonical peptides identified by integrated analyses of ribosome profiling and ORF features

Haiwang Yang et al. Nat Commun. .

Abstract

Studies have revealed dozens of functional peptides in putative 'noncoding' regions and raised the question of how many proteins are encoded by noncanonical open reading frames (ORFs). Here, we comprehensively annotate genome-wide translated ORFs across five eukaryotes (human, mouse, zebrafish, worm, and yeast) by analyzing ribosome profiling data. We develop a logistic regression model named PepScore based on ORF features (expected length, encoded domain, and conservation) to calculate the probability that the encoded peptide is stable in humans. Systematic ectopic expression validates PepScore and shows that stable complex-associating microproteins can be encoded in 5'/3' untranslated regions and overlapping coding regions of mRNAs besides annotated noncoding RNAs. Stable noncanonical proteins follow conventional rules and localize to different subcellular compartments. Inhibition of proteasomal/lysosomal degradation pathways can stabilize some peptides especially those with moderate PepScores, but cannot rescue the expression of short ones with low PepScores suggesting they are directly degraded by cellular proteases. The majority of human noncanonical peptides with high PepScores show longer lengths but low conservation across species/mammals, and hundreds contain trait-associated genetic variants. Our study presents a statistical framework to identify stable noncanonical peptides in the genome and provides a valuable resource for functional characterization of noncanonical translation during development and disease.


Conflict of interest statement

The authors declare no competing interests.

Figures

Fig. 1
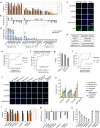
Fig. 1. Genome-wide translated ORFs identified in five eukaryotic species by analyzing ribosome profiling datasets.
a Steps of ribosome profiling data analyses. b The five eukaryotic species included in the analyses and their phylogenetic relationship. c The ribosomal A-site adjusted reads used to identify genome-wide translated ORFs in humans. df The read distribution features used to distinguish translated ORFs vs. other candidate ORFs: the fraction of in-frame reads (d), the relative fraction of codons supporting in-frame translation (e), and PME measuring uniformity of read distribution (f). The boxes are bounded by the 25 and 75 percentiles and the center represents the median. The whiskers extend from each edge of the box to indicate the 1.5x interquartile range. We randomly sampled 1000 ORFs in each group for comparison. The two-sided Wilcoxon Rank Sum Test P-values comparing the translated ORFs vs. other candidate ORFs are shown. g The statistics of translated ORFs identified across species, grouped by transcript type and ORF location. h The fraction of protein-coding genes with noncanonical translation.
Fig. 2
Fig. 2. A logistic regression model, PepScore, predicts the stable probability of noncanonical peptides.
a Overview of data analysis steps. b Distribution of PhyloCSF scores of stable (N = 343) vs. undetectable (N = 100) microproteins. The two-sided Wilcoxon Rank Sum Test P-value is shown. c Cumulative lengths of stable vs. undetectable microproteins. The stable ones were divided into three groups based on their PhyloCSF scores and were compared with the undetectable peptides: < −5 (N = 73, P = 2 × 10−10); ≥ −5 and ≤0 (N = 37, P = 3 × 10−12); >0 (N = 233, P = 6 × 10−24). The P-values were calculated using the two-sided Wilcoxon Rank Sum Test. d The expected ORF lengths at different FDRs based on randomized transcript and genome sequences. We grouped transcripts based on different length ranges for the calculation. e The FDRs of observed ORF lengths in stable vs. undetectable microproteins. As in (c), the stable ones were divided into three groups based on their PhyloCSF scores and were compared with the undetectable peptides: < −5 (N = 73, P = 3 × 10−11); ≥ −5 and ≤0 (N = 37, P = 7 × 10−13); >0 (N = 233, P = 1 × 10−25). The P-values were calculated using the two-sided Wilcoxon Rank Sum Test. f The logistic regression model PepScore classifies stable vs. undetectable microproteins. The coefficients and P-values of the training parameters are shown. g The PepScore distribution of indicated peptide groups. The boxes are bounded by the 25 and 75 percentiles and the center represents the median. The whiskers extend from each edge of the box to indicate the 1.5x interquartile range. N = 99 for undetectable microproteins and N = 67 for stable ones from annotated lncRNAs; N = 273 for RefSeq-defined proteins <100 aa, N = 4318 for proteins between 100 aa and 200 aa, and N = 27,566 for protein >200 aa. The P-values calculated using the two-sided Wilcoxon Rank Sum Test are shown. h The ROC curve showing the PepScore performance to classify stable vs. undetectable microproteins. The AUROC value is shown. i AUROC values for various models using different parameters to classify stable vs. undetectable microproteins.
Fig. 3
Fig. 3. The features of ncORFs with high PepScores.
a The PepScore distribution of human ncORFs. b Number of ncORF types with PepScore > 0.6. These high-PepScore ORFs were used in the following panels (ci). c The length distribution of ncORFs. The boxes are bounded by the 25 and 75 percentiles and the center represents the median. The whiskers extend from each edge of the box to indicate the 1.5x interquartile range. The numbers of ncORFs used in the plot are shown in (b). d The PhyloCSF score of ncORFs. The boxplot format is the same as described in (c), and the numbers of ncORFs are shown in (b). e Fraction of high-PepScore ncORFs with a protein domain. f Fraction of the ncORFs conserved in different species. g Fraction of the ncORFs conserved in mouse, grouped by ORF types. h The Tau index measuring the tissue-specific expression of the indicated ORF types. The boxplot format is the same as described in (c). The numbers of ncORFs are shown in (b), and 33,238 canonical ORFs were analyzed for the comparison. i The DeepLoc-predicted peptide localization, grouped by ORF type. j The distribution of PepScores for the peptides detected by mass spectrometry, including 326 peptides detected in the whole proteome and 1480 bound by MHC I. The P-value calculated using the two-sided Wilcoxon Rank Sum Test is shown. k The distribution of phenotype scores after CRISPR knockout of the ORFs in iPSCs. The ORFs were grouped by PepScore: 60 ncORFs with high PepScores (>0.6) and 854 ncORFs with low PepScores (≤0.6). The P-value calculated using the two-sided Wilcoxon Rank Sum Test is shown.
Fig. 4
Fig. 4. The stability and degradation pathways of ncORF peptides with different PepScores.
a PepScores and peptide lengths of 29 selected uORFs. b The PhyloCSF scores of 29 selected uORFs. c, d The ectopic expression of uORFs in HEK293T cells. Cells with ORF-Flag expression were stained with anti-Flag (green) and DAPI (blue). Empty vector and GFP-Flag were used as the negative and positive controls, respectively. Representative images of cells expressing selected uORFs are shown in (c). Scale bar, 50 μm. The y-axis represents the normalized fraction of cells expressing ORF-Flag. Data are shown as mean values ± SD of five (nontreatment) or four (MG132 treatment) replicates and are representative of three independent experiments. e Comparing peptide expression of uORFs with high vs. low PepScores in untreated cells. The P-value calculated using the two-sided Wilcoxon Rank Sum Test is shown. f The ROC curve measuring the performance using PepScore to classify uORFs with expression >5% vs. others. The AUROC value is shown. g The AUROC values obtained when using PepScore, peptide length, and PhyloCSF to classify highly vs. lowly expressed uORF peptides. h Compounds used in this study and their targeted pathways. i Comparing peptide expression of uORFs with high vs. low PepScores in MG132-treated cells. The P-value calculated using the two-sided Wilcoxon Rank Sum Test is shown. jk The uORF peptide expression levels were analyzed using untreated cells or those treated with proteasome inhibitors or/and lysosome inhibitors. Representative immunostaining images of selected uORF peptides in each condition are shown in (j). Scale bar, 50 μm. The expression levels are shown in (k). Error bars represent the standard deviation of four replicates. l PepScores and peptide lengths of five selected ouORFs, one iORF, and two dORFs. m The PhyloCSF scores of selected ncORFs. n The ectopic expression levels of the noncanonical peptides. The calculation method is the same as in (d). k, n Data are shown as mean values ± SD of four replicates and are representative of three independent experiments. The peptide expression level can be found in Supplementary Data 9.
Fig. 5
Fig. 5. uSCL35A4 is a mitochondrial outer membrane protein and regulates cell proliferation and mitochondrial membrane potential.
a, b uSLC35A4 protein interacts with mitochondrial outer membrane proteins. Immunoblotting analysis of uSLC35A4 co-IP lysates (a). Co-immunostaining analysis of uSLC35A4 protein using uSLC35A4_Flag stably expressing MCF-7 cells (b). VDAC1/3 and TOMM20 are mitochondrial outer membrane (OM) markers, AIF is the inner membrane space (IMS) marker, and OXCT1 is the matrix marker. Pseudocolored confocal images are shown on the left. Scale bar, 10 μm. The intensity profiles of Flag (red) and indicated mitochondrial marker (green) along the white arrows in the merged images are shown on the right. c Overexpression of wild-type but not start codon-mutated uSLC35A4 impairs MCF-7 Cell growth. Data are shown as mean values ± SD of four replicates. (***P < 0.001, P = 0.0009; ns, not significant, P = 0.2452; two-tailed t-test). d Heatmap showing differentially expressed genes in uSLC35A4_Flag stably expressing MCF-7 cells. The cells expressing start codon-mutated (AAA instead of AUG) ORF sequences were used as the control. Blue: down-regulated; Red: up-regulated. OE, overexpression. e Gene ontology analyses of differentially expressed genes in (d). f, g The mitochondrial membrane potential of MCF-7 cells measured by TMRE (tetramethylrhodamine, ethyl ester) staining. CCCP (a mitochondrial oxidative phosphorylation uncoupler) was used as system control. Representative confocal images are shown in (f). Scale bar, 25 μm. The statistic results are shown as mean values ± SD of five replicates in (g). Compared with control, wide-type uSLC35A4 overexpression (OE_WT) decreased MMP (***P < 0.001, P = 0.0003), which was rescued by uSLC35A4 knock out (KO) (**P < 0.01, P = 0.0023). Cell growth was unaffected by overexpressing mutated uSLC35A4 (OE_AAA) or a combination with KO (ns not significant, two-tailed t-test). Experiments (ac, and fg) were performed three times with similar results. Source data are provided as a Source Data file.
Fig. 6
Fig. 6. iPGRMC1 is a mitochondrial matrix protein and is cleaved by mitochondrial processing peptidases.
a Volcano plot showing proteins enriched in iPGRMC1 co-IP lysates vs. control whole cell lysates (two-sided T-test, n = 3 independent experiments). We highlighted the bait and top interacting proteins, including MPP subunits PMPCA and PMPCB (blue), and 14-3-3 proteins (red). b, c Knocking out PMPCA or PMPCB rescues the detection (a) and the mitochondrial localization (b) of iPGRMC1. The coimmunostaining of TOMM20 was used to examine the mitochondrial localization. Scale bar, 10 μm. In control cells, the iPGRMC1 peptide shows cell membrane localization, indicated by the orange arrow. Experiments were performed three times with similar results. Source data are provided as a Source Data file. d Schematic overview of mitochondrial processing of iPGRMC1 by MPP. The upper panel shows the predicted MPP cleavage site by the R-2 motif. The lower model shows that iPGRMC1 peptides are transported into mitochondria through the translocase of the outer membrane (TOM) and the translocase of the inner membrane (TIM) complexes. After processing by MPP in the matrix, C-terminal iPGRMC1 peptides translocate to the cell membrane. The image was created with BioRender.com. e Heatmap showing differentially expressed genes in iPGRMC1 stably expressing MCF-7 cells. The cells expressing start codon-mutated ORF sequences were used as the control. Blue: down-regulated; Red: up-regulated. f Gene ontology analyses of differentially expressed genes in (e).
Fig. 7
Fig. 7. Noncanonical peptides follow the conventional rules and localize to different subcellular compartments.
a The immunostaining experiments showing uINPP5F, uBPGM, and ouMRS2 (green) are localized to the ER. Calnexin (red) was used as the ER marker protein. The DAPI staining (blue) was used to label the cell nucleus. Scale bar, 10 μm. b Western blot analysis of uINPP5F, uBPGM, and ouMRS2 co-IP lysates. We examined the expression of ER proteins calnexin and BIP, mitochondrial protein MT-ND1, and cytosolic protein RPS24. Only ER proteins interact with the uORF peptides. c Western blot showing the expression of uINPP5F, uBPGM, and main ORFs in their native transcript. Flag-tagged uORF and HA-tagged main ORF were ectopically expressed in HEK293T cells. EV, empty vector control. d We performed western blot analysis of the exosome fraction and whole cell lysate to examine the expression of uINPP5F, uBPGM, and ouMRS2. CD63 protein was used as the exosome marker. The nonsecreted protein calnexin was used as the whole-cell lysate maker. We detected uORF peptide expression in both exosome and whole cell lysates, indicating these peptides are secreted extracellularly. e Flag-tagged ORFs were ectopically expressed in HEK293T cells and co-immunostained for Flag (green), cytosolic marker RPL24 (red), and DAPI (blue). Scale bar, 10 μm. f Western blot showing the expression of ouPHF19 and PHF19 (main ORF) in the native transcript. Flag-tagged ouORF and HA-tagged main ORF were ectopically expressed in HEK293T cells. The flag tag induced an insertion of 8 in-frame amino acids into the main ORF without disturbing the protein sequences. g Western blot showing the expression of CENPO (main ORF) and dCENPO in the native transcript. dORF was tagged with a Flag and the main ORF was tagged with an HA. Experiments (ag) were performed three times with similar results. Source data are provided as a Source Data file.
Fig. 8
Fig. 8. Analyses of ClinVar and GWAS variants in ncORFs.
a Schematic illustrating the workflow for analyzing ‘noncoding’ variants annotated by ClinVar and GWAS catalog in ncORFs. b The number of ClinVar variants located in different ncORF types, grouped based on the start codon and PepScore. We used the software SnpEff to annotate different functional impacts of the variant on the ncORFs. c As in (b), the GWAS variants were analyzed. d For the ncORFs with AUG start codon and high PepScore (>0.6), we plotted the number containing ClinVar and GWAS variants grouped based on ORF type. e The example gene NLRP3 encodes a high-PepScore uORF containing ClinVar variants. The variants are colored based on mutation types shown in (b).

Similar articles

Cited by

References

    1. Horowitz NH. The one gene-one enzyme hypothesis. Genetics. 1948;33:612. - PubMed
    1. Beadle GW, Tatum EL. Genetic control of biochemical reactions in neurospora. Proc. Natl Acad. Sci. USA. 1941;27:499–506. doi: 10.1073/pnas.27.11.499. - DOI - PMC - PubMed
    1. Rinn JL, Chang HY. Genome regulation by long noncoding RNAs. Annu. Rev. Biochem. 2012;81:145–166. doi: 10.1146/annurev-biochem-051410-092902. - DOI - PMC - PubMed
    1. Cabili MN, et al. Integrative annotation of human large intergenic noncoding RNAs reveals global properties and specific subclasses. Genes Dev. 2011;25:1915–1927. doi: 10.1101/gad.17446611. - DOI - PMC - PubMed
    1. Uszczynska-Ratajczak B, Lagarde J, Frankish A, Guigo R, Johnson R. Towards a complete map of the human long non-coding RNA transcriptome. Nat. Rev. Genet. 2018;19:535–548. doi: 10.1038/s41576-018-0017-y. - DOI - PMC - PubMed