. 2024 Apr:82:101908.
doi: 10.1016/j.molmet.2024.101908. Epub 2024 Mar 1.

VCD-induced menopause mouse model reveals reprogramming of hepatic metabolism

Affiliations

VCD-induced menopause mouse model reveals reprogramming of hepatic metabolism

Roshan Kumari et al. Mol Metab. 2024 Apr.

Abstract

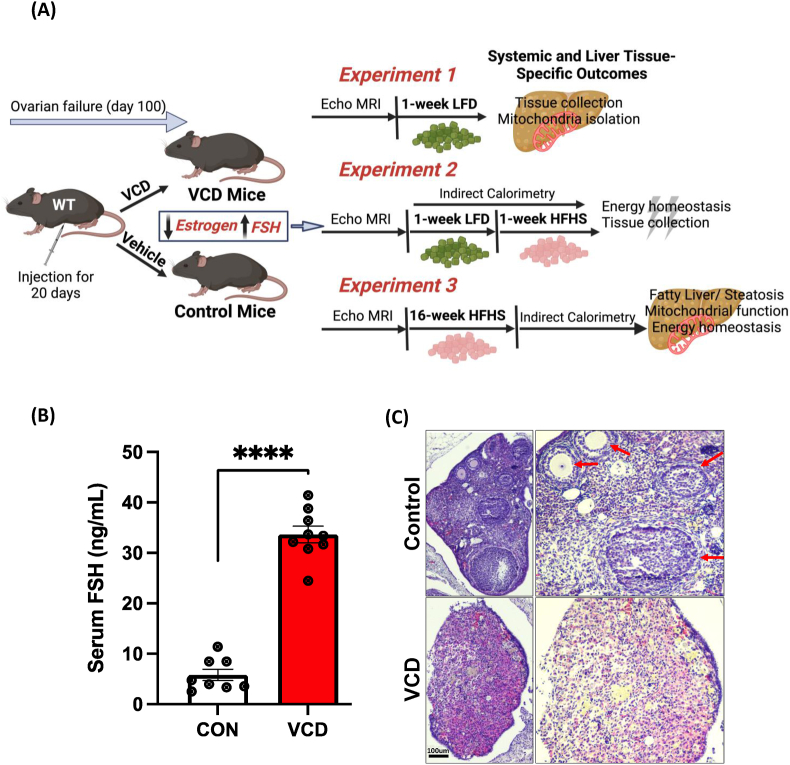
Objective: Menopause adversely impacts systemic energy metabolism and increases the risk of metabolic disease(s) including hepatic steatosis, but the mechanisms are largely unknown. Dosing female mice with vinyl cyclohexene dioxide (VCD) selectively causes follicular atresia in ovaries, leading to a murine menopause-like phenotype.

Methods: In this study, we treated female C57BL6/J mice with VCD (160 mg/kg i.p. for 20 consecutive days followed by verification of the lack of estrous cycling) to investigate changes in body composition, energy expenditure (EE), hepatic mitochondrial function, and hepatic steatosis across different dietary conditions.

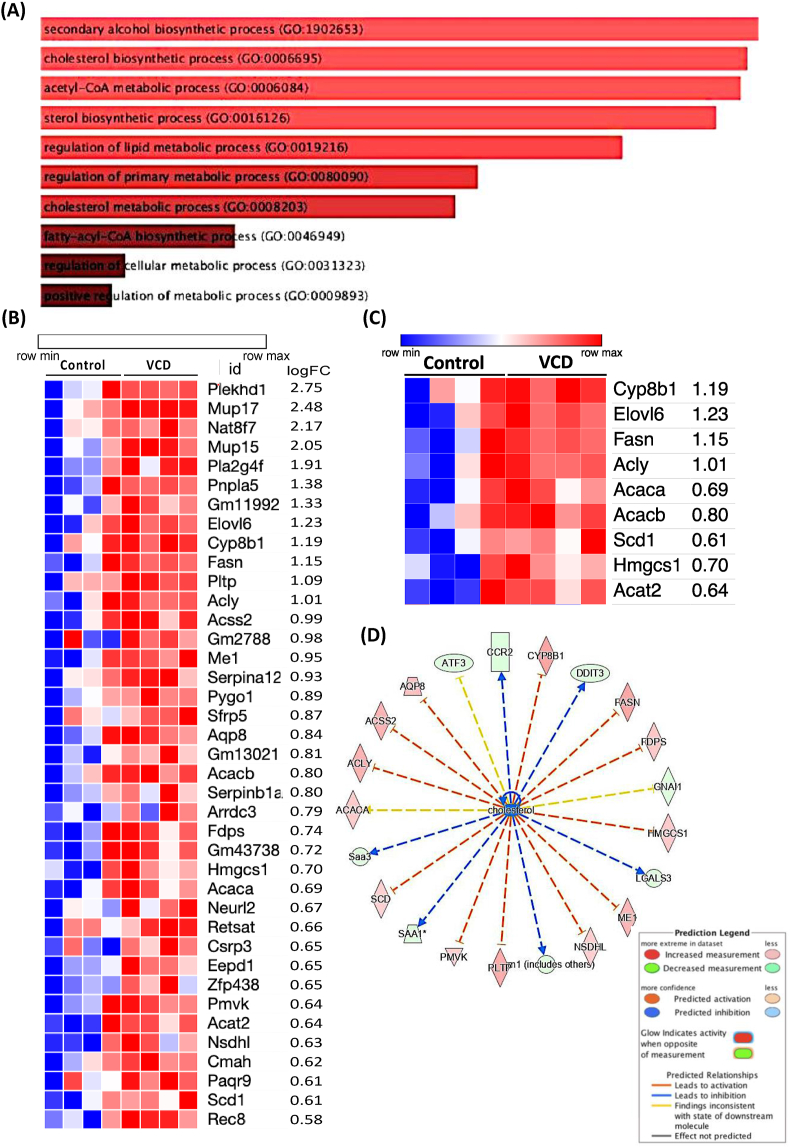
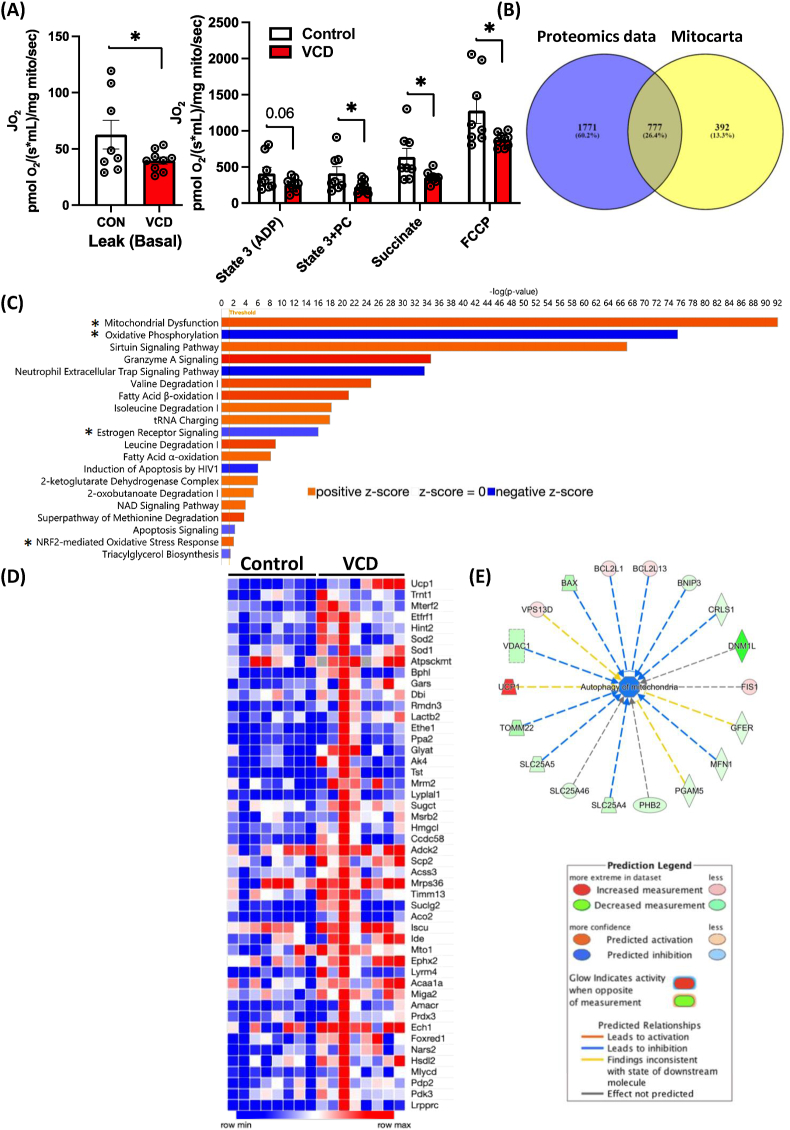
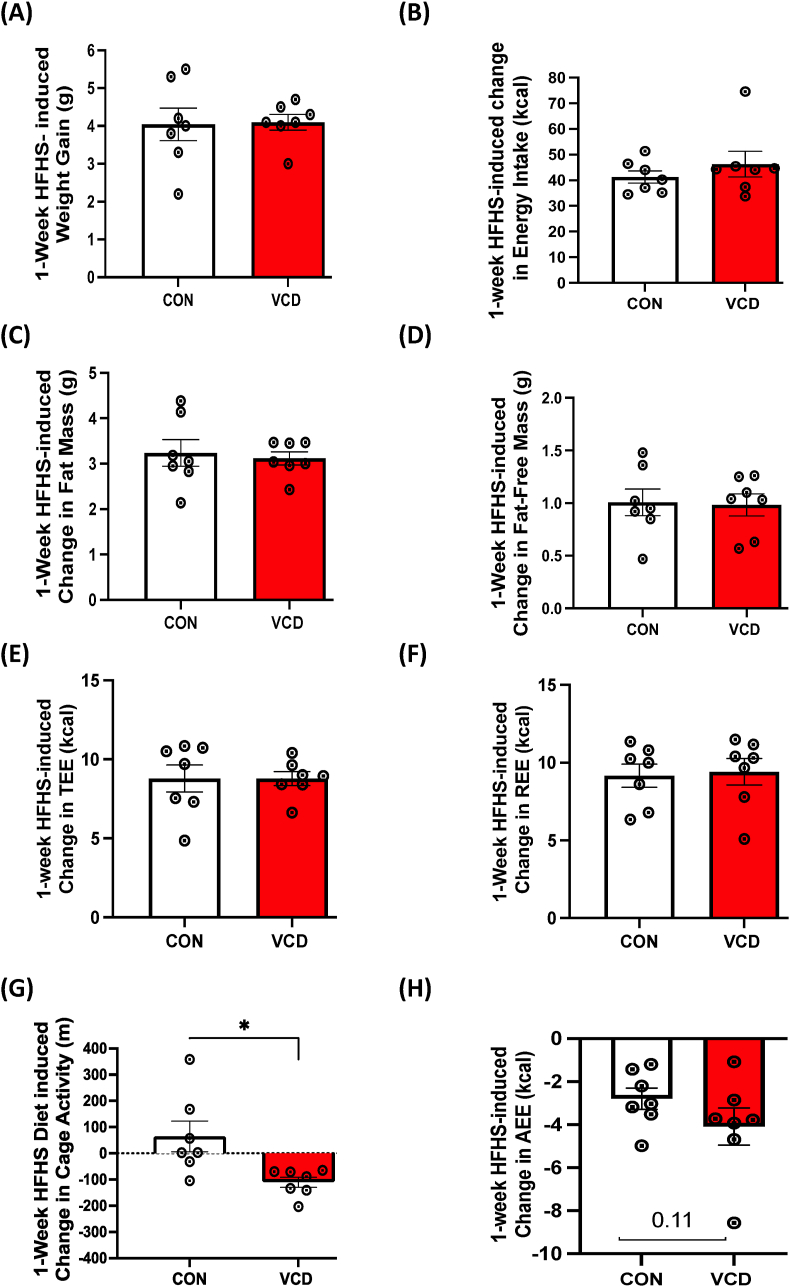
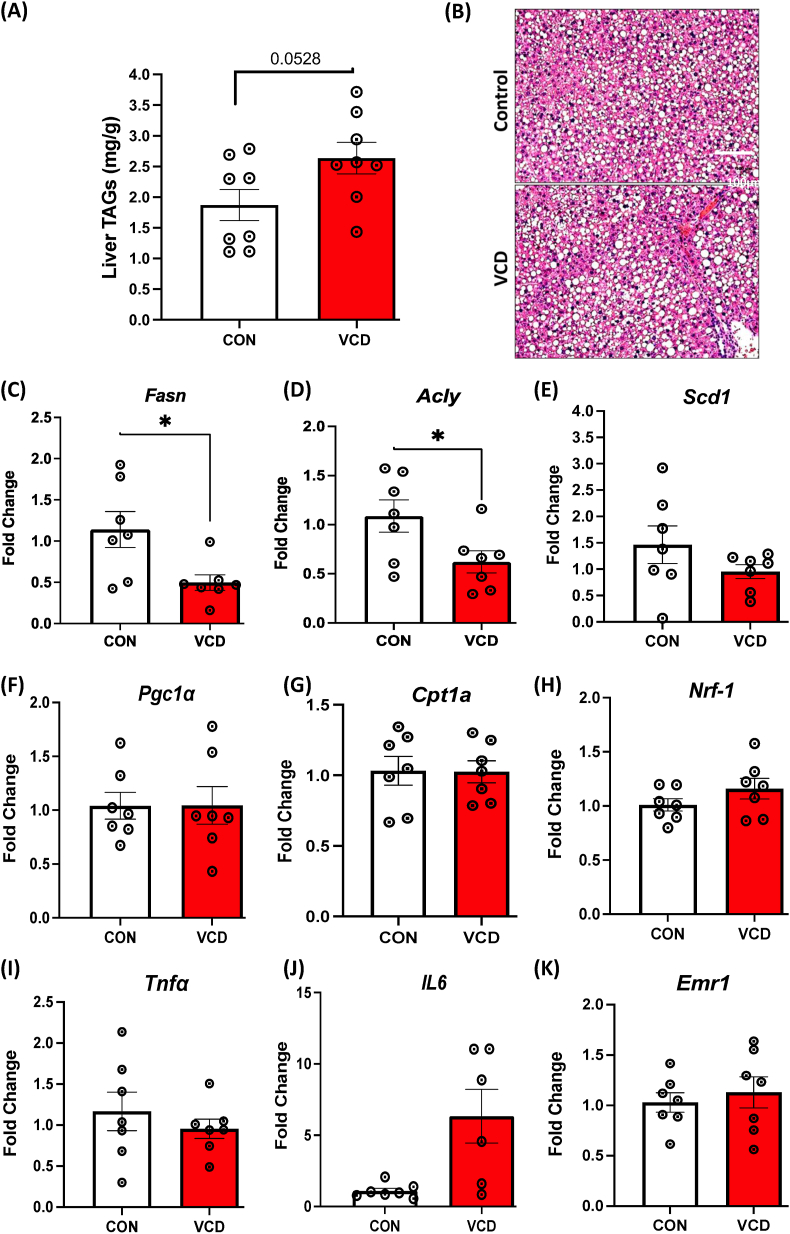
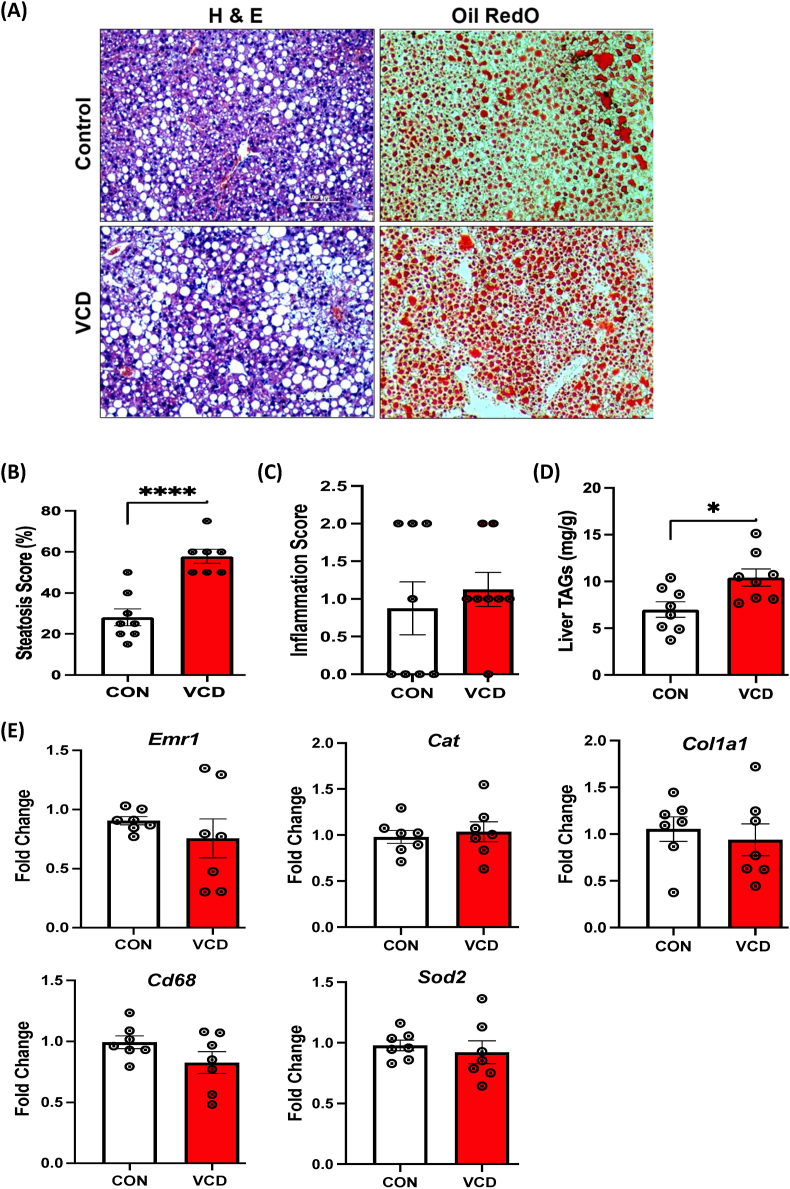
Results: VCD treatment induced ovarian follicular loss and increased follicle-stimulating hormone (FSH) levels in female mice, mimicking a menopause-like phenotype. VCD treatment did not affect body composition, or EE in mice on a low-fat diet (LFD) or in response to a short-term (1-week) high-fat, high sucrose diet (HFHS). However, the transition to a HFHS lowered cage activity in VCD mice. A chronic HFHS diet (16 weeks) significantly increased weight gain, fat mass, and hepatic steatosis in VCD-treated mice compared to HFHS-fed controls. In the liver, VCD mice showed suppressed hepatic mitochondrial respiration on LFD, while chronic HFHS resulted in compensatory increases in hepatic mitochondrial respiration. Also, liver RNA sequencing revealed that VCD promoted global upregulation of hepatic lipid/cholesterol synthesis pathways.

Conclusion: Our findings suggest that the VCD-induced menopause model compromises hepatic mitochondrial function and lipid/cholesterol homeostasis that sets the stage for HFHS diet-induced steatosis while also increasing susceptibility to obesity.

Keywords: Energy homeostasis; Estrogen; Liver metabolism; Menopause; Obesity; Sex hormones; Steatosis.


Conflict of interest statement

Declaration of competing interest None of the authors have any conflicts of interest to disclose.

Figures

Figure 1
Figure 1
Working model and menopausal-like/reproductive senescence confirmation. (A) Experimental design for experiments 1, 2 and 3 (B) VCD administration increased follicle stimulating hormone (FSH) levels in VCD treated mice compared to the control group, and (C) H&E staining of ovarian tissue sections revealed no developing ovarian follicles in VCD treated mice (lower panel) compared to control ovarian sections (upper panel) which showed clear ovarian follicles and a corpus luteum (red arrows) (scale bar: 100 μm). Data are presented as mean ± SEM (n = 8–10/group), ∗p ≤ 0.05.
Figure 2
Figure 2
Experiment 1: VCD treatment upregulated lipid and cholesterol synthesis pathway. RNA Seq in VCD and control livers showing (A) Pathway (GO Ontology) upregulated in VCD, (B) Heatmap showing genes upregulated in VCD, (C) Heatmap showing lipid and cholesterol specific genes upregulated in VCD on LFD, and (D) Network analysis and associated DEGs (n = 4/group), ∗p ≤ 0.05.
Figure 3
Figure 3
Experiment 1: VCD treatment alters mitochondrial respiratory capacity and proteomics pathways, primarily oxidative phosphorylation and the estrogen receptor signaling pathway. (A) Mitochondrial respiratory capacity was measured using palmitoyl-CoA (PC) as a main substrate at basal, ADP-dependent, Palmitoyl-CoA dependent, succinate-dependent, and FCCP uncoupled state from isolated liver mitochondria (n = 8–9/group). Proteomics analysis in VCD hepatic mitochondria showing (B) Venn diagram showing Non-MitoCarta proteins in the VCD-treated group (1771), along with those proteins shared between (777) between MitoCarta and VCD, (C) Pathways affected by VCD treatment, (D) A heatmap showing upregulated proteins crossed referenced with Mitocarta with statistically significant p-values, and (E) Network analysis and regulators for autophagy of mitochondria. Respiration data was normalized to the mitochondrial protein via the BCA method. Data are presented as mean ± SEM, ∗p ≤ 0.05.
Figure 4
Figure 4
Experiment 2: Acute HFHS feeding reduced cage activity and activity EE in VCD mice. No differences in 1-week HFHS diet-induced change were observed in (A) weight gain, (B) energy intake), (C) fat mass, (D) fat-free mass, (E) total EE, or (F) resting EE. 1-week HFHS diet induced reductions in cage (G) cage activity and (H) activity EE in VCD mice compared to control. Values are shown as mean ± standard error of the mean (n = 7/group).
Figure 5
Figure 5
Experiment 2: VCD-treated mice exhibit increased fat utilization during LFD and acute HFHS feeding. VCD treated mice show (A) reduced respiratory quotient (RQ) on LFD, (B) reduced RQ during 1-week of HFHS feeding and tended to have reduced (C) HFHS-induced changes in RQ. (D) Daily RQ changes during HFHS exposure from LFD (baseline). Data are presented as mean ± SEM (n = 7/group), ∗p ≤ 0.05.
Figure 6
Figure 6
Experiment 2: Increased steatosis and reduced expression of key genes involved in lipogenesis in VCD livers during 1-week HFHS. (A) liver triglyceride content on acute HFHS diet, (B) Representative H & E staining of liver sections (scale bar: 100 μm). mRNA levels showing (C–E) Lower expression of Fasn, Acly, and Scd1 in VCD treated liver samples compared to control mice on HFHS diet, (F–H) No change observed in mitochondrial markers, and (I–K) Inflammatory marker. Data are presented as mean ± SEM (n = 7/group except for Figure 6J which is n = 6–7), t-tests were used to evaluate statistical significance, ∗p < 0.05.
Figure 7
Figure 7
Experiment 3: Assessment of liver health and measures of key genes involved in liver health (Inflammation, oxidative stress) during 16-week HFHS in mice. (A) Representative H & E staining of liver sections (left panel) and Oil Red O staining (right panel) showing more lipid droplets in the liver of VCD mice relative to control mice on 16-week of HFHS (scale bar: 100 μm), (B) Histological steatosis scoring (in percentage), (C) Inflammation score (0-none, 1-few, and 2-many), (D) VCD treated mice show increased liver triglyceride content (n = 7–8/group), and (E) No major difference in expression of Emr1, Cat, and Col1a1, Cd68, and Sod2 in VCD treated liver samples compared to control mice on 16 weeks HFHS diet. Data are presented as mean ± SEM (n = 7/group), ∗p ≤ 0.05.
Figure 8
Figure 8
Experiment 3: Measures of hepatic mitochondrial respiratory capacity and H2O2production of palmitate. (A) Using palmitate (palmitoyl-CoA & palmitoyl-carnitine) as a main substrate at basal, state 3 (ADP-dependent), Glutamine-dependent, succinate-dependent, cytochrome C-dependent, and FCCP uncoupled respiration. (B) The coupling control ratio was calculated by diving ADP-dependent respiration to the basal respiration. (C) ADP-dependent (State 3 – basal). Using the creatine kinase clamp, VCD mice have increased palmitate supported respiration at physiologically relevant ATP free energies (D) and (E) sensitivity of isolated mitochondria to changes in ATP free energy (conductance). (F) H2O2 emission during basal respiration of palmitate, (G) change due to peroxiredoxin antioxidant system inhibition, (H) change due to glutathione antioxidant system inhibition, and (I) maximal antioxidant capacity is presented. Respiration data from O2K were normalized using mitochondrial protein content by the BCA method. Data are presented as mean ± SEM (n = 8/group), ∗p ≤ 0.05.
Figure 9
Figure 9
Working model showing the effects of VCD on liver phenotype. Menopause induction by VCD increases de novo lipogenesis on a LFD and suppresses respiration. Subsequently, after switching to a HFHS, severe steatosis occurs.

Update of

References

    1. Kim M.Y., Im S.W., Park H.M. The demographic changes of menopausal and geripausal women in Korea. J Bone Metab. 2015;22(1):23–28. - PMC - PubMed
    1. Ko S.H., Kim H.S. Menopause-associated lipid metabolic disorders and foods beneficial for postmenopausal women. Nutrients. 2020;12(1) - PMC - PubMed
    1. Broekmans F.J., Soules M.R., Fauser B.C. Ovarian aging: mechanisms and clinical consequences. Endocr Rev. 2009;30(5):465–493. - PubMed
    1. Marchi R., Dell'Agnolo C.M., Lopes T.C.R., Gravena A.A.F., Demitto M.O., Brischiliari S.C.R., et al. Prevalence of metabolic syndrome in pre- and postmenopausal women. Arch Endocrinol Metab. 2017;61(2):160–166. - PMC - PubMed
    1. Freeman E.W., Sammel M.D., Lin H., Gracia C.R. Obesity and reproductive hormone levels in the transition to menopause. Menopause. 2010;17(4):718–726. - PMC - PubMed