. 2024 Mar:104:106816.
doi: 10.1016/j.ultsonch.2024.106816. Epub 2024 Feb 23.

Bubble oscillations at low frequency ultrasound for biological applications

Affiliations

Bubble oscillations at low frequency ultrasound for biological applications

Joydip Mondal et al. Ultrason Sonochem. 2024 Mar.

Abstract

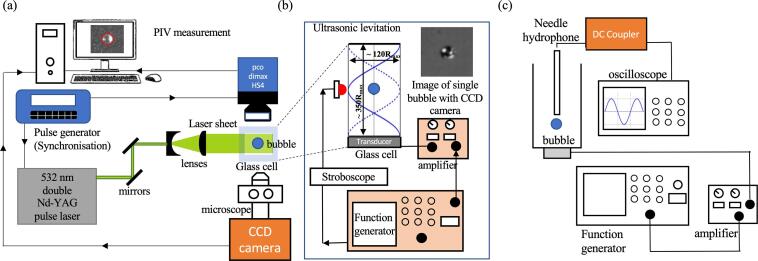
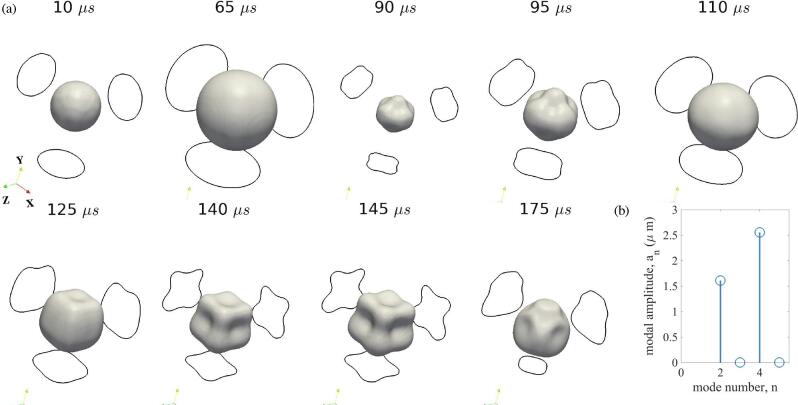
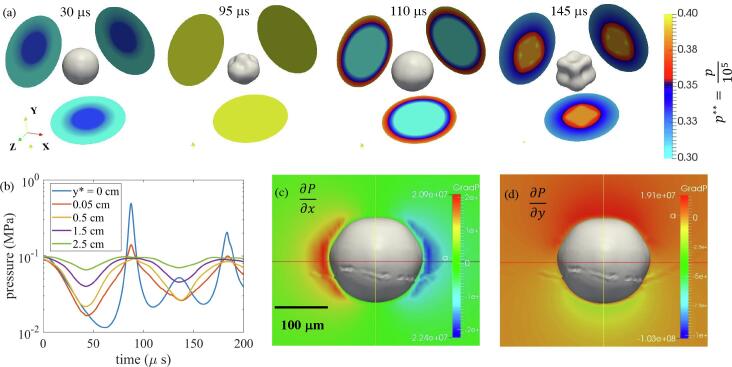
Bubbles oscillating in the presence of ultrasound is commonly employed in biomedical applications for drug delivery, ultrasound enhanced thrombolysis, and the transport and manipulation of cells. This is possible because bubbles tend to interact with the ultrasound to undergo periodic shape changes known as shape-mode oscillation, concomitant with the generation of liquid agitation or streaming. This phenomenon is examined both experimentally and theoretically on a single bubble at a frequency of (45 ± 1) kHz. Effects of ultrasonic frequency and power on the flowfield were explored. Experiments revealed different trends in the development of liquid streaming velocities at different acoustic forcing conditions (5.53, 6.80 and 7.02 Vpp), with lowest (0.5 mm/s) and highest (1.1 mm/s) values of time-averaged mean streaming velocity occurring at 6.80 Vpp and 7.02 Vpp, respectively. Simulations captured the simultaneous evolution of bubble-shapes that helped create flow vortices in the liquid surrounding the bubble. These vortices collectively responsible in generating signature patterns in the liquid for a dominant shape-mode of the bubble, and could also generate localised shear stresses for practical application. The velocity and pressure profiles in the liquid around the bubble confirmed the connection of the applied and reflected soundwaves in driving this phenomenon.

Keywords: Flow vortices; Microstreaming; Shape-mode oscillation; Tissue permeabilization; Ultrasound.


Conflict of interest statement

Declaration of competing interest The authors declare that they have no known competing financial interests or personal relationships that could have appeared to influence the work reported in this paper.

Figures

Fig. 1
Fig. 1
Degassing system for preparing liquid solution.
Fig. 2
Fig. 2
Schematic of the experimental setup. (a) Equipment for particle image velocimetry (PIV) on single bubble. (b) Acoustic levitation of a single bubble using ultrasound standing wave (USW) technique. (c) Setup for hydrophone in the glass-cell.
Fig. 3
Fig. 3
(a) Outline of 3D liquid domain measuring (2.5 × 7 × 2.5) cm3. The X and Y normal planes with the fine mesh at the centre is shown. (b) The mesh used at the centroidal location where the bubble is located here, constituted by several small cells. Two snapshots are at 5X and 10X zoom respectively from the top. (c) Numerical domain showing pressure wave (indicated by non-dimensional p=p-2e51e5) propagating through the liquid from the bottom side. (d) Spherical bubble introduced in the liquid domain. Scale bar indicates 100 μm.
Fig. 4
Fig. 4
(a) The different shape-mode oscillations; (b) The different flow-patterns obtained at 130 kHz for increasing R0 values. The diameter of the blue circle in the image indicates the length scale (given by R0) below each image.
Fig. 5
Fig. 5
The observed mode number, n as a function of ambient bubble radius, R0 at a driving frequency of f=45 and 130 kHz.
Fig. 6
Fig. 6
Effect of power and frequency on the liquid flow: Strength of streaming changes with increase in modal amplitude (representing the applied power indirectly) at both 45 and 130 kHz. This is performed for mode number, n=4 for both frequencies. Scale bar indicates 100 μm for the corresponding row.
Fig. 7
Fig. 7
Streaming velocity (mean values from absolute velocity distributions) from experiments with time for different acoustic power. Here, (a) high power: 7.02 Vpp, (b) low power: 5.53 Vpp. Solid lines are fitted through the raw data, shown by marker points: R2=0.37 (high power), 0.35(low power). The equation for fitting is discussed in the supplementary section along with the associated error analysis (in excel format). (c) Streaming velocity (mean and maximum values) in the liquid for different acoustic power. Calculations are conducted over all time-steps. Bubble shape conditions are schematically shown for every input power on top of each bar. pc indicates critical threshold on and pth,n is threshold for onset of shape-mode oscillations, indicated by n. The driving pressure amplitude (Vpp) is also converted to acoustic power (atm) shown by the axis on the top. (d) Streaming velocity (2.5 and 97.5 percentile) in the liquid for different acoustic power.
Fig. 8
Fig. 8
(a) Numerical simulation of air bubble in water at low acoustic amplitude compared with experimental data (stroboscopic pulsing for bubble images). (b) Numerical simulation of air bubble in water at high acoustic amplitude compared with high speed images .
Fig. 9
Fig. 9
(a) Time history of bubble shape evolution. The bubble is shown in 3D as gray colour. The projection of this bubble shape on the 3 isometric planes are indicated; (b) Streamlines on a velocity colourmap for some specific time instants; (c) The schematic of predominant theoretical mode which our simulation largely resemble.
Fig. 10
Fig. 10
(a) Colourmap of pressure, p**=p105 presented on the three planar projections around the bubble. The three planar projections are shown as circular planes, each of radius 3Rr. (b) Pressure at different vertical locations from the bubble-centre at x=2.5 cm, z=0. Here, y=(y-3.5) cm; (c) Pressure gradient, Px on the x-y plane; (D) Pressure gradient, Py on the x-y plane, both at certain time instant.
Fig. 11
Fig. 11
Colourmap of mean velocity magnitude presented on the planar projections around the bubble. The three planar projections are shown as circular planes, each of radius 2Rr200μm. The bubble is indicated in 3D.
Fig. 12
Fig. 12
Vorticity components- ωx,ωy,ωz shown on the three planar projections, each measuring 3Rr radius around the 3D bubble at 140 μs.

References

    1. Leighton Timothy. Academic Press; 2012. The Acoustic Bubble.
    1. Mondal Joydip, Li Wu, Rezk Amgad R., Yeo Leslie Y., Lakkaraju Rajaram, Ghosh Parthasarathi, Ashokkumar Muthupandian. Acoustic cavitation at low gas pressures in pzt-based ultrasonic systems. Ultrason. Sonochem. 2021;73:105493. - PMC - PubMed
    1. Brotchie Adam, Grieser Franz, Ashokkumar Muthupandian. Effect of power and frequency on bubble-size distributions in acoustic cavitation. Phys. Rev. Lett. 2009;102(8):084302. - PubMed
    1. Elder Samuel A. Cavitation microstreaming. J. Acoust. Soc. Am. 1959;31(1):54–64.
    1. Poulichet Vincent, Huerre Axel, Garbin Valeria. Shape oscillations of particle-coated bubbles and directional particle expulsion. Soft Matter. 2017;13(1):125–133. - PMC - PubMed

LinkOut - more resources