. 2024 Mar 3;15(1):59.
doi: 10.1186/s13287-024-03671-x.

Induced pluripotent stem cell derived pericytes respond to mediators of proliferation and contractility

Affiliations

Induced pluripotent stem cell derived pericytes respond to mediators of proliferation and contractility

Natalie E King et al. Stem Cell Res Ther. .

Abstract

Background: Pericytes are multifunctional contractile cells that reside on capillaries. Pericytes are critical regulators of cerebral blood flow and blood-brain barrier function, and pericyte dysfunction may contribute to the pathophysiology of human neurological diseases including Alzheimers disease, multiple sclerosis, and stroke. Induced pluripotent stem cell (iPSC)-derived pericytes (iPericytes) are a promising tool for vascular research. However, it is unclear how iPericytes functionally compare to primary human brain vascular pericytes (HBVPs).

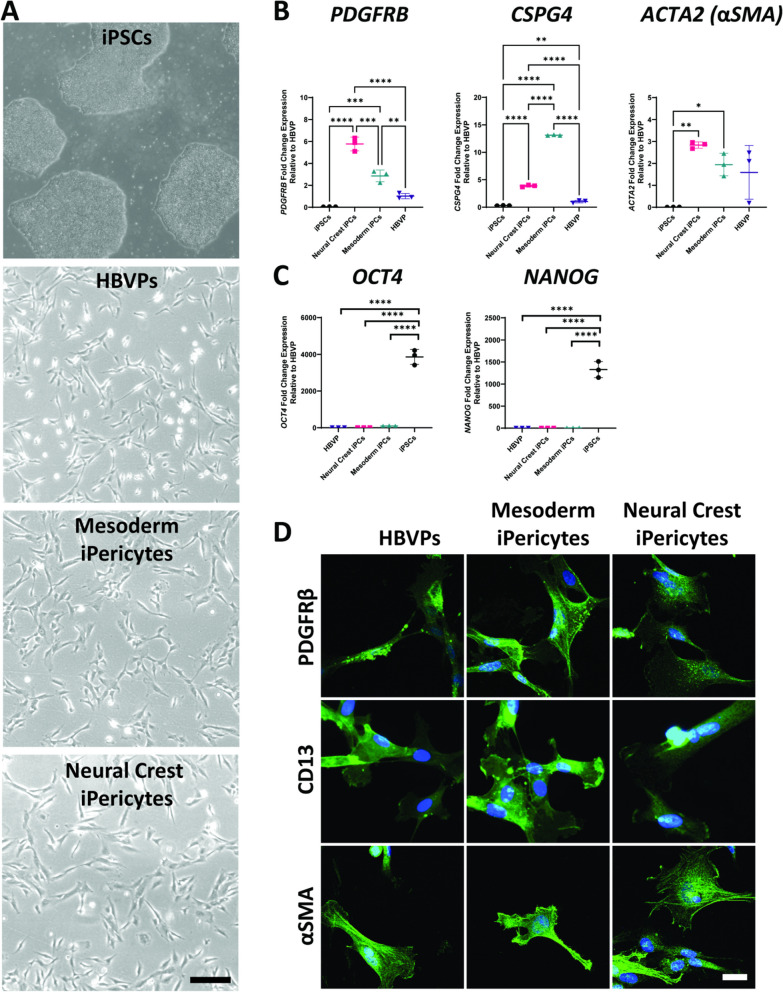
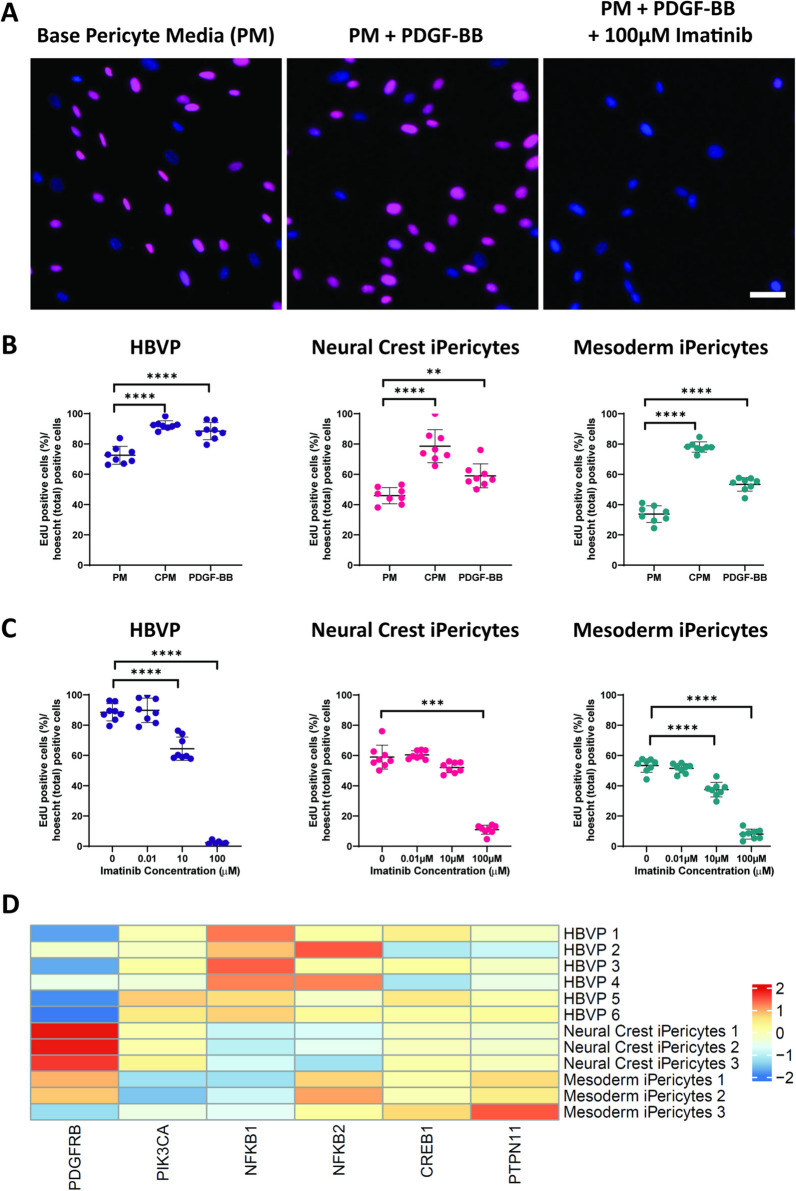
Methods: We differentiated iPSCs into iPericytes of either the mesoderm or neural crest lineage using established protocols. We compared iPericyte and HBVP morphologies, quantified gene expression by qPCR and bulk RNA sequencing, and visualised pericyte protein markers by immunocytochemistry. To determine whether the gene expression of neural crest iPericytes, mesoderm iPericytes or HBVPs correlated with their functional characteristics in vitro, we quantified EdU incorporation following exposure to the key pericyte mitogen, platelet derived growth factor (PDGF)-BB and, contraction and relaxation in response to the vasoconstrictor endothelin-1 or vasodilator adenosine, respectively.

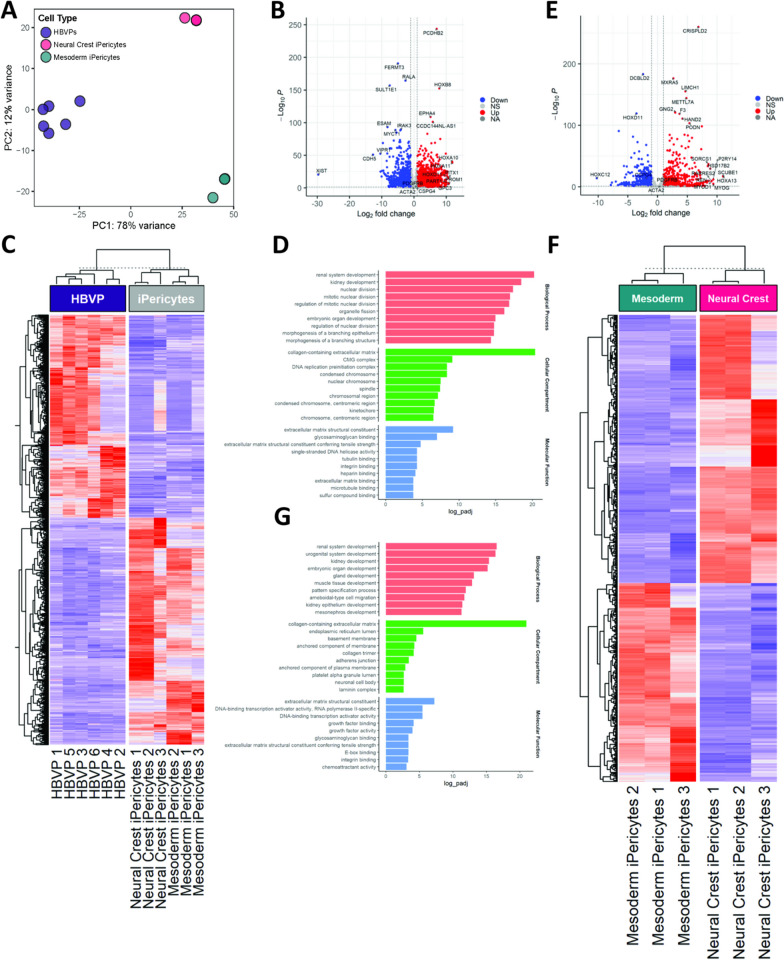
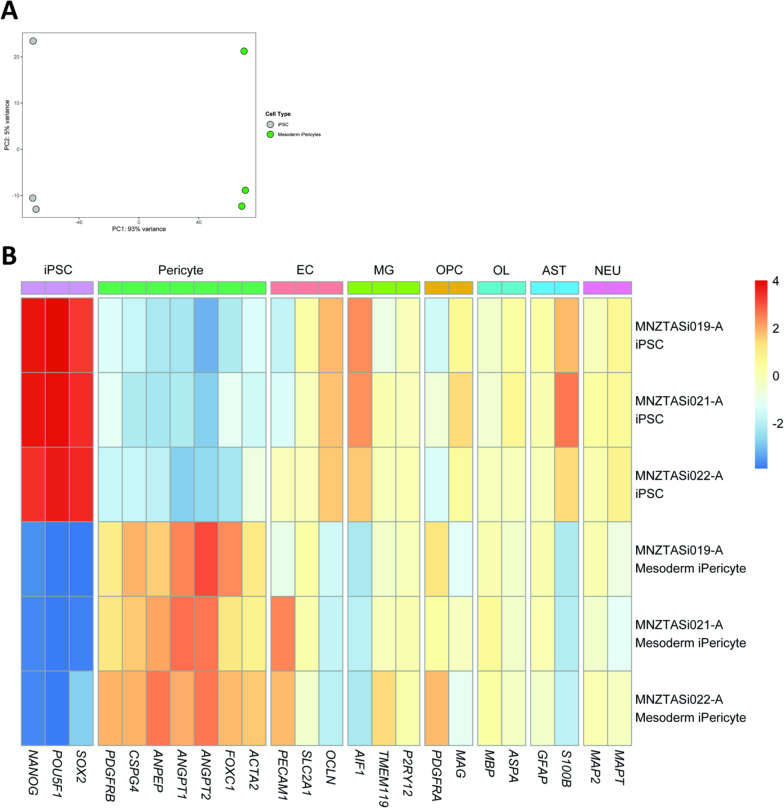
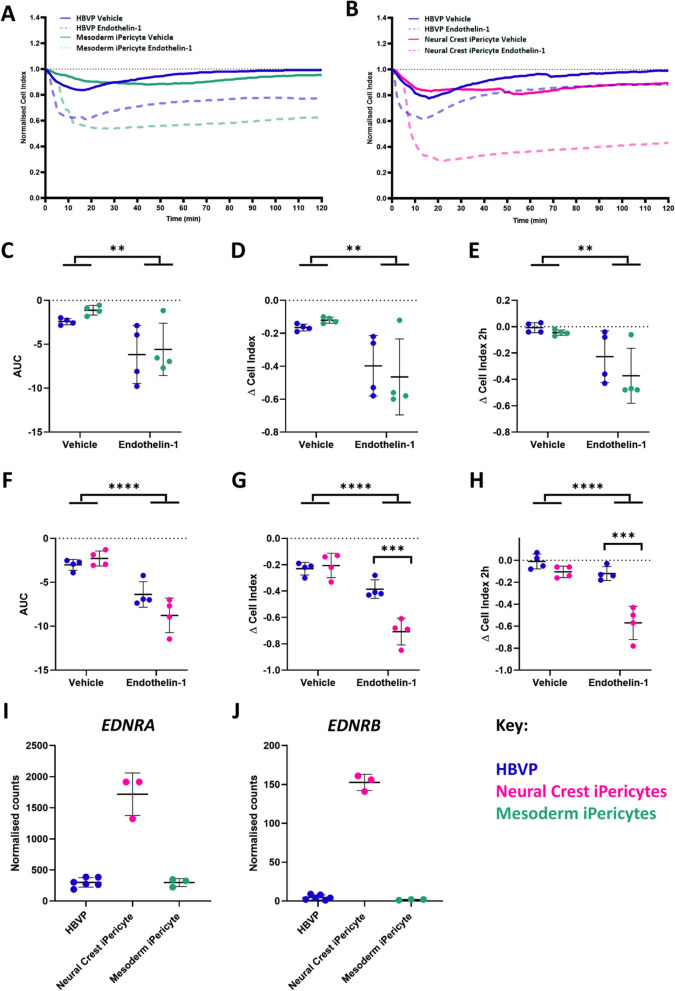
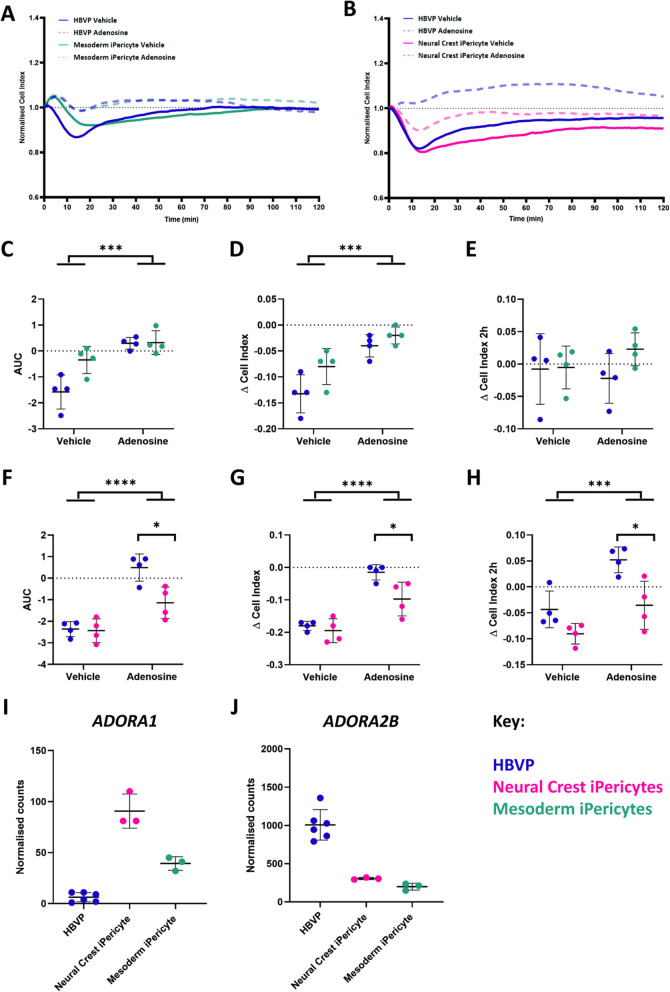
Results: iPericytes were morphologically similar to HBVPs and expressed canonical pericyte markers. However, iPericytes had 1864 differentially expressed genes compared to HBVPs, while there were 797 genes differentially expressed between neural crest and mesoderm iPericytes. Consistent with the ability of HBVPs to respond to PDGF-BB signalling, PDGF-BB enhanced and a PDGF receptor-beta inhibitor impaired iPericyte proliferation. Administration of endothelin-1 led to iPericyte contraction and adenosine led to iPericyte relaxation, of a magnitude similar to the response evoked in HBVPs. We determined that neural crest iPericytes were less susceptible to PDGFR beta inhibition, but responded most robustly to vasoconstrictive mediators.

Conclusions: iPericytes express pericyte-associated genes and proteins and, exhibit an appropriate physiological response upon exposure to a key endogenous mitogen or vasoactive mediators. Therefore, the generation of functional iPericytes would be suitable for use in future investigations exploring pericyte function or dysfunction in neurological diseases.

Keywords: Adenosine; Contractility; Endothelin-1; Human brain vascular pericytes (HBVPs); Induced pluripotent stem cells (iPSCs); Pericytes; Platelet-derived growth factor BB (PDGF-BB); Platelet-derived growth factor receptor β (PDGFRβ); Proliferation.


Conflict of interest statement

The authors declare that they have no competing interests.

Figures

Fig. 1
Fig. 1
iPericytes are morphologically similar to HBVPs and express pericyte markers. A Phase contrast bright 4 × magnification images of iPSCs, HBVPs, mesoderm iPericytes and neural crest iPericytes. Scale = 200 µm. B-C Fold change gene expression measured by qPCR of pericyte genes PDGFRB, CSPG4, ACTA2 (B) and pluripotency genes OCT4 and NANOG (C) by iPSCs, neural crest iPericytes, mesoderm iPericytes and HBVPs (n = 3 per cell type). Data are normalised to HBVP cells, and comparisons were made using a one-way ANOVA: PDGFRB (F (3, 8) = 103.1, p < 0.0001), CSPG4 (F (3, 8) = 4671, p < 0.0001), ACTA2 (F (3, 8) = 9.340, p < 0.0054), OCT4 (F (3, 8) = 1686, p < 0.0001) and NANOG (F (3, 8) = 606.4, p < 0.0001). Post-hoc comparisons performed using Dunnett’s multiple comparisons test: *p < 0.05; **p < 0.01; ***p < 0.001; ****p < 0.0001. Data are shown as mean ± SD. D Immunocytochemistry showing expression of proteins PDGFRβ, CD13, and αSMA (green) by HBVP, mesoderm iPericytes and neural crest iPericytes. Nuclei counter-stained with DAPI (blue). Scale = 10 µm
Fig. 2
Fig. 2
iPericytes derived through different lineage pathways have differential expression of genes. A PCA analysis showing separate clustering of mesoderm iPericytes, neural crest iPericytes and HBVPs (n = 6 for HBVPs, n = 3 for mesoderm or neural crest iPericytes). B Volcano plots showing upregulated and downregulated genes in iPericytes compared to HBVPs that met the log fold change threshold of 1. C Heat map showing differentially expressed genes in iPericytes compared to HBVPs. D Gene ontology analysis of key biological processes, cellular compartments and molecular function associated with 1,864 differentially expressed genes between iPericytes and HBVPs. E Volcano plots showing upregulated and downregulated genes in neural crest iPericytes compared to mesoderm iPericytes. F Heat map showing differentially expressed genes in neural crest iPericytes compared to mesoderm iPericytes. G Gene ontology analysis of key biological processes, cellular compartments and molecular function associated with 797 differentially expressed genes between neural crest iPericytes and mesoderm iPericytes
Fig. 3
Fig. 3
Mesoderm iPericytes from multiple cell lines have similar mRNA expression. A Principal components analysis showing separate clustering of mesoderm iPericytes and iPSCs from n = 3 different cell lines. B Heat map showing relative expression levels in iPSCs and mesoderm iPericytes of key genes typically expressed by iPSCs, pericytes, endothelial cells (EC), microglia (MG), oligodendrocyte precursor cells (OPCs), oligodendrocytes (OL), astrocytes (AST) and neurons (NEU). Warmer colours indicate higher expression, cooler colours indicate lower expression
Fig. 4
Fig. 4
Proliferation of iPericytes through the PDGF-BB: PDGFRβ signalling pathway. A iPericytes were incubated in basal pericyte media (PM) and treated with PDGF-BB (PM + PDGF-BB) while being exposed to 100 µM imatinib (PM + PDGF-BB + 100 µM imatinib). Proliferation was measured using an EdU uptake assay. iPericytes that are EdU-positive are indicated by magenta, while total number of iPericytes were measured by DAPI (blue). Scale bar = 50 µm. B Quantification of HBVPs, neural crest iPericytes and mesoderm iPericytes proliferating (as indicated by EdU-positive staining) as a percentage of total cells following 24 h exposure to PM, complete pericyte media with pericyte growth factors (CPM) or PM + PDGF-BB (n = 8 per condition). Data were analysed using a one-way ANOVA: HBVP (F (2, 21) = 35.52, p < 0.0001); neural crest iPericyte (F (2, 21) = 30.85, p < 0.0001); mesoderm iPericyte (F (2, 21) = 191.4, p < 0.0001). C Quantification of changes to PDGF-BB-induced proliferation with increasing concentrations of imatinib over 24 h in HBVPs, neural crest iPericytes and mesoderm iPericytes (n = 8 per condition). Data were analysed using a one-way ANOVA or Kruskal–Wallis test: HBVP (F (3, 26) = 259.2, p < 0.0001); neural crest iPericyte (H (3) = 24.41, p < 0.0001); mesoderm iPericyte (F (3, 28) = 221.5, p < 0.0001). For B, C, post-hoc comparisons were performed using Dunnett’s multiple comparisons or Dunn’s test: *p < 0.05; **p < 0.01; ***p < 0.001; ****p < 0.0001. Data shown as mean ± SD. D Heat map of key genes involved in pericyte proliferation in the PDGF-BB: PDGFRβ signalling pathway in HBVP, neural crest iPericytes and mesoderm iPericytes selected from Sweeney et al. [29]
Fig. 5
Fig. 5
Endothelin-1 induces iPericyte contraction. A, B Normalised cell index of neural crest iPericytes, mesoderm iPericytes and HBVPs treated with endothelin-1 or vehicle (CPM) over a period of 2 h (n = 4 per condition). CE Quantified AUC (C; indicator of volume of contraction), ∆ cell index (D; maximum contraction) and ∆ cell index after 2 h (E; contraction at 2 h time point)  for mesoderm iPericytes and HBVPs treated with control or endothelin-1 analysed using two-way ANOVA: AUC (cell type: F (1, 12) = 0.6953, p = 0.4206; treatment: (F (1, 12) = 13.35, p = 0.0033; interaction: F (1, 12) = 0.1006, p = 0.7565); ∆ cell index (cell type: F (1, 12) = 0.02309, p = 0.8817; treatment: F (1, 12) = 15.21, p = 0.0021; interaction: F (1, 12) = 0.5773, p = 0.4620); ∆ cell index after 2 h (cell type: F (1, 12) = 1.590, p = 0.2313; treatment: F (1, 12) = 14.31, p = 0.0026; interaction: F (1, 12) = 0.5518, p = 0.4719). FH Quantified AUC (F), ∆ cell index (G) and ∆ cell index after 2 h (H) for neural crest iPericytes and HBVPs treated with control or endothelin-1 analysed using two-way ANOVA: AUC (cell type: F (1, 12) = 1.563, p = 0.2351; treatment: (F (1, 12) = 54.67, p < 0.0001; interaction: F (1, 12) = 5.470, p = 0.0375); ∆ cell index (cell type: F (1, 12) = 13.53, p = 0.0032; treatment: F (1, 12) = 66.11, p < 0.0001; interaction: F (1, 12) = 18.47, p = 0.0010); ∆ cell index after 2 h (cell type: F (1, 12) = 34.64, p < 0.0001; treatment: F (1, 12) = 38.56, p < 0.0001; interaction F (1, 12) = 14.70, p = 0.0024). CH Post-hoc comparisons performed using Sidak’s multiple comparisons test. *p < 0.05; **p < 0.01; ***p < 0.001; ****p < 0.0001. Data shown as mean ± SD. IJ Normalised gene expression counts of differentially expressed endothelin-1 receptors in HBVP, neural crest iPericytes and mesoderm iPericytes compared using DEseq: HBVPs and neural crest iPericytes EDNRA, I log2FoldChange = 2.53, padj = 6.12E−23; EDNRB, J log2FoldChange = 5.14, padj = 9.13E−26; neural crest iPericytes compared to mesoderm iPericytes EDNRA, I log2FoldChange =  − 2.52, padj = 3.12387E−25; EDNRB, J log2FoldChange =  − 7.22, padj = 6.77016E−15
Fig. 6
Fig. 6
Adenosine induces iPericyte relaxation. A, B Normalised cell index of neural crest iPericytes, mesoderm iPericytes and HBVPs treated with adenosine or vehicle (CPM) over a period of 2 h (n = 4 per condition). CE Quantified AUC (C), ∆ cell index (D) and ∆ cell index after 2 h (E) for mesoderm iPericytes and HBVPs treated with control or adenosine analysed using two-way ANOVA: AUC (cell type: F (1, 12) = 6.583, p = 0.0247; treatment: (F (1, 12) = 26.84, p = 0.0002; interaction: F (1, 12) = 6.027, p = 0.0303); ∆ cell index (cell type: F (1, 12) = 6.387, p = 0.0265; treatment: F (1, 12) = 28.26, p = 0.0002; interaction: F (1, 12) = 1.284, p = 0.2794); ∆ cell index after 2 h (cell type: F (1, 12) = 1.460, p = 0.2502; treatment: F (1, 12) = 0.1232, p = 0.7317; interaction: F (1, 12) = 1.174, p = 0.2999). FH Quantified AUC (F), ∆ cell index (G) and ∆ cell index after 2 h (H) for neural crest iPericytes and HBVPs treated with control or adenosine analysed using two-way ANOVA: AUC (cell type: F (1, 12) = 8.596, p = 0.0126; treatment: (F (1, 12) = 50.38, p < 0.0001; interaction: F (1, 12) = 7.159, p = 0.0202); ∆ cell index (cell type: F (1, 12) = 7.881, p = 0.0158; treatment: F (1, 12) = 57.12, p < 0.0001; interaction: F (1, 12) = 3.777, p = 0.0758); ∆ cell index after 2 h (cell type: F (1, 12) = 16.46, p = 0.0016; treatment: F (1, 12) = 20.58, p = 0.0007; interaction: F (1, 12) = 1.500, p = 0.2442). CH Post-hoc comparisons performed using Sidak’s multiple comparisons test. *p < 0.05; **p < 0.01; ***p < 0.001; ****p < 0.0001. Data shown as mean ± SD. I, J Normalised gene expression counts of differentially expressed adenosine receptors in HBVP, neural crest iPericytes and mesoderm iPericytes compared using DEseq: HBVPs and neural crest iPericytes ADORA1, I log2FoldChange = 3.92, padj = 1.65E−11; ADORA2B, J log2FoldChange =  − 1.71, padj = 2.93E−19; HBVPs and mesoderm iPericytes ADORA1, I log2FoldChange = 2.72, padj = 0.00006; ADORA2B, J log2FoldChange =  − 2.33, padj = 1.52E−25; neural crest iPericytes compared to mesoderm iPericytes ADORA1, I log2FoldChange =  − 1.19, padj = 0.001; ADORA2B, J log2FoldChange =  − 0.61, padj = 0.03288

Similar articles

Cited by

References

    1. Brown LS, Foster CG, Courtney J-M, King NE, Howells DW, Sutherland BA. Pericytes and neurovascular function in the healthy and diseased brain. Front Cell Neurosci. 2019;13:282. doi: 10.3389/fncel.2019.00282. - DOI - PMC - PubMed
    1. Cashion JM, Young KM, Sutherland BA. How does neurovascular unit dysfunction contribute to multiple sclerosis? Neurobiol Dis. 2023;178:106028. doi: 10.1016/j.nbd.2023.106028. - DOI - PubMed
    1. Nortley R, Korte N, Izquierdo P, Hirunpattarasilp C, Mishra A, Jaunmuktane Z, et al. Amyloid beta oligomers constrict human capillaries in Alzheimer’s disease via signaling to pericytes. Science. 2019;365:6450. doi: 10.1126/science.aav9518. - DOI - PMC - PubMed
    1. Hall CN, Reynell C, Gesslein B, Hamilton NB, Mishra A, Sutherland BA, et al. Capillary pericytes regulate cerebral blood flow in health and disease. Nature. 2014;508(7494):55–60. doi: 10.1038/nature13165. - DOI - PMC - PubMed
    1. Shibahara T, Ago T, Nakamura K, Tachibana M, Yoshikawa Y, Komori M, et al. Pericyte-mediated tissue repair through PDGFRβ promotes peri-infarct astrogliosis, oligodendrogenesis, and functional recovery after acute ischemic stroke. eNeuro. 2020;7(2). - PMC - PubMed

Publication types