. 2024 Jul;20(7):1651-1672.
doi: 10.1080/15548627.2024.2325304. Epub 2024 Mar 8.

Lopinavir enhances anoikis by remodeling autophagy in a circRNA-dependent manner

Affiliations

Lopinavir enhances anoikis by remodeling autophagy in a circRNA-dependent manner

Yaran Wu et al. Autophagy. 2024 Jul.

Abstract

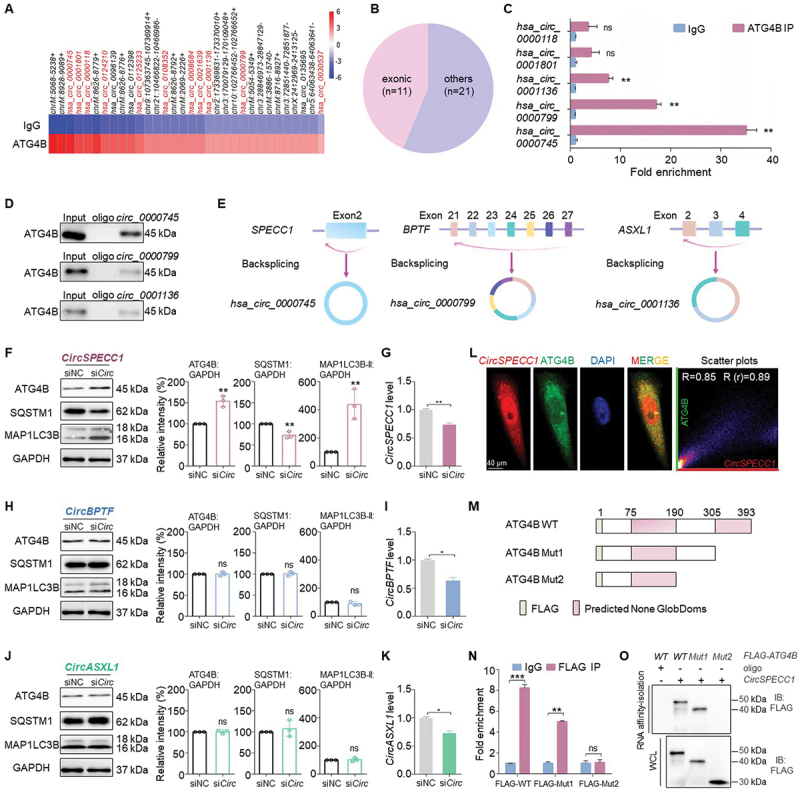
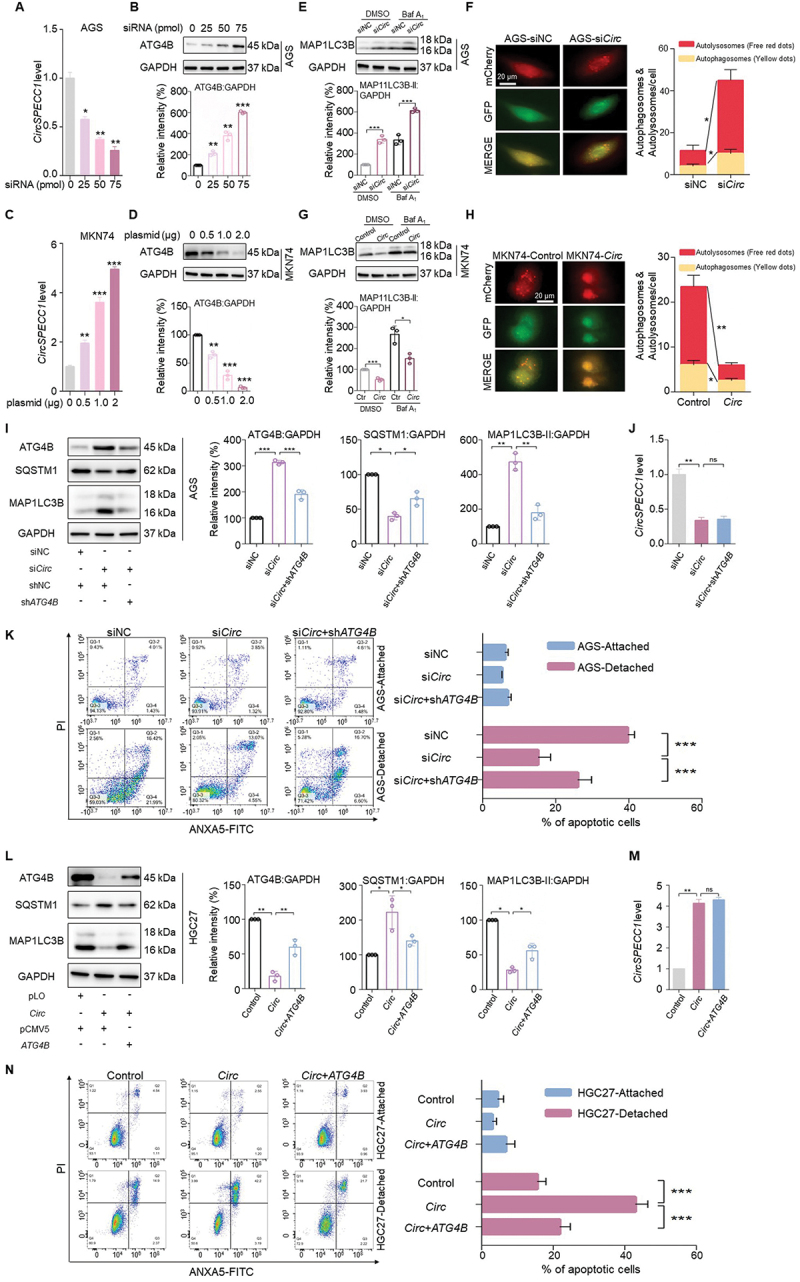
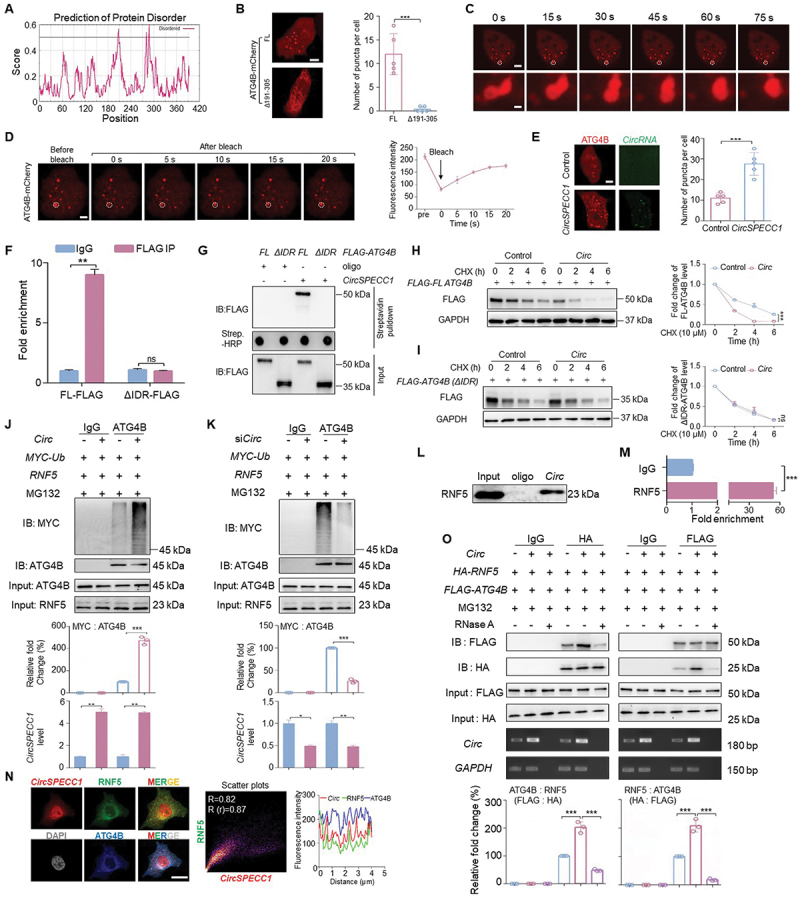
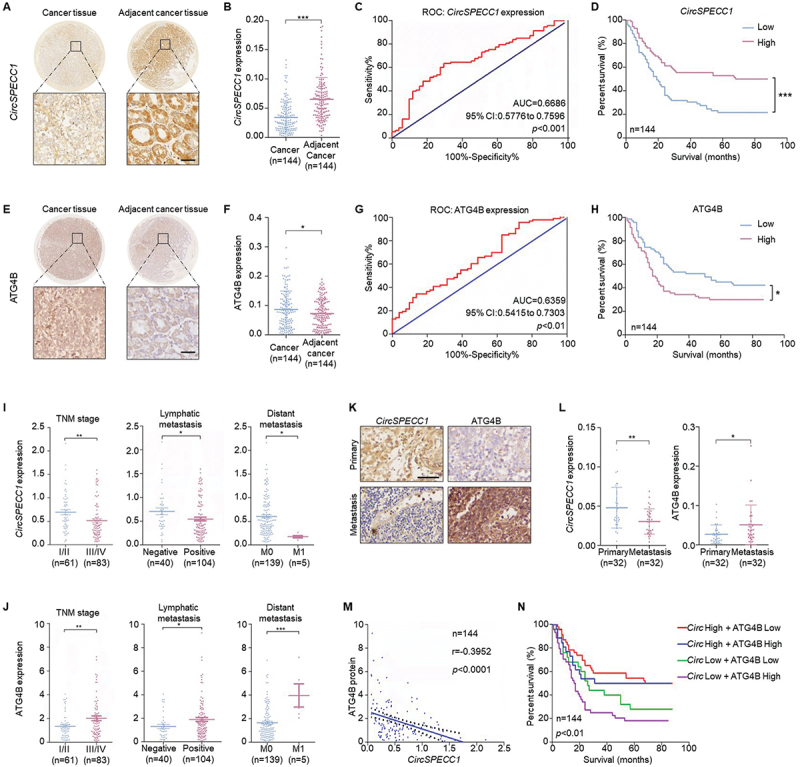
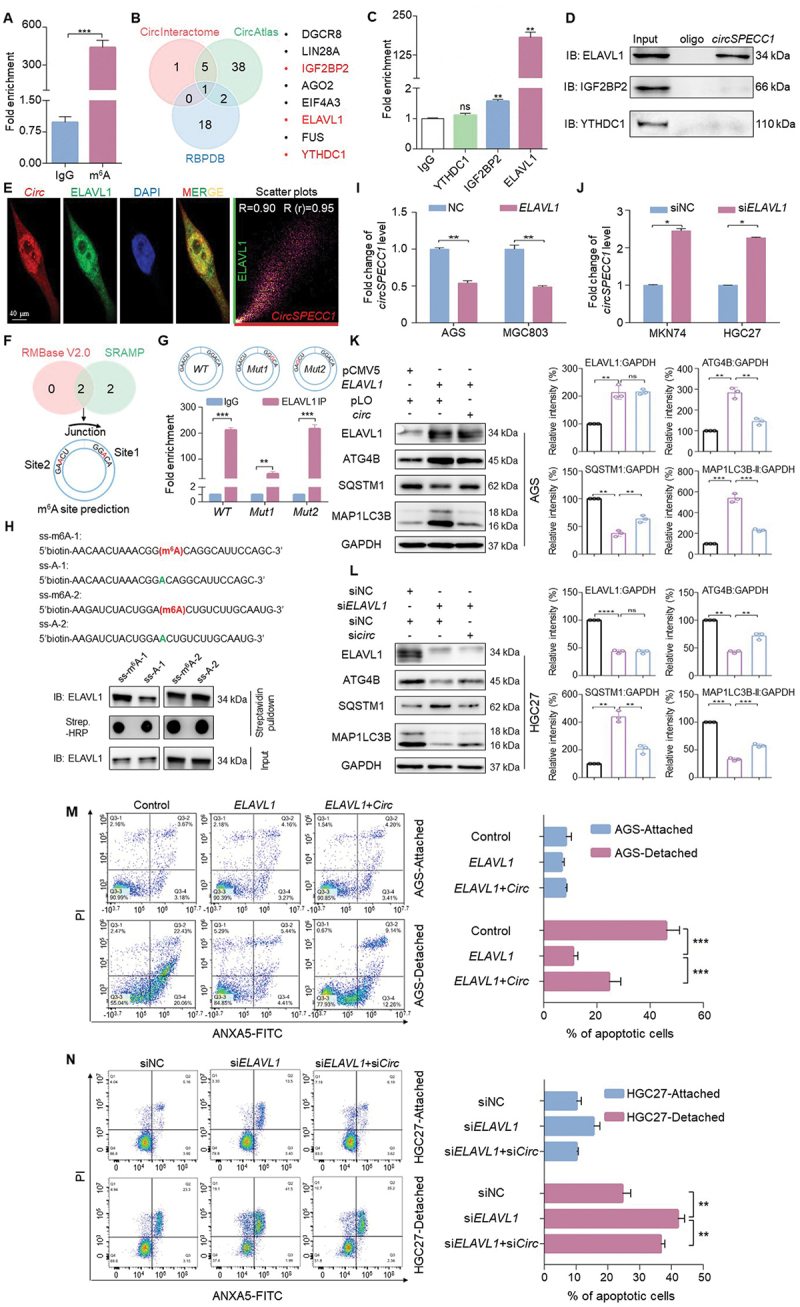
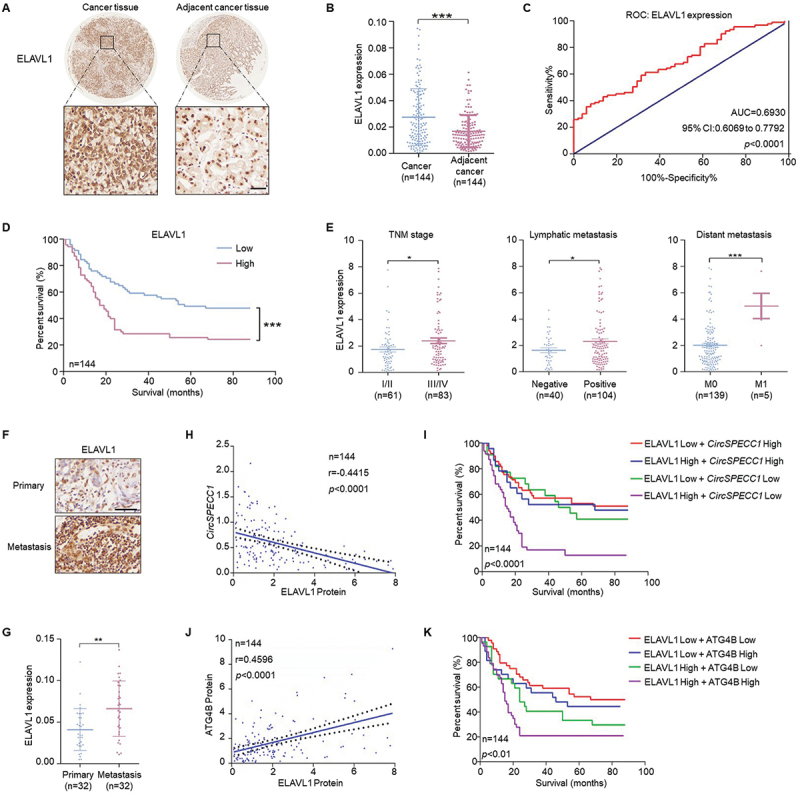
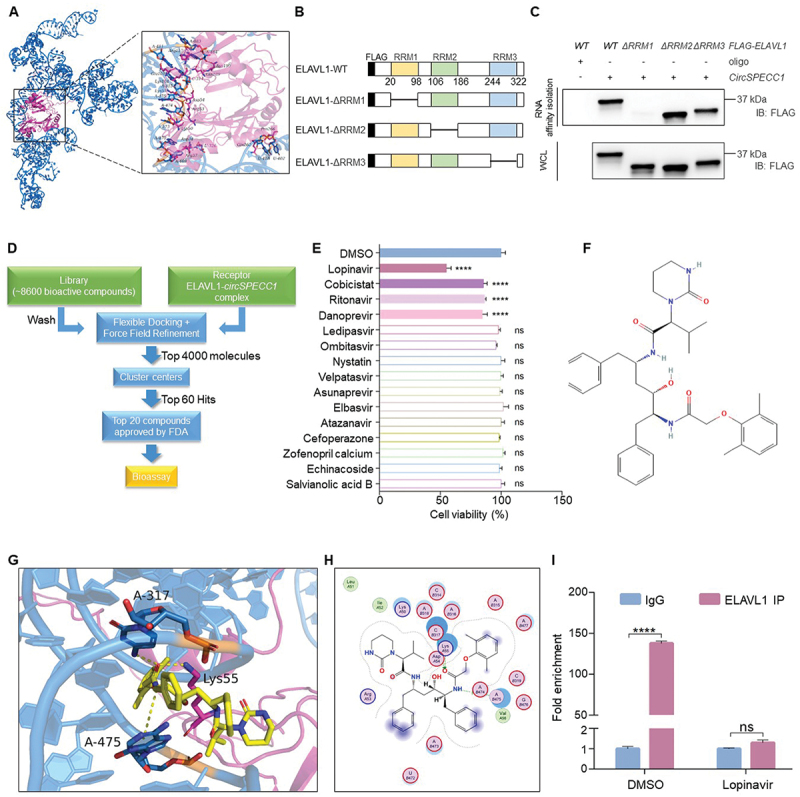
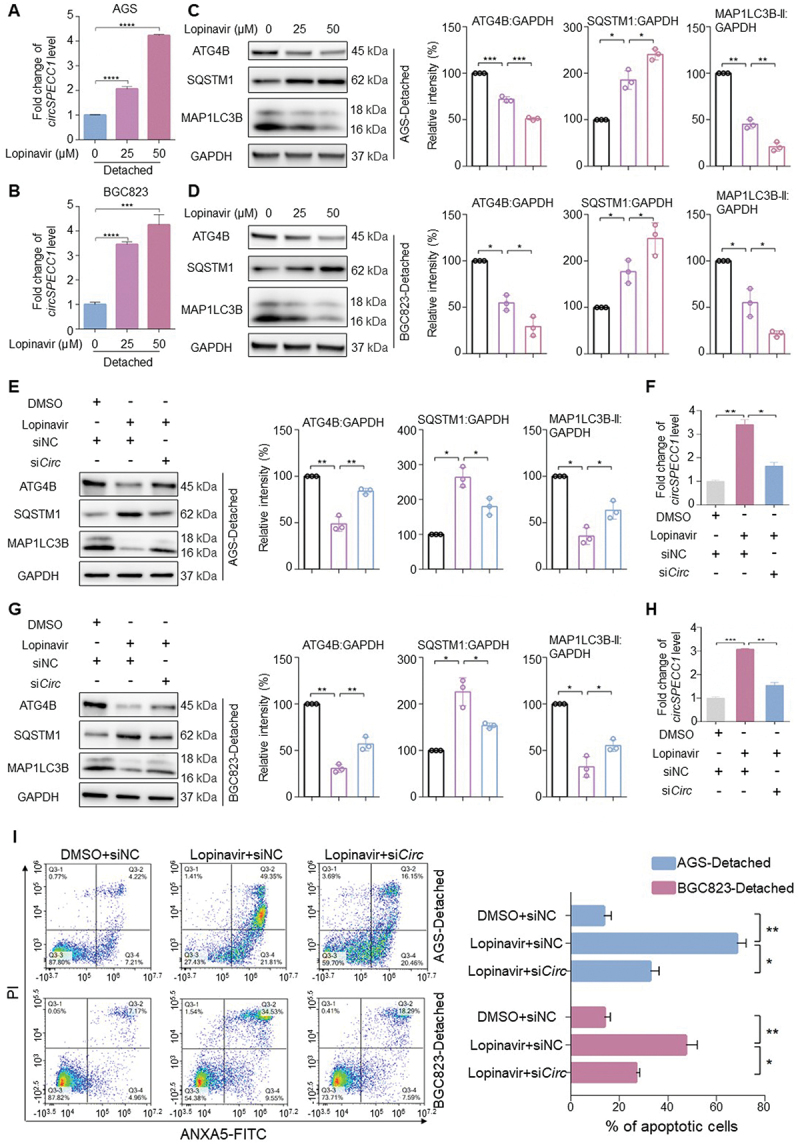
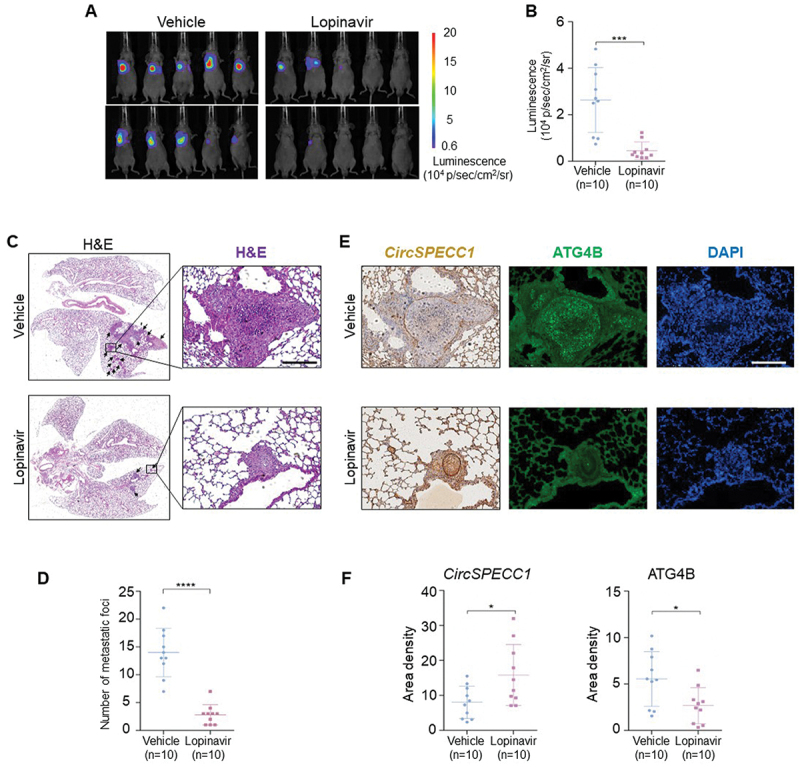
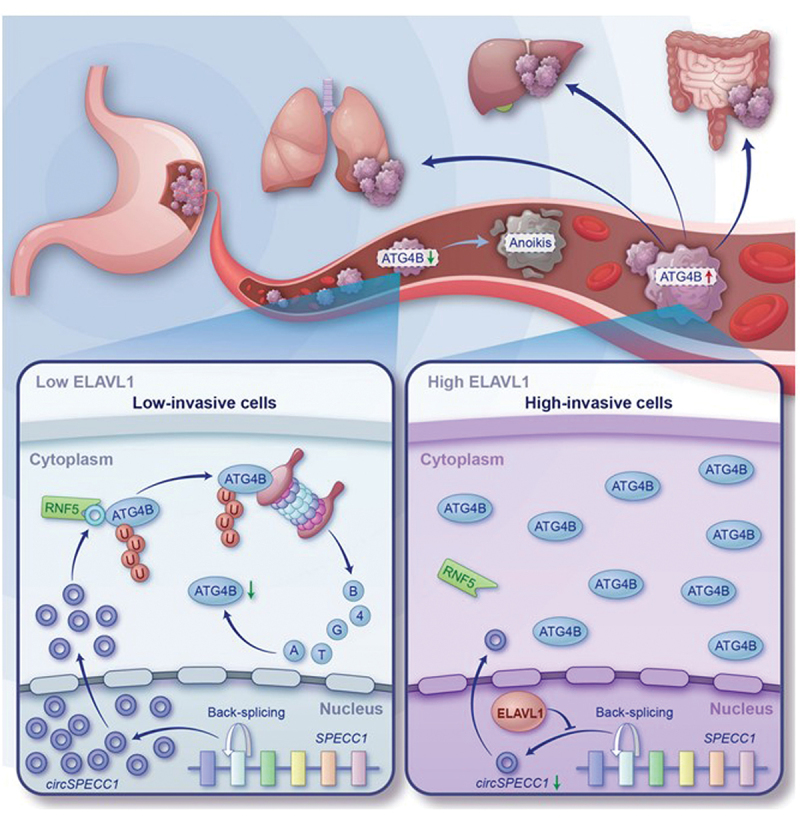
Macroautophagy/autophagy-mediated anoikis resistance is crucial for tumor metastasis. As a key autophagy-related protein, ATG4B has been demonstrated to be a prospective anti-tumor target. However, the existing ATG4B inhibitors are still far from clinical application, especially for tumor metastasis. In this study, we identified a novel circRNA, circSPECC1, that interacted with ATG4B. CircSPECC1 facilitated liquid-liquid phase separation of ATG4B, which boosted the ubiquitination and degradation of ATG4B in gastric cancer (GC) cells. Thus, pharmacological addition of circSPECC1 may serve as an innovative approach to suppress autophagy by targeting ATG4B. Specifically, the circSPECC1 underwent significant m6A modification in GC cells and was subsequently recognized and suppressed by the m6A reader protein ELAVL1/HuR. The activation of the ELAVL1-circSPECC1-ATG4B pathway was demonstrated to mediate anoikis resistance in GC cells. Moreover, we also verified that the above pathway was closely related to metastasis in tissues from GC patients. Furthermore, we determined that the FDA-approved compound lopinavir efficiently enhanced anoikis and prevented metastasis by eliminating repression of ELAVL1 on circSPECC1. In summary, this study provides novel insights into ATG4B-mediated autophagy and introduces a viable clinical inhibitor of autophagy, which may be beneficial for the treatment of GC with metastasis.

Keywords: ATG4B; ELAVL1; circSPECC1; gastric cancer; m6A; metastasis.


Conflict of interest statement

No potential conflict of interest was reported by the author(s).

Figures

Figure 1.
Figure 1.
CircSPECC1 physically interacts with ATG4B. (A) Heatmap of the 32 most enriched circRNAs potentially binding to ATG4B protein determined by RIP-seq. Anti-ATG4B antibody was used to enrich ATG4B-interacting RNA. Subsequently, the RNA was purified and the sequencing library were prepared for deep sequencing. An isotype control antibody was included as a negative control. (B) Genomic origin of the circRNAs from (A), and exonic circRNAs are marked with red in (A). Among the top 32 circRNAs enriched by ATG4B, 11 circRNAs were generated from exons (exonic) and the remaining 21 circRNAs were generated from introns or intergenic regions (others). (C) Validation of 5 candidate circRNAs binding to ATG4B protein by RIP-qPCR, which are determined to be differentially expressed among gastric cancer tissues and corresponding adjacent tissues in GEO datababse. AGS cell lysates were prepared and subjected to immunoprecipitation with anti-ATG4B antibody. Then RNA was purified from the precipitation and qRT-PCR was performed with the indicated primers. Ten percent of RNA from the cell lysates was reserved as input and an isotype control antibody was included as a negative control. (D) The interaction of indicated circRNA with ATG4B detected with RNA affinity-isolation assay. The probe targeting the back-splicing site of indicated circRNA was labeled with biotin and conjugated to streptavidin beads. Then AGS cell lysates were incubated with the probe-beads complex and the precipitation was immunoblotted with ATG4B antibody. (E) Schematic diagram of the three validated circRNAs in (D). As shown in the illustration, hsa_circ_0000745, hsa_circ_0000799 and hsa_circ_0001136 were back-spliced from exon2 of SPECC1, exon21 to exon27 of BPTF, exon2 to exon4 of ASXL1, respectively. (F, H, J) Expression of autophagic proteins in circSPECC1 (F), circBPTF (H) and circASXL1 (J) knockdown AGS cells. A total of 25 pmol siRNA (siCirc) targeting circSPECC1 (F), circBPTF (H), and circASXL1 (J) were individually transfected into AGS cells for 24 h. The protein levels of ATG4B, SQSTM1 and MAP1LC3B were then detected and quantified using immunoblot assay. (G, I, K) The knock down efficiency of siRNAs (siCirc) targeting circSPECC1(G), circBPTF (I) and circASXL1 (K) was determined by qRT-PCR. (L) Representative confocal images of circSPECC1 and ATG4B colocalization. AGS cells were stained with ATG4B (green) and circSPECC1 (red), using IF assay coupled with FISH. The nuclei were counterstained with DAPI. Subsequently the confocal analysis was performed. Scatter plots represent colocalization analyses between circSPECC1 and ATG4B using Fiji ImageJ. Pearson coefficient (R) and overlap coefficient (r[r]) are listed. Scale bar: 40 μm. (M) The design of the truncated ATG4B expression plasmids. All the constructs were fused with three FLAG tags at N terminus. (N) RIP-qPCR assay with truncated FLAG-fused ATG4B. Indicated truncated mutants of ATG4B fused with FLAG were transfected into AGS cells for 36 h, then the cell lysates were collected and subjected to immunoprecipitation with anti-FLAG antibody or the corresponding IgG antibody. Then RNA was purified from the precipitation and qRT-PCR was performed with circSPECC1 primers. (O) RNA affinity-isolation assay with truncated FLAG-fused ATG4B. AGS cells were treated as in (N), and the cell lysates were incubated with circSPECC1 probe-conjugated beads. Subsequently, the precipitation was immunoblotted with FLAG antibody. The relative intensity of listed proteins in (F), (H) and (J) was calculated and normalized with control after quantification. Data are means ± SD (n = 3). ns, no significance; *p < 0.05; **p < 0.01; ***p < 0.001.
Figure 2.
Figure 2.
CircSPECC1 impairs autophagic flux and enhances anoikis by downregulating ATG4B in GC cells. (A, B) The siRNA of circSPECC1 reduced the circSPECC1 expression (A) and increased the protein level of ATG4B in a dose-dependent manner (B). A total of 25 pmol, 50 pmol and 75 pmol circSPECC1 siRNA were transfected into AGS cells for 48 h respectively, followed by qRT-PCR assay with circSPECC1 primer (A) and immunoblot assay with ATG4B antibody (B). (C, D) The overexpression of circSPECC1 dose-dependently increased the circSPECC1 level (C) and decreased the ATG4B protein level (D). A total of 0.5 μg, 1 μg and 2 μg circSPECC1 expression plasmid were transfected into MKN74 cells for 48 h respectively, followed by qRT-PCR assay with circSPECC1 primer (C) and immunoblot assay with ATG4B antibody (D). (E, G) CircSPECC1 negatively regulated the expression of MAP1LC3B-II in GC cells. AGS cells were transfected with 25 pmol circSPECC1 siRNA (siCirc) or control siRNA (siNC), and MKN74 cells were transfected with 0.5 μg circSPECC1 expression plasmid (Circ) or empty vector (control). All groups were treated with 0.2 μM baf A1 or equal volume of DMSO overnight at 36 h post transfection. Then cell lysates were collected and detected by immunoblot assay. (F, H) Representative fluorescence images of cells transfected with mCherry-EGFP-LC3 in the presence of circSPECC1 siRNA (F) or circSPECC1 expression vector (H). AGS (F) or MKN74 (H) expressing mCherry-EGFP-LC3 were seeded in 6-well plate. After transfection of circSPECC1 siRNA (F) or circSPECC1 expression vector (H) for 24 h, the numbers of autophagosome (yellow puncta) and autolysosome (red-only puncta) were counted. Scale bar: 20 μm. (I, L) AGS cells (I) or HGC-27 cells (L) were transfected with indicated plasmids or siRNAs. After 48 h, the protein levels of ATG4B, SQSTM1 and MAP1LC3B were detected and quantified using immunoblot assay. (J, M) The knockdown efficiency (J) or overexpression efficiency (M) of circSPECC1 in GC cells. Cells were treated as in (I) or (L) respectively. Then total RNA was isolated and qRT-PCR was performed with circSPECC1 primer. (K, N) The role of ATG4B in the influence of circSPECC1 on anoikis resistance. Cells were transfected as in (I) or (L), followed by cultured in normal or ultra-low attachment plates for 48 h. Subsequently, the cells were collected and flow cytometry was performed to detect the apoptosis of the cells. The apoptosis rates were calculated as the percentage of ANXA5-positive and ANXA5- and PI-double-positive cells. The relative intensity of proteins listed in (B), (D), (E), (G), (I) and (L) was calculated and normalized with control after quantification. Data are means ± SD (n = 3). *p < 0.05; **p < 0.01; ***p < 0.001.
Figure 3.
Figure 3.
CircSPECC1 promotes LLPS of ATG4B and accelerates ATG4B ubiquitination. (A) Prediction of the intrinsically disorder region (IDR) within ATG4B using IUPred2A (https://iupred2a.Elte.hu). 0.5 serves as the boundary for whether it is a disordered region. (B) ATG4B formed puncta in MGC803 cells via its 191–305 region. MGC803 cells were seeded in 35-mm confocal dishes and transfected with FL ATG4B-mCherry or Δ191–305 ATG4B-mCherry (2 μg/35-mm dish) for 24 h. Then the cells were imaged by confocal microscope. Representative pictures were shown (left panel), and the numbers of mCherry puncta (dia. >0.5 μm) per cell were counted in five random fields (right panel). Scale bar: 5 μm. (C) The puncta of ATG4B underwent fusion. MGC803 cells were treated as in (B), and the cells were analyzed with time-series confocal microscopy. The bottom row shows a magnified view of two fusing puncta. Scale bar: 5 μm (top) and 2 μm (bottom). (D) The puncta of ATG4B underwent a highly dynamic process. MGC803 cells were treated as in (B). Subsequently the images were captured before and after photobleaching. Scale bar: 5 μm. (E) More ATG4B puncta were formed in the presence of circSPECC1. MGC803 cells expressing ATG4B-mCherry were transfected with exogenous circSPECC1 or not, which was synthesized in vitro and labeled with 488-UTP. Then the cells were imaged by confocal microscope. Scale bar: 5 μm. (F, G) RIP-qPCR assay (F) and RNA affinity-isolation assay (G) with FL or IDR deletion (ΔIDR) of FLAG-fused ATG4B. FL or ΔIDR ATG4B fused with FLAG were transfected into MGC803 cells for 36 h, then the cells lysates were collected and subjected to enrichment with anti-FLAG antibody (F) or biotin labeled probes targeting circSPECC1 (G). Then the precipitations were purified for RNA or denatured, respectively, and followed by qRT-PCR with circSPECC1 primer (F) or immunoblot with anti-FLAG antibody (G) correspondingly. (H, I) The effect of circSPECC1 on the stability of FL (H) or ΔIDR (I) of ATG4B. HEK293 cells expressing FLAG-FL ATG4B (H) or FLAG- ATG4B (ΔIDR) (I) were transfected with circSPECC1 expression plasmid or empty vector for 36 h, followed by treatment with 10 μM CHX at the indicated time. Then the protein levels of FLAG were detected and quantified using immunoblot assay. (J, K) The effect of circSPECC1 on the ubiquitination level of ATG4B. The cells expressing RNF5 and MYC-ubiquitin (MYC-Ub) were transfected with circSPECC1 expression plasmid (circ, J) or circSPECC1 siRNA (siCirc, K) for 36 h. After treatment with MG132 (10 μM) overnight, the level of circSPECC1 was detected by qRT-PCR, and the level of ubiquitin was analyzed by immunoblotting using anti-MYC antibody after immunoprecipitation with anti-ATG4B antibody. (L, M) The interaction of circSPECC1 with RNF5. RNA affinity-isolation assay with circSPECC1 probe (L) or RIP-qPCR assay with RNF5 antibody (M) was performed. (N) Representative confocal images of RNF5 colocalization with circSPECC1 and ATG4B. MGC803 cells were stained with RNF5 (green), ATG4B (blue) and circSPECC1 (red), using IF assay coupled with FISH. The nuclei were counterstained with DAPI (grey). Subsequently the confocal analysis was performed. Scatter plots represent colocalization analyses between circSPECC1 and RNF5 using Fiji ImageJ. Pearson coefficient (R) and overlap coefficient (r[r]) are listed. Fluorescence intensity profile along the white line are also shown. Scale bar: 10 μm. (O) The effect of circSPECC1 on the interaction of ATG4B with RNF5. HEK293 cells expressing FLAG-ATG4B and HA-RNF5 were transfected with or without circSPECC1 expression plasmid for 36 h. After treatment with MG132 overnight, the cells lysates were collected and treated with or without RNase A. Subsequently, the RNA levels of circSPECC1 and GAPDH were detected by RT – PCR. The protein levels of ATG4B and RNF5 were analyzed by immunoblotting using indicated antibodies after immunoprecipitation with anti-FLAG or anti-HA beads. The relative intensity of listed proteins in (H), (I), (J), (K) and (O) was calculated and normalized with control after quantification. Data are means ± SD (n = 3). ns, no significance; *p < 0.05; **p < 0.01; ***p < 0.001.
Figure 4.
Figure 4.
The expression of circSPECC1 is negatively correlated with that of ATG4B in GC tissues. (A, E) Representative image of circSPECC1 (A) and ATG4B (E) in gastric cancer tissues and corresponding adjacent tissues. The tissue microarrays were dewaxed and rehydrated. After antigen retrieval, ISH with probes targeting circSPECC1 (A) and IHC staining with ATG4B antibody (E) was performed respectively. Then images were captured by microscopy system. Scale bar: 50 μm. (B, F) The levels of circSPECC1 (B) and ATG4B (F) in 144 pairs of gastric cancer and adjacent tissues. (B) The circSPECC1 quantification of the data from (A). (F) The ATG4B quantification of the data from (E). (C, G) The area under the ROC curve (AUC) was applied to predict the relationship between patient survival state and the relative expression of circSPECC1 (C) or ATG4B (G). The score with the maximal sum of sensitivity and specificity was used to distinguish the high or low expression groups. (D, H) The survival time of patients based on the relative levels of circSPECC1 (D) or ATG4B (H) was analyzed by Kaplan-Meier. (I, J) The correlation between the levels of circSPECC1 (I) or ATG4B (J) and TNM stage, lymphatic metastasis, and distant metastasis in patients diagnosed with gastric cancer. (K) Representative staining of circSPECC1 and ATG4B in the primary and metastasis cancer tissues. Scale bar: 50 μm. (L) The levels of circSPECC1 and ATG4B in 32 pairs of primary and metastasis cancer tissues. Quantification of the data from (K). (M) the correlation between the levels of circSPECC1 and ATG4B protein. (N) The overall survival time of patients based on the combination of circSPECC1 and ATG4B. *p < 0.05, **p < 0.01 and ***p < 0.001.
Figure 5.
Figure 5.
ELAVL1 recognizes and inhibits circSPECC1, enhancing anoikis resistance by increasing ATG4B subsequently. (A) CircSPECC1 underwent m6A modification in AGS cells. Fragmented RNA from AGS cells were incubated with m6A specific antibody or corresponding isotype control, followed by qRT-PCR with circSPECC1 primer. (B) CircInteractome, CircAtlas and RBPDB were used to predict potential proteins that interact with circSPECC1. The m6A related proteins were marked in red. (C, D) The interaction of circSPECC1 with indicated m6A reader from (B). AGS cell lysates were prepared, followed by incubation with the indicated antibodies (C) or circSPECC1 probe (D). Then the level of circSPECC1 was detected by qRT-PCR (C) and the protein levels were analyzed by immunoblotting using indicated antibodies (D). (E) Representative confocal images of circSPECC1 and ELAVL1 colocalization. AGS cells were stained with ELAVL1 (green) and circSPECC1 (red), using IF assay coupled with FISH. The nuclei were counterstained with DAPI (blue). Subsequently the confocal analysis was performed. Scatter plots represent colocalization analyses between circSPECC1 and ELAVL1 using Fiji ImageJ. Pearson coefficient (R) and overlap coefficient (r[r]) are listed. Scale bar: 40 μm. (F) Predicted m6A modification site near the back-splicing site of circSPECC1. The prediction was performed using sequence-based N6-methyladenosine (m6A) modification site predictor (SRAMP) and RMBase v2.0. (G) ELAVL1 recognizes circSPECC1 in m6A-dependent manner. The two predicted m6A modified sites in (F) were mutated to G respectively. Then WT or mutant of circSPECC1 was transfected into HEK293 cells for 24 h. Subsequently, the level of circSPECC1 was detected by qRT-PCR after immunoprecipitation with ELAVL1 antibody. (H) The interaction of ELAVL1 with circSPECC1 depends on the m6A modification. The single strand RNA of circSPECC1 with or without m6A modification were synthesized and labeled with biotin at 5’ ends. The level of ELAVL1 was analyzed by immunoblotting after affinity isolation using the above ssRNA in HEK293 cell lysates. (I, J) ELAVL1 negatively regulates circSPECC1 in GC cells. AGS and MGC803 cells were transfected with ELAVL1 expression plasmid or empty vector (I). MKN74 and HGC27 cells were transfected with ELAVL1 siRNA or scramble (J). Then the level of circSPECC1 was detected by qRT-PCR. (K, L) The role of circSPECC1 in ATG4B regulation by ELAVL1. CircSPECC1 expression plasmid was transfected into ELAVL1 overexpressed AGS cells (K), and circSPECC1 siRNA was transfected into ELAVL1 knockdown HGC27 cells (L). Then the protein levels were analyzed and quantified by immunoblotting. (M, N) The role of circSPECC1 in the influence of ELAVL1 on anoikis resistance. AGS cells (M) and HGC27 cells (N) were transfected as in (K) or (L) respectively, followed by cultured in normal or ultra-low attachment plates for 48 h. Subsequently, the cells were collected and apoptosis was analyzed by flow cytometry. The apoptosis rates were calculated as the percentage of ANXA5-positive and ANXA5- and PI-double-positive cells. The relative intensity of listed proteins in (K) and (L) was calculated and normalized with control after quantification. Data are means ± SD (n = 3). ns., no significance; *p < 0.05, **p < 0.01 and ***p < 0.001.
Figure 6.
Figure 6.
The correlation of ELAVL1 expression with that of circSPECC1 and ATG4B in gastric cancer tissues. (A) Representative IHC staining of ELAVL1 in gastric cancer tissues and corresponding adjacent tissues. The tissue microarrays were dewaxed and rehydrated. After antigen retrieval, IHC staining with ELAVL1 antibody was performed. Then images were captured by microscopy system. Scale bar: 50 μm. (B) The relative level of ELAVL1 in 144 pairs of gastric cancer and adjacent tissues. Quantification of the data from (A). (C) The AUC was applied to predict the relationship between patient survival state and the relative expression of ELAVL1. The score with the maximal sum of sensitivity and specificity was used to distinguish the high or low expression groups. (D) The survival time of patients based on the relative expression level of ELAVL1 was analyzed by Kaplan-Meier. (E) The association between the level of ELAVL1 and TNM stage, lymphatic metastasis, distant metastasis in gastric cancer patients. (F) Representative IHC staining of ELAVL1 in the primary and metastasis cancer tissues. Scale bar: 50 μm. (G) The relative level of ELAVL1 in 32 pairs of primary and metastasis cancer tissues. Quantification of the data from (F). (H, J) The correlations between the levels of ELAVL1 and circSPECC1 (H), or ELAVL1 and ATG4B (J). (I, K) The survival time of patients based on the combination of ELAVL1 with circSPECC1 (I) or ATG4B (K). *p < 0.05, **p < 0.01 and ***p < 0.001.
Figure 7.
Figure 7.
The FDA-approved lopinavir was selected with molecular docking to interrupt the interaction of ELAVL1 with circSPECC1. (A) The 3D binding model of the circSPECC1 and ELAVL1 complex. The backbone of circSPECC1 is depicted as cyan cartoon and the backbone of ELAVL1 is depicted as hot pink cartoon. The residues in ELAVL1 are shown as magenta stick and the bases in circSPECC1 are shown as cyan stick. (B) A schema showing four constructs containing full-length or different domains of ELAVL1. All the constructs were fused with 3 × FLAG tag at N terminus. (C) RNA affinity-isolation analysis of the interaction between circSPECC1 and ELAVL1. Indicated mutants of ELAVL1 fused with FLAG were transfected into AGS cells for 36 h, and the cell lysates were incubated with circSPECC1 probe-conjugated beads. Subsequently, the protein levels of ELAVL1 were analyzed by immunoblotting using FLAG antibody. (D) Flowchart of the virtual screening workflow. A target library containing about 8600 active compounds were prepared for molecular docking and ranked by flexible docking. The top 4000 molecules were selected and divided into structural clusters through fingerprint-based clustering and the top 60 ranked molecules were finally identified as potential hits. Among the 60 compounds, 20 compounds which have been approved by FDA were initially selected for bioassay. (E) Bioactive screen of the selected compounds on anoikis. AGS cells were seeded in 96-well plates with ultra-low attachment and treated with 30 μM FDA approved compounds selected in (D) for 48 h. Then the cell viability was measured by CCK-8 assay. (F) Chemical structure of lopinavir. 2D structure of lopinavir from Pubchem database. (https://pubchem.ncbi.nlm.nih.gov/compound/92727). (G, H) A 3D diagram (G) or 2D diagram (H) of the interaction between lopinavir and ELAVL1-circSPECC1 complex. (I) The effect of lopinavir on the interaction between circSPECC1 and ELAVL1. AGS cells were treated with lopinavir or DMSO for 24 h. Then the level of circSPECC1 was detected by qRT-PCR after immunoprecipitation with ELAVL1 antibody. Data are means ± SD (n = 3). ns., no significance; ****p < 0.0001.
Figure 8.
Figure 8.
Lopinavir inhibits autophagy and promotes anoikis in a circSPECC1-dependent manner. (A, B) The effect of lopinavir on the circSPECC1 level in suspension-cultured cells. AGS cells (A) or BGC823 cells (B) were cultured in ultra-low attachment plates for 24 h, and then treated with indicated doses of lopinavir for another 24 h. Then the level of circSPECC1 was detected by qRT-PCR. (C, D) The effect of lopinavir on the autophagic protein level in suspension-cultured cells. AGS cells (C) or BGC823 cells (D) were treated as in (A) or (B). Then the protein levels of ATG4B, SQSTM1 and MAP1LC3B were analyzed and quantified by immunoblotting. (E, G) The effect of circSPECC1 knockdown on the reduction of ATG4B by lopinavir. The stable circSPECC1 knockdown AGS cells (E) or BGC823 cells (G) were cultured in ultra-low attachment plates for 24 h, and then treated with indicated doses of lopinavir for another 24 h. Then the protein levels of ATG4B, SQSTM1 and MAP1LC3B were analyzed and quantified by immunoblotting. (F, H) The circSPECC1 level in (E) and (G). Cells were treated as in (E) or (G), and the level of circSPECC1 was detected by qRT-PCR. (I) The effect of circSPECC1 knockdown on the promotion of anoikis by lopinavir. AGS cells and BGC823 cells were treated as in (E) and (G), respectively. Then apoptosis was analyzed by flow cytometry, and the apoptosis rates were calculated as the percentage of ANXA5-positive and ANXA5- and PI-double-positive cells. The relative intensity of listed proteins in (C), (D), (E) and (G) was calculated and normalized with control after quantification. Data are means ± SD (n = 3). *p < 0.05, **p < 0.01, ***p < 0.001 and ****p < 0.0001.
Figure 9.
Figure 9.
Lopinavir inhibits metastasis of gastric cancer in vivo. (A) The image of in vivo bioluminescence imaging. AGS cells were injected into nude mice (n = 10 in each group) via the tail vein, followed by lopinavir intraperitoneal injection (20 mg/kg per day) or isovolumetric corn oil every 2 days for 6 weeks. The luminescence intensity of the mice was measured using in vivo small animal imaging technology. (B) Statistical analysis of the luminescence intensity in (A). (C, D) Representative HE-staining images (C) of nude mice tail-vein lung metastasis model and the corresponding foci quantification (D). The mice in (A) were sacrificed and lungs were removed for hematoxylin – eosin (H&E) staining according to standard procedures. Then the slides were scanned with BioTek Cytation5 imaging system. Scale bar: 200 μm. (E, F) Representative staining of circSPECC1 and ATG4B (E), and the corresponding area densities (F) in the lung metastatic tissues. The slides were dewaxed and rehydrated. After antigen retrieval, ISH with probes targeting circSPECC1 (left lane) and IF staining with ATG4B antibody (right lane) was performed respectively. Images were captured by microscopy system and quantitatively scored using image pro plus. Scale bar: 200 μm. *p < 0.05, ***p < 0.001 and ****p < 0.0001.
Figure 10.
Figure 10.
Graphical illustration. The circSPECC1 promotes the proteasome-dependent degradation of ATG4B via facilitating the assembly of ATG4B-RNF5 complex, weakening the autophagic flux and promoting anoikis consequently. However, the abnormally increased ELAVL1 in GC cells inhibits the expression of circSPECC1, impairing the inhibitory role of circSPECC1 in gastric cancer metastasis.

Comment in

Similar articles

Cited by

References

    1. Park HJ, Ahn JY, Jung HY, et al. Clinical characteristics and outcomes of gastric cancer patients aged over 80 years: a retrospective case-control study. PLoS One. 2016;11(12):e0167615. doi: 10.1371/journal.pone.0167615 - DOI - PMC - PubMed
    1. Siegel RL, Miller KD, Fuchs HE, et al. Cancer statistics, 2022. CA Cancer J Clin. 2022;72(1):7–33. doi: 10.3322/caac.21708 - DOI - PubMed
    1. Wu C, Li M, Meng H, et al. Analysis of status and countermeasures of cancer incidence and mortality in China. Sci China Life Sci. 2019;62(5):640–647. doi: 10.1007/s11427-018-9461-5 - DOI - PubMed
    1. Massague J, Obenauf AC.. Metastatic colonization by circulating tumour cells. Nature. 2016;529(7586):298–306. doi: 10.1038/nature17038 - DOI - PMC - PubMed
    1. Gilmore AP. Anoikis. Cell Death Differ. 2005;12 Suppl 2(S2):1473–1477. doi: 10.1038/sj.cdd.4401723 - DOI - PubMed

Publication types