

SARS-CoV-2 infection among physicians over time in Ontario, Canada: a population-based retrospective cohort study
- PMID: 38433510
- PMCID: PMC10915769
- DOI: 10.3325/cmj.2024.65.30
SARS-CoV-2 infection among physicians over time in Ontario, Canada: a population-based retrospective cohort study
Abstract
Aim: To assess this risk of SARS-CoV-2 infection among Ontario physicians by specialty and in comparison with non-physician controls during the COVID-19 pandemic.
Methods: In this retrospective cohort study, the primary outcome was incident SARS-CoV-2 infection confirmed by polymerase chain reaction (PCR). Secondary outcomes were hospitalization, use of critical care, and mortality.
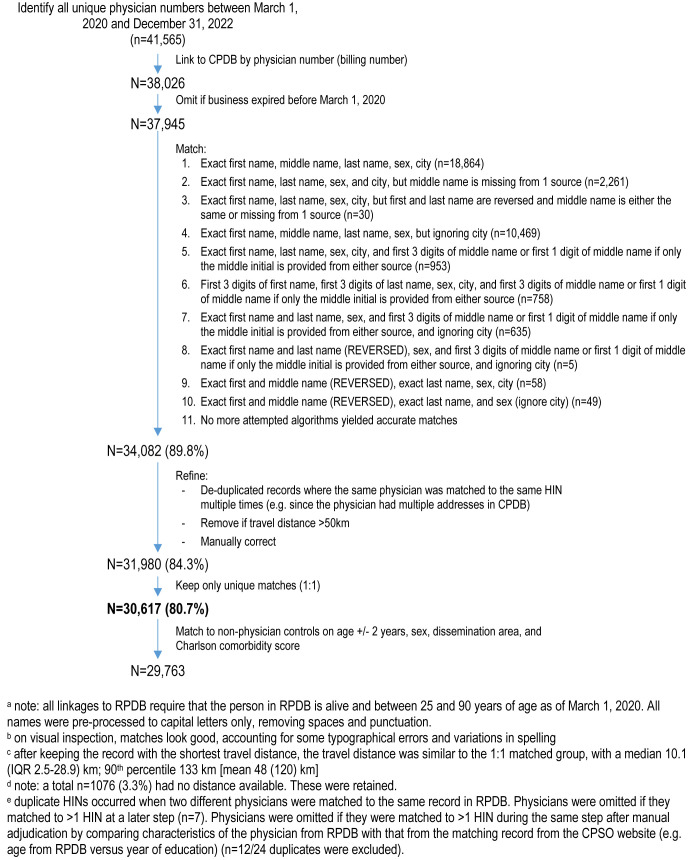
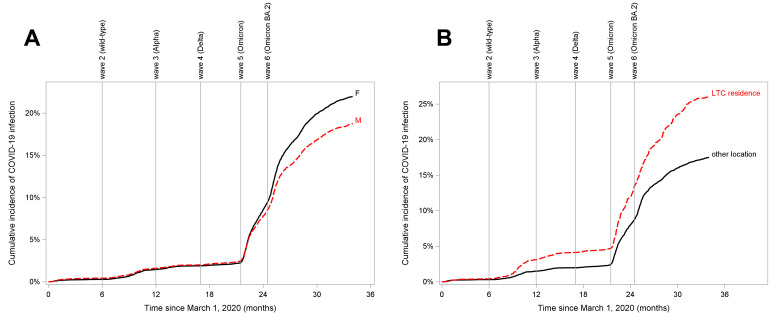
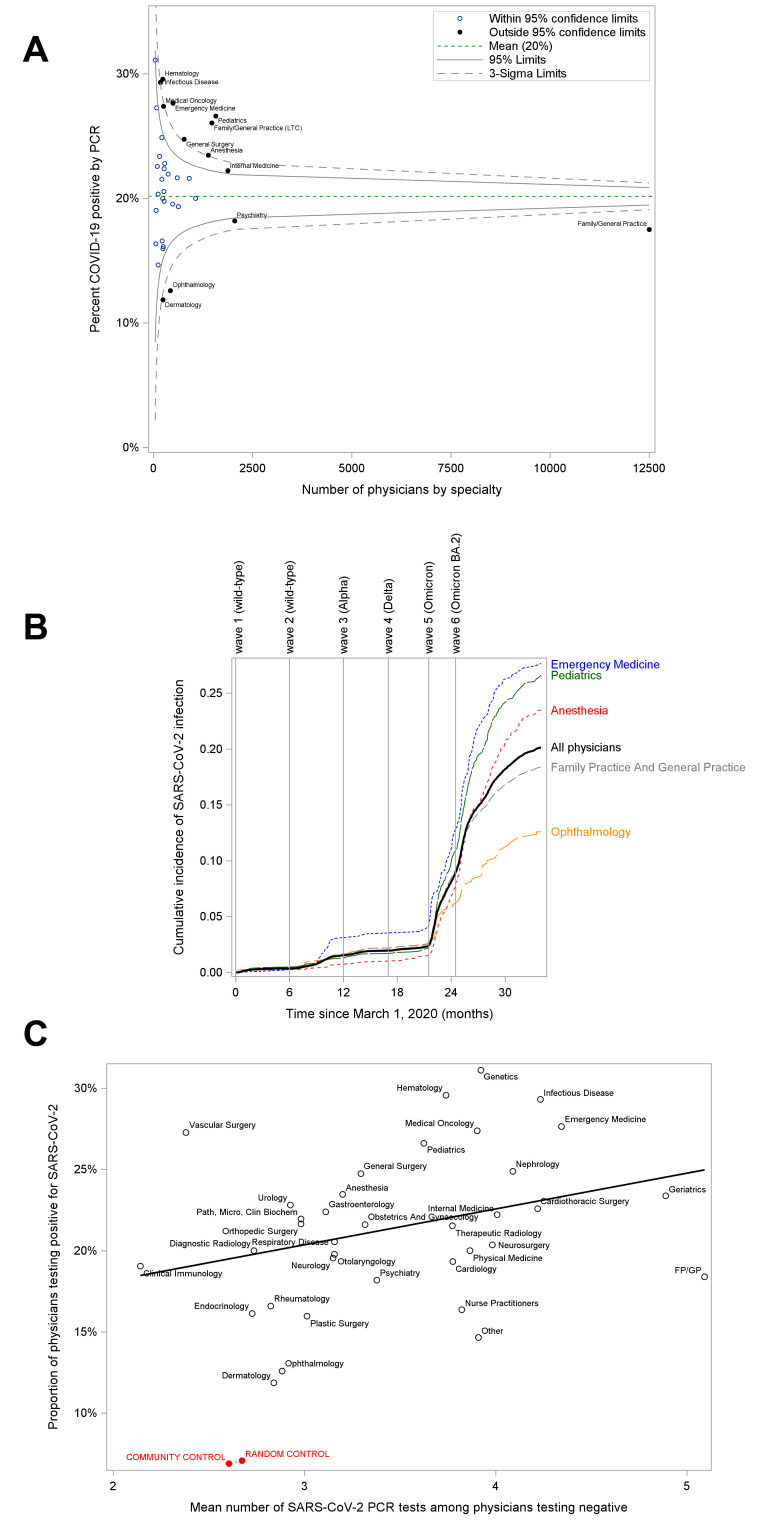
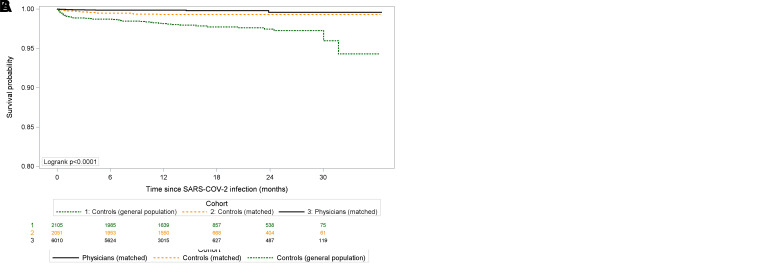
Results: From March 1, 2020 to December 31, 2022, 6172/30 617 (20%) active Ontario physicians tested positive for SARS-CoV-2. Infection was less likely if physicians were older (OR 0.78 [0.76-0.81] per 10 years), rural residents (OR 0.70 [0.59-0.83]), and lived in more marginalized neighborhoods (OR 0.74 [0.62-0.89]), but more likely if they were female (OR 1.14 [1.07-1.22]), worked in long-term care settings (OR 1.16 [1.02-1.32]), had higher patient volumes (OR 2.05 [1.82-2.30] for highest vs lowest), and were pediatricians (OR 1.25 [1.09-1.44]). Compared with community-matched controls (n=29 763), physicians had a higher risk of infection during the first two waves of the pandemic (OR 1.38 [1.20-1.59]) but by wave 3 the risk was no longer significantly different (OR 0.93 [0.83-1.05]). Physicians were less likely to be hospitalized within 14 days of their first positive PCR test than non-physicians (P<0.0001), but there was no difference in the use of critical care (P=0.48) or mortality (P=0.15).
Conclusion: Physicians had higher rates of infection than community-matched controls during the first two waves of the pandemic in Ontario, but not from wave 3 onward. Physicians practicing in long-term care facilities and pediatricians were more likely to test positive for SARS-CoV-2 than other physicians.
Figures
Similar articles
-
SARS-CoV-2 testing, infection and outcomes among Ontario physicians: a descriptive population-based cohort study.CMAJ Open. 2022 Jul 19;10(3):E657-E665. doi: 10.9778/cmajo.20210263. Print 2022 Jul-Sep. CMAJ Open. 2022. PMID: 35853660 Free PMC article.
-
The impact of shifting demographics, variants of concern and vaccination on outcomes during the first 3 COVID-19 waves in Alberta and Ontario: a retrospective cohort study.CMAJ Open. 2022 Apr 26;10(2):E400-E408. doi: 10.9778/cmajo.20210323. Print 2022 Apr-Jun. CMAJ Open. 2022. PMID: 35473827 Free PMC article.
-
Outcomes Among Patients Hospitalized With Non-COVID-19 Conditions Before and During the COVID-19 Pandemic in Alberta and Ontario, Canada.JAMA Netw Open. 2023 Jul 3;6(7):e2323035. doi: 10.1001/jamanetworkopen.2023.23035. JAMA Netw Open. 2023. PMID: 37436751 Free PMC article.
-
Risk factors for outbreaks of SARS-CoV-2 infection at retirement homes in Ontario, Canada: a population-level cohort study.CMAJ. 2021 May 10;193(19):E672-E680. doi: 10.1503/cmaj.202756. CMAJ. 2021. PMID: 33972220 Free PMC article.
-
Testing, infection and complication rates of COVID-19 among people with a recent history of homelessness in Ontario, Canada: a retrospective cohort study.CMAJ Open. 2021 Jan 11;9(1):E1-E9. doi: 10.9778/cmajo.20200287. Print 2021 Jan-Mar. CMAJ Open. 2021. PMID: 33436450 Free PMC article.
Cited by
-
Differential risk of healthcare workers versus the general population during outbreak, war and pandemic crises.Eur J Epidemiol. 2024 Nov;39(11):1211-1219. doi: 10.1007/s10654-024-01169-7. Epub 2024 Nov 20. Eur J Epidemiol. 2024. PMID: 39565536
References
-
- Low DE. Learning from SARS: preparing for the next disease outbreak. Washington (DC): National Academies Press (US); 2004. - PubMed
MeSH terms
LinkOut - more resources
Full Text Sources
Medical
Miscellaneous