AI-guided histopathology predicts brain metastasis in lung cancer patients
- PMID: 38433721
- PMCID: PMC11210939
- DOI: 10.1002/path.6263
AI-guided histopathology predicts brain metastasis in lung cancer patients
Abstract
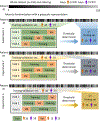
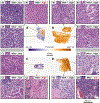
Brain metastases can occur in nearly half of patients with early and locally advanced (stage I-III) non-small cell lung cancer (NSCLC). There are no reliable histopathologic or molecular means to identify those who are likely to develop brain metastases. We sought to determine if deep learning (DL) could be applied to routine H&E-stained primary tumor tissue sections from stage I-III NSCLC patients to predict the development of brain metastasis. Diagnostic slides from 158 patients with stage I-III NSCLC followed for at least 5 years for the development of brain metastases (Met+, 65 patients) versus no progression (Met-, 93 patients) were subjected to whole-slide imaging. Three separate iterations were performed by first selecting 118 cases (45 Met+, 73 Met-) to train and validate the DL algorithm, while 40 separate cases (20 Met+, 20 Met-) were used as the test set. The DL algorithm results were compared to a blinded review by four expert pathologists. The DL-based algorithm was able to distinguish the eventual development of brain metastases with an accuracy of 87% (p < 0.0001) compared with an average of 57.3% by the four pathologists and appears to be particularly useful in predicting brain metastases in stage I patients. The DL algorithm appears to focus on a complex set of histologic features. DL-based algorithms using routine H&E-stained slides may identify patients who are likely to develop brain metastases from those who will remain disease free over extended (>5 year) follow-up and may thus be spared systemic therapy. © 2024 The Authors. The Journal of Pathology published by John Wiley & Sons Ltd on behalf of The Pathological Society of Great Britain and Ireland.
Keywords: artificial intelligence; brain metastasis; deep learning; digital pathology; non‐small cell lung cancer.
© 2024 The Authors. The Journal of Pathology published by John Wiley & Sons Ltd on behalf of The Pathological Society of Great Britain and Ireland.
Conflict of interest statement
No conflict of interest is declared.
Figures


Similar articles
-
Diagnostic Assessment of Deep Learning Algorithms for Detection of Lymph Node Metastases in Women With Breast Cancer.JAMA. 2017 Dec 12;318(22):2199-2210. doi: 10.1001/jama.2017.14585. JAMA. 2017. PMID: 29234806 Free PMC article.
-
Independent real-world application of a clinical-grade automated prostate cancer detection system.J Pathol. 2021 Jun;254(2):147-158. doi: 10.1002/path.5662. Epub 2021 Apr 27. J Pathol. 2021. PMID: 33904171 Free PMC article.
-
Development and validation of a supervised deep learning algorithm for automated whole-slide programmed death-ligand 1 tumour proportion score assessment in non-small cell lung cancer.Histopathology. 2022 Mar;80(4):635-647. doi: 10.1111/his.14571. Epub 2021 Nov 16. Histopathology. 2022. PMID: 34786761 Free PMC article.
-
Computational pathology in cancer diagnosis, prognosis, and prediction - present day and prospects.J Pathol. 2023 Aug;260(5):551-563. doi: 10.1002/path.6163. Epub 2023 Aug 14. J Pathol. 2023. PMID: 37580849 Free PMC article. Review.
-
Software-assisted decision support in digital histopathology.J Pathol. 2020 Apr;250(5):685-692. doi: 10.1002/path.5388. Epub 2020 Feb 25. J Pathol. 2020. PMID: 31994192 Review.
Cited by
-
Invasion and metastasis in cancer: molecular insights and therapeutic targets.Signal Transduct Target Ther. 2025 Feb 21;10(1):57. doi: 10.1038/s41392-025-02148-4. Signal Transduct Target Ther. 2025. PMID: 39979279 Free PMC article. Review.
-
Association of mutation profiles with metastasis in patients with non-small cell lung cancer.Front Oncol. 2024 Oct 11;14:1451576. doi: 10.3389/fonc.2024.1451576. eCollection 2024. Front Oncol. 2024. PMID: 39464712 Free PMC article.
-
Current AI technologies in cancer diagnostics and treatment.Mol Cancer. 2025 Jun 2;24(1):159. doi: 10.1186/s12943-025-02369-9. Mol Cancer. 2025. PMID: 40457408 Free PMC article. Review.
-
Artificial intelligence in lung cancer: current applications, future perspectives, and challenges.Front Oncol. 2024 Dec 23;14:1486310. doi: 10.3389/fonc.2024.1486310. eCollection 2024. Front Oncol. 2024. PMID: 39763611 Free PMC article. Review.
-
Impact of Stain Variation and Color Normalization for Prognostic Predictions in Pathology.ArXiv [Preprint]. 2024 Sep 12:arXiv:2409.08338v1. ArXiv. 2024. Update in: Sci Rep. 2025 Jan 18;15(1):2369. doi: 10.1038/s41598-024-83267-w. PMID: 39314500 Free PMC article. Updated. Preprint.
References
-
- Wood SL, Pernemalm M, Crosbie PA, et al. The role of the tumor-microenvironment in lung cancer-metastasis and its relationship to potential therapeutic targets. Cancer Treat Rev 2014; 40: 558–566. - PubMed
-
- Waqar SN, Morgensztern D, Govindan R. Systemic Treatment of Brain Metastases. Hematol Oncol Clin North Am 2017; 31: 157–176. - PubMed
Publication types
MeSH terms
Grants and funding
LinkOut - more resources
Full Text Sources
Other Literature Sources
Medical
Miscellaneous

