. 2024 Feb 9;27(3):109166.
doi: 10.1016/j.isci.2024.109166. eCollection 2024 Mar 15.

Homozygous ALS-linked mutations in TARDBP/TDP-43 lead to hypoactivity and synaptic abnormalities in human iPSC-derived motor neurons

Affiliations

Homozygous ALS-linked mutations in TARDBP/TDP-43 lead to hypoactivity and synaptic abnormalities in human iPSC-derived motor neurons

Sarah Lépine et al. iScience. .

Abstract

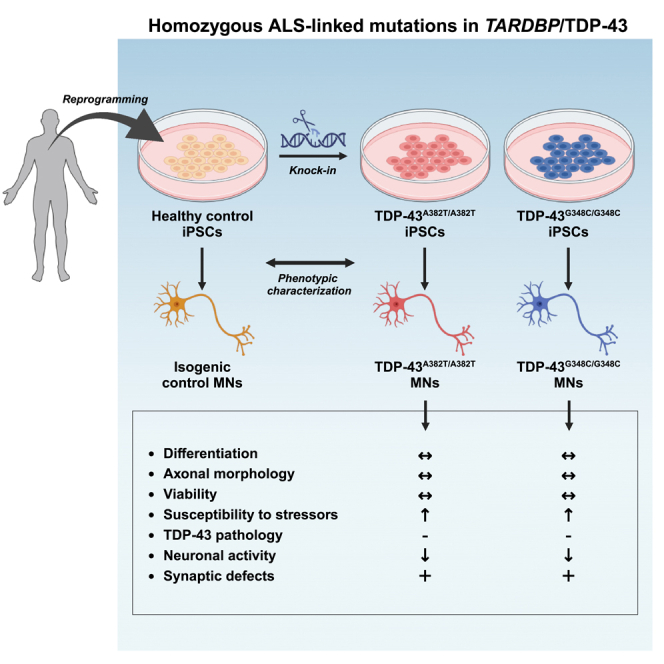
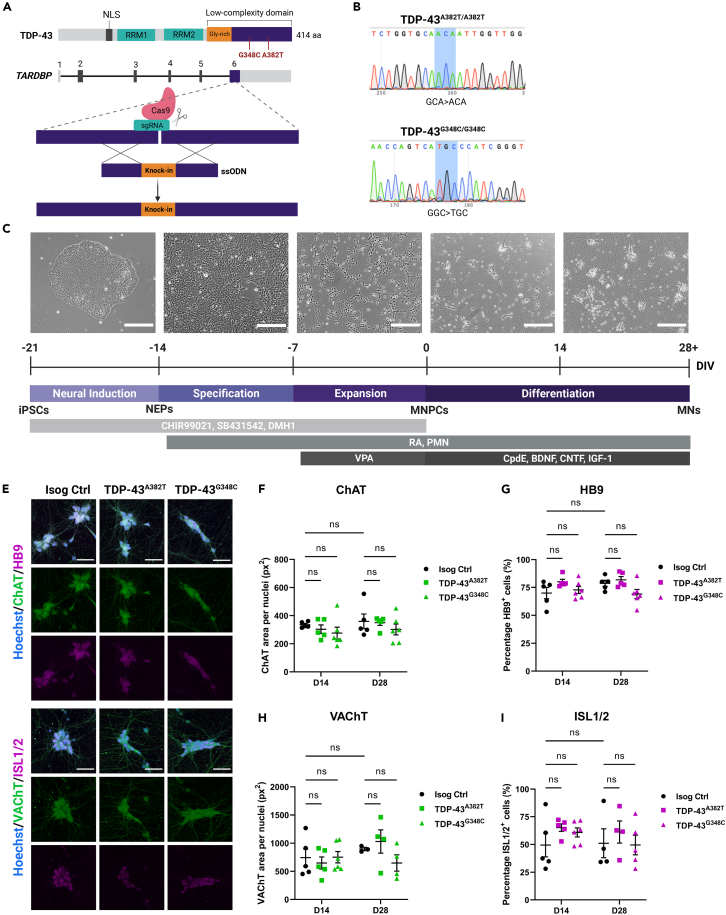
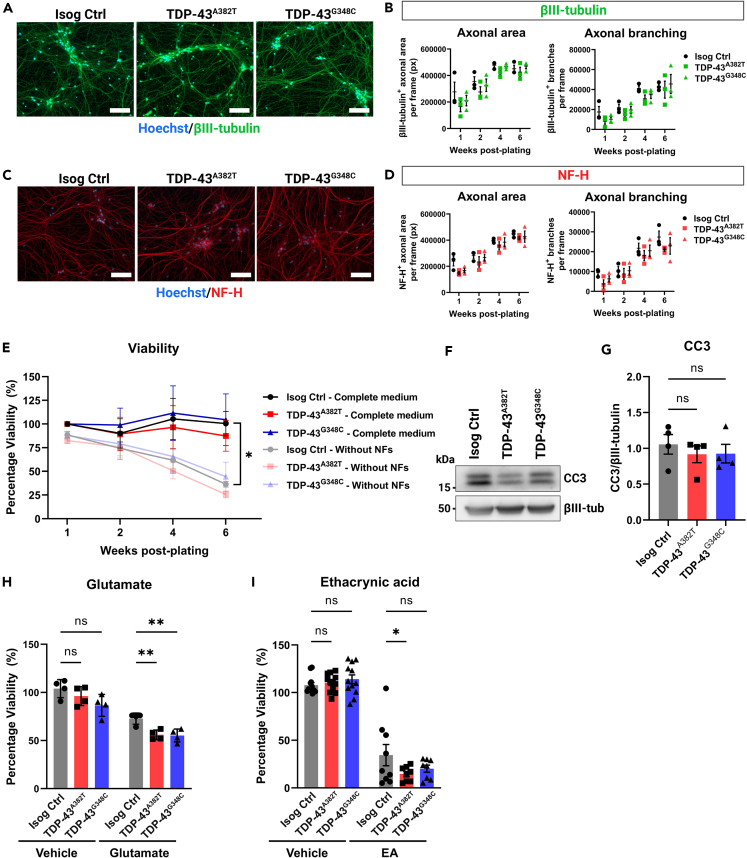
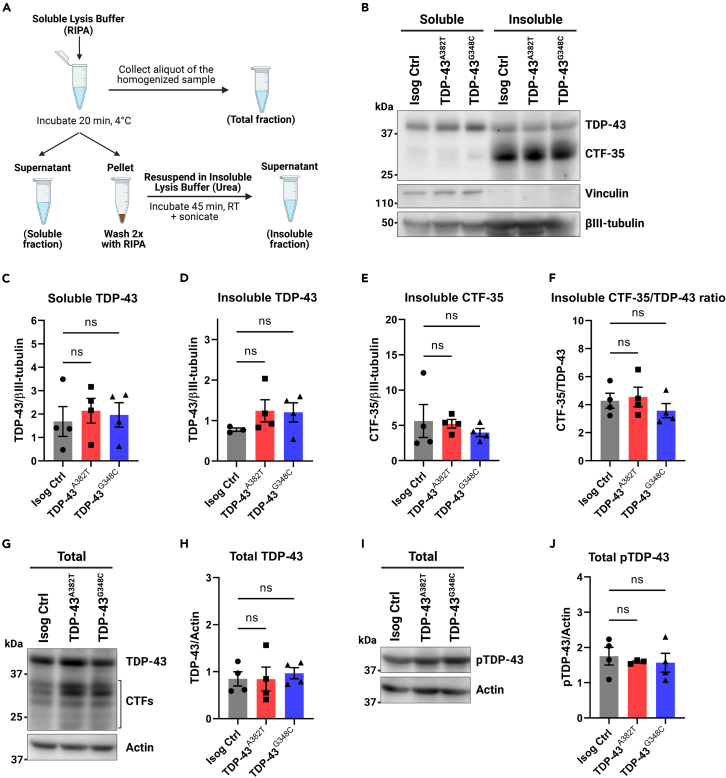
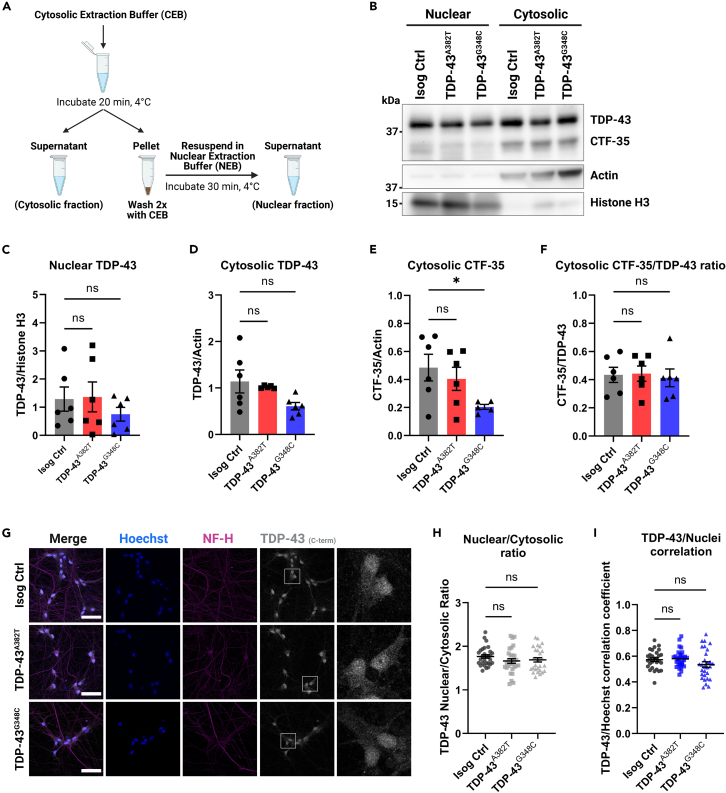
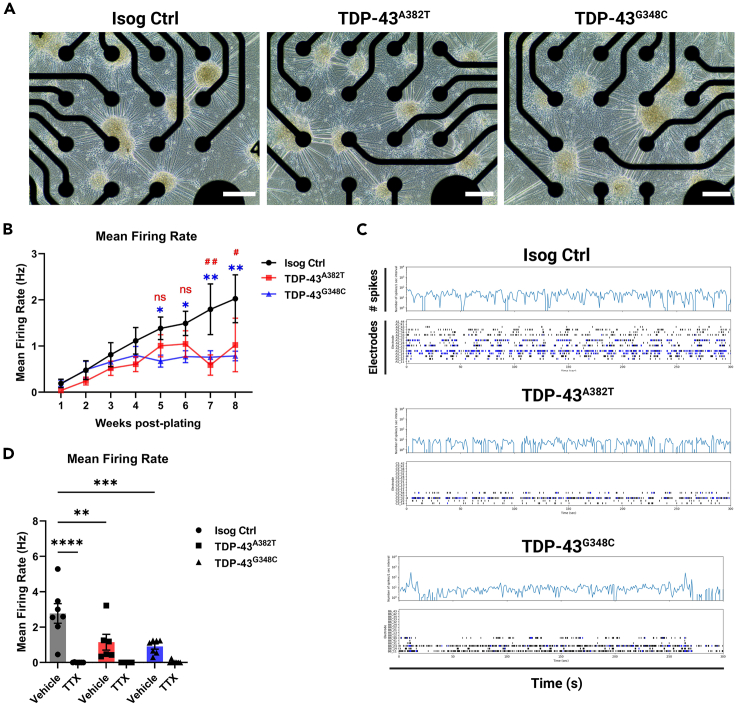
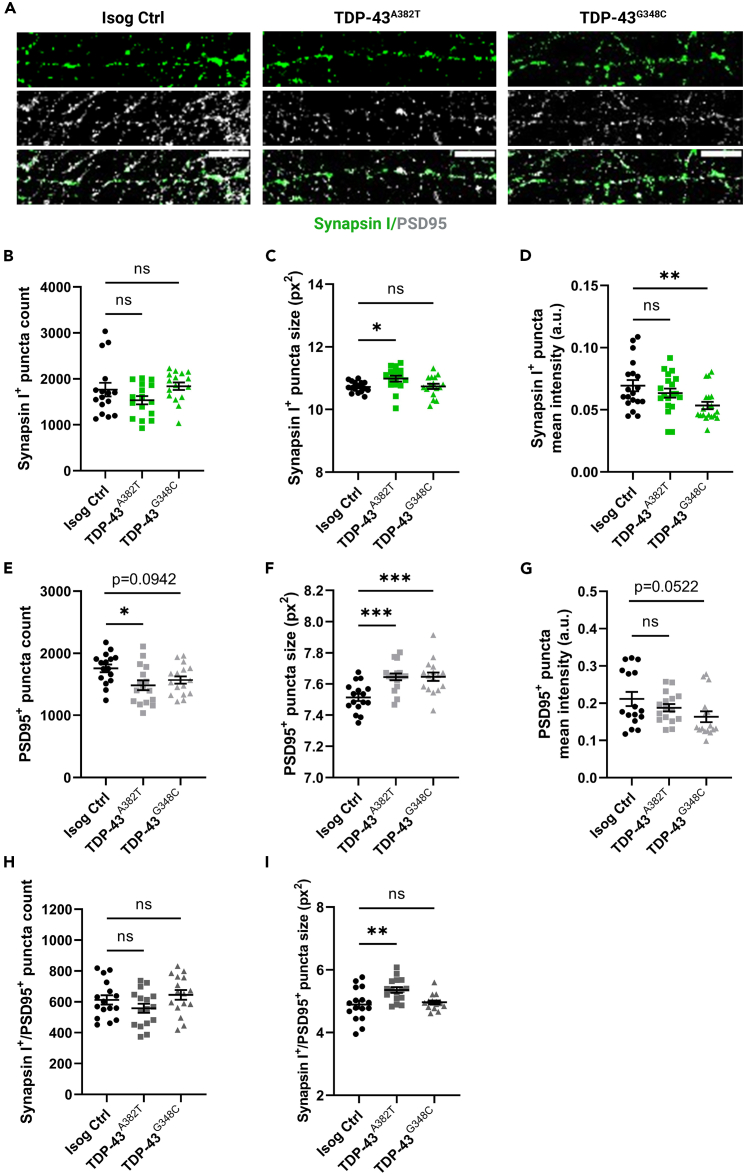
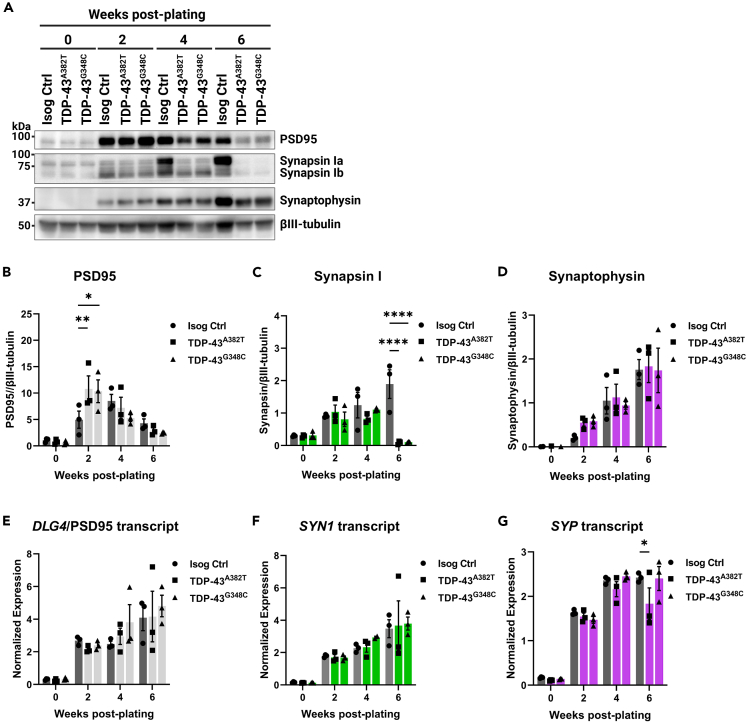
Cytoplasmic mislocalization and aggregation of the RNA-binding protein TDP-43 is a pathological hallmark of the motor neuron (MN) disease amyotrophic lateral sclerosis (ALS). Furthermore, while mutations in TARDBP (encoding TDP-43) have been associated with ALS, the pathogenic consequences of these mutations remain poorly understood. Using CRISPR-Cas9, we engineered two homozygous knock-in induced pluripotent stem cell lines carrying mutations in TARDBP encoding TDP-43A382T and TDP-43G348C, two common yet understudied ALS TDP-43 variants. Motor neurons (MNs) differentiated from knock-in iPSCs had normal viability and displayed no significant changes in TDP-43 subcellular localization, phosphorylation, solubility, or aggregation compared with isogenic control MNs. However, our results highlight synaptic impairments in both TDP-43A382T and TDP-43G348C MN cultures, as reflected in synapse abnormalities and alterations in spontaneous neuronal activity. Collectively, our findings suggest that MN dysfunction may precede the occurrence of TDP-43 pathology and neurodegeneration in ALS and further implicate synaptic and excitability defects in the pathobiology of this disease.

Keywords: Cellular neuroscience; Molecular neuroscience.


Conflict of interest statement

The authors declare no competing interests.

Figures

None
Graphical abstract
Figure 1
Figure 1
Generation of TARDBP knock-in iPSC lines and differentiation into MNs (A) Schematic representation of CRISPR-Cas9-mediated genome editing via homology-directed repair. (B) iPSC lines genotyping using Sanger sequencing. (C) Schematic representation of the protocol for sequential differentiation of iPSCs into neuroepithelial progenitors (NEPs), MNPCs, and MNs with representative phase-contrast images of cells along differentiation. Scale bar, 250 μm. For time-lapse movie depicting maturation of MNPCs into MNs, see Video S1. (E–I) Representative images (E) and quantification (F–I) of MNs differentiated for 2 weeks (D14) and 4 weeks (D28) subjected to immunocytochemistry for the common MN markers HB9, ISL1/2, ChAT and VAChT. Scale bar, 50 μm. Data shown as mean ± SEM. Two-way ANOVA. n = 5 independent experiments. See also Figures S1–S4.
Figure 2
Figure 2
TDP-43 MN cultures form a normal axonal network and maintain viability (A and C) Representative images of MNs differentiated for 6 weeks subjected to immunocytochemistry for neuronal markers βIII-tubulin (A) and NF-H (C). Scale bar, 100 μm. (B and D) Quantification of total area and number of branches of βIII-tubulin+ axons (B) and NF-H+ axons (D). n = 3 independent experiments. Two-way ANOVA. (E) Viability of MN cultures differentiated with and without neurotrophic factors (NF) supplementation over a span of 6 weeks post-plating. n = 4 independent experiments. Two-way ANOVA. (F–G) Immunoblot (F) and quantification (G) of cleaved caspase 3 (CC3) levels. βIII-tubulin was used as loading control. Extractions were performed in MNs harvested after 6 weeks post-plating. n = 4 independent experiments. Ordinary one-way ANOVA. (H) Effect of glutamate treatment (0.1 mM glutamate, 24 h) on viability of MNs differentiated for 4 weeks n = 4 independent experiments. Two-way ANOVA. (I) Effect of ethacrynic acid treatment (50 μM EA, 17 h) on viability of MNs differentiated for 4 weeks. Individual points represent per-well values from 3 independent experiments. Two-way ANOVA. All data shown as mean ± SEM. ∗p < 0.05, ∗∗p < 0.01, ∗∗∗p < 0.001. See also Figures S3 and S4.
Figure 3
Figure 3
Quantification of TDP-43 levels in total, soluble, and insoluble protein fractions (A) Schematics representing the fractionation workflow into total (unfractionated), soluble (RIPA), and insoluble (urea) protein fractions. (B–F) Immunoblot (B) and quantification of TDP-43 (C and D) and C-terminal fragment of 35 kDa (CTF-35) (E and F) levels in soluble and insoluble fractions. Vinculin (soluble) and βIII-tubulin were used as fractionation and loading controls, respectively. (G–J) Immunoblot (G and I) and quantification of total levels of TDP-43 (H) and phosphorylated TDP-43 (Ser409/410) (J) in unfractionated lysates. Actin was used as loading control. All data shown as mean ± SEM. Extractions were performed in MNs harvested after 6 weeks post-plating. n = 4 independent experiments. Ordinary one-way ANOVA. See also Figure S5.
Figure 4
Figure 4
Subcellular distribution of TDP-43 in MNs (A) Schematics representing the fractionation workflow into nuclear and cytosolic fractions. (B–F) Immunoblot of nuclear and cytosolic fractions (B) and quantification of nuclear (C) and cytosolic (D) TDP-43 levels, and cytosolic C-terminal fragment of 35 kDa (CTF-35) levels (E and F). Histone H3 (nuclear marker) and actin (cytosolic marker) were used as both loading and fractionation controls. n = 6 extractions from 4 independent differentiations. Pooled data from MNs harvested 4- and 6-week post-plating. (G) Representative images of MNs differentiated for 6 weeks subjected to immunocytochemistry for TDP-43 (C-terminal antibody) and NF-H. Scale bar, 50 μm. (H and I) Quantification of TDP-43 distribution using the nuclear/cytosolic ratio of TDP-43 fluorescence signal intensity (H) and the TDP-43/Hoechst correlation coefficient (I). Individual data points represent per-frame mean values from 5 independent experiments. All data shown as mean ± SEM. ∗p < 0.05. Ordinary one-way ANOVA. See also Figure S6.
Figure 5
Figure 5
TDP-43 MNs show progressive alterations in spontaneous neuronal activity (A) Representative phase-contrast images of MNs differentiated for 6 weeks on 24-well MEA plates. Scale bar, 250 μm. (B) Longitudinal changes in mean firing rate of MNs recorded weekly over a span of 8 weeks post-plating. n = 11 independent experiments. (C) Spontaneous neuronal activity of MN cultures differentiated for 6 weeks recorded for 300 s shown as raster plot and spike histogram. Individual spikes are shown in black and bursts are shown in blue. (D) Effect of TTX treatment on mean firing rate in MNs differentiated for 6 weeks n = 7 independent experiments. All data shown as mean ± SEM. ∗p < 0.05, ∗∗p < 0.01, ∗∗∗p < 0.001, ∗∗∗∗p < 0.0001. Two-way ANOVA. See also Figure S7.
Figure 6
Figure 6
TDP-43 MNs exhibit pre- and postsynaptic abnormalities (A) Representative images of 6 weeks post-plating MN neurites subjected to immunocytochemistry for synapsin I and PSD95. Scale bar, 10 μm. (B–D) Quantification of the average number (B), size (C), and intensity (D) of synapsin I+ puncta. (E–G) Quantification of the average number (E), size (F), and intensity (G) of PSD95+ puncta. (H and I) Quantification of the average number (H), and size (I) of synapsin I+/PSD95+ puncta. Individual points represent per-frame values from 3 independent experiments. All data shown as mean ± SEM. ∗p < 0.05, ∗∗p < 0.01, ∗∗∗p < 0.001. Ordinary one-way ANOVA.
Figure 7
Figure 7
TDP-43 variants lead to decreased synapsin I protein levels but not SYN1 transcript levels (A–D) Immunoblot (A) and quantification of protein levels of PSD95 (B), synapsin I (C), and synaptophysin (D) in MNPCs and MNs harvested after 2, 4, and 6 weeks of differentiation. βIII-tubulin was used as loading control. (E–G) Longitudinal quantification of relative transcript levels of DLG4 (encoding PSD95) (E), SYN1 (F), and SYP (G) using qPCR. All data shown as mean ± SEM. ∗p < 0.05, ∗∗p < 0.01, ∗∗∗p < 0.001, ∗∗∗∗p < 0.0001. Two-way ANOVA. n = 3 independent experiments.

Similar articles

Cited by

References

    1. Moura M.C., Novaes M.R.C.G., Eduardo E.J., Zago Y.S.S.P., Freitas R.D.N.B., Casulari L.A. Prognostic factors in amyotrophic lateral sclerosis: A population-based study. PLoS One. 2015;10 doi: 10.1371/journal.pone.0141500. - DOI - PMC - PubMed
    1. Kenna K.P., McLaughlin R.L., Byrne S., Elamin M., Heverin M., Kenny E.M., Cormican P., Morris D.W., Donaghy C.G., Bradley D.G., Hardiman O. Delineating the genetic heterogeneity of ALS using targeted high-throughput sequencing. J. Med. Genet. 2013;50:776–783. doi: 10.1136/jmedgenet-2013-101795. - DOI - PMC - PubMed
    1. Zou Z.-Y., Zhou Z.-R., Che C.-H., Liu C.-Y., He R.-L., Huang H.-P. Genetic epidemiology of amyotrophic lateral sclerosis: a systematic review and meta-analysis. J. Neurol. Neurosurg. Psychiatry. 2017;88:540–549. doi: 10.1136/jnnp-2016-315018. - DOI - PubMed
    1. Lill C.M., Abel O., Bertram L., Al-Chalabi A. Keeping up with genetic discoveries in amyotrophic lateral sclerosis: The ALSoD and ALSGene databases. Amyotroph. Lateral Scler. 2011;12:238–249. doi: 10.3109/17482968.2011.584629. - DOI - PubMed
    1. Abel O., Powell J.F., Andersen P.M., Al-Chalabi A. ALSoD: A user-friendly online bioinformatics tool for amyotrophic lateral sclerosis genetics. Hum. Mutat. 2012;33:1345–1351. doi: 10.1002/humu.22157. - DOI - PubMed

LinkOut - more resources