

Highly sensitive and simultaneous detection of ascorbic acid, dopamine, and uric acid using Pt@g-C3N4/N-CNTs nanocomposites
- PMID: 38433909
- PMCID: PMC10907839
- DOI: 10.1016/j.isci.2024.109241
Highly sensitive and simultaneous detection of ascorbic acid, dopamine, and uric acid using Pt@g-C3N4/N-CNTs nanocomposites
Abstract
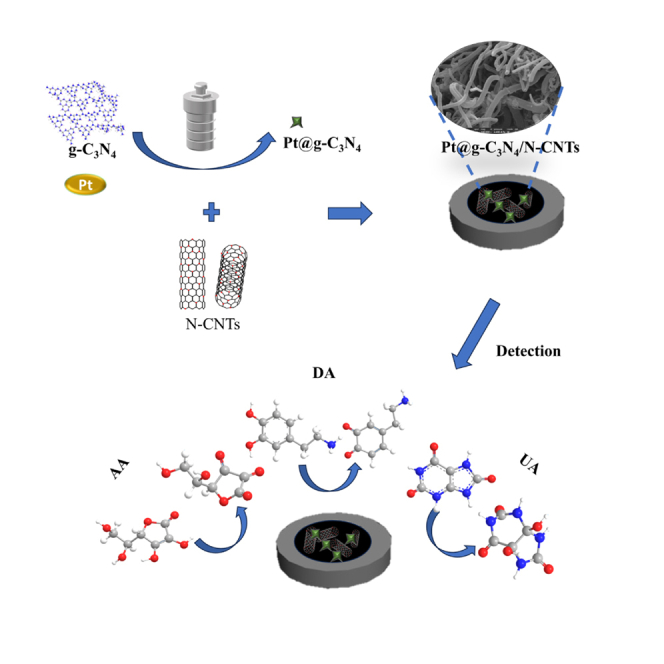
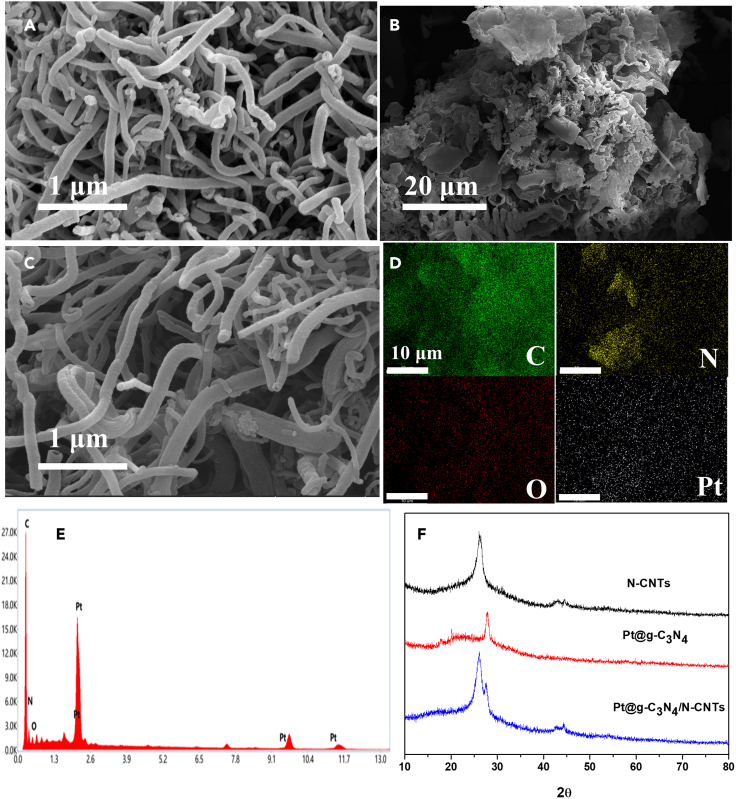
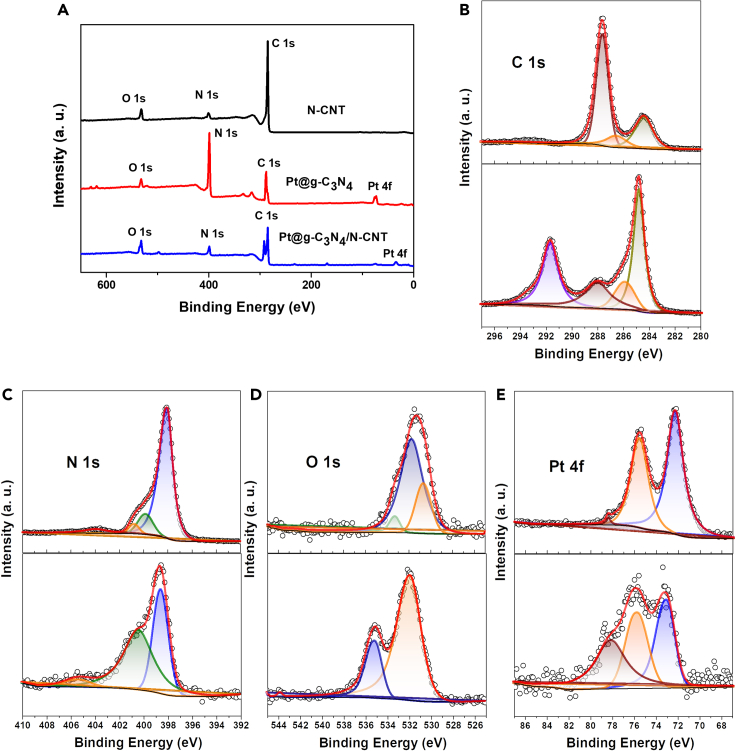
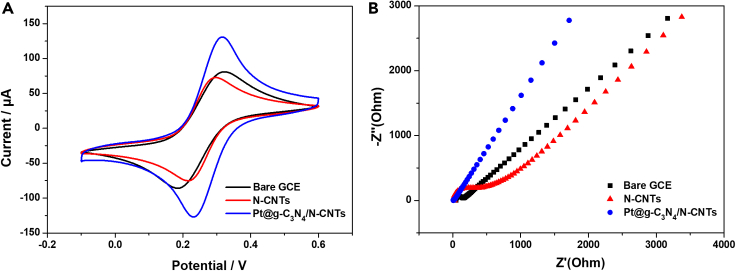
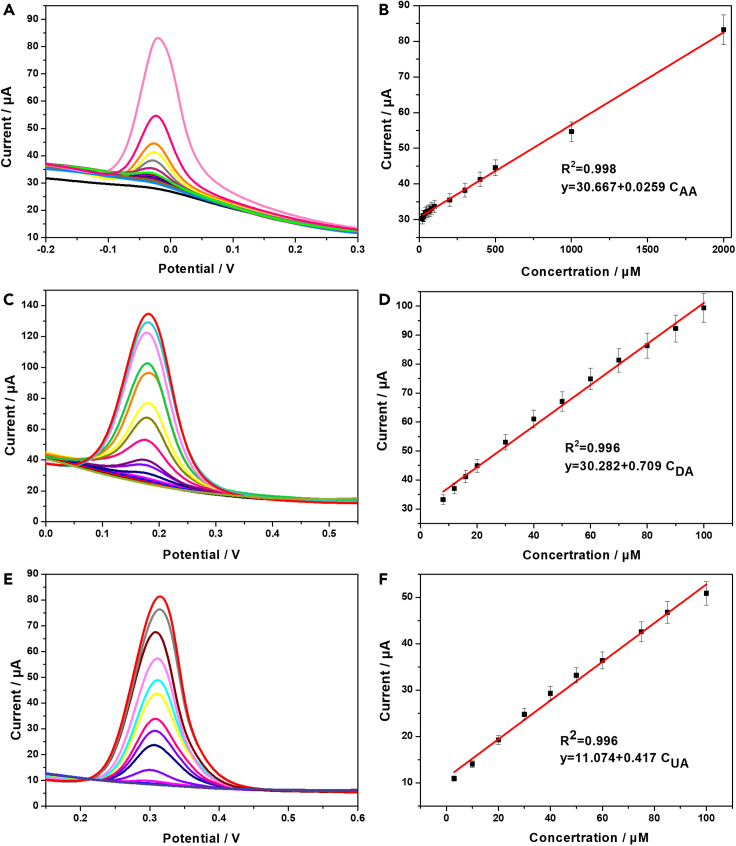
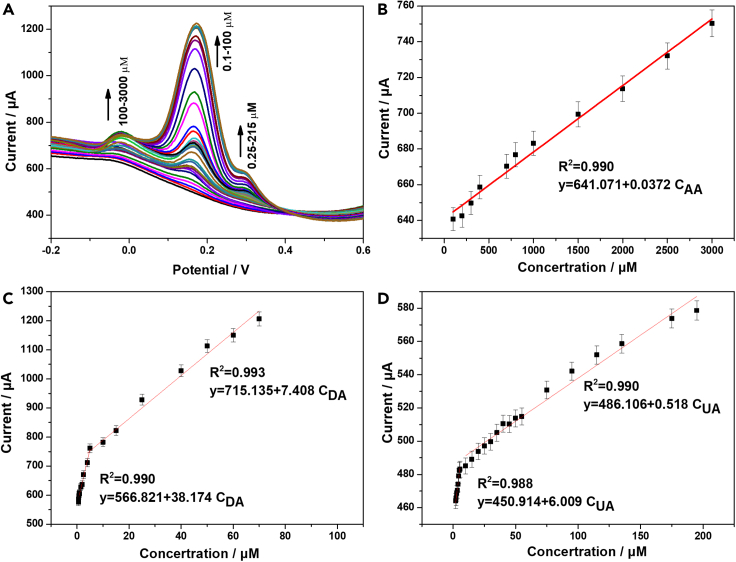
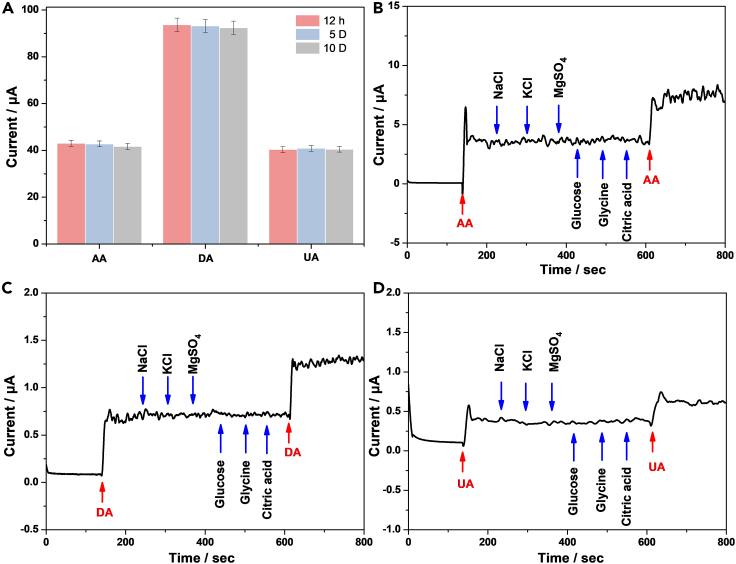
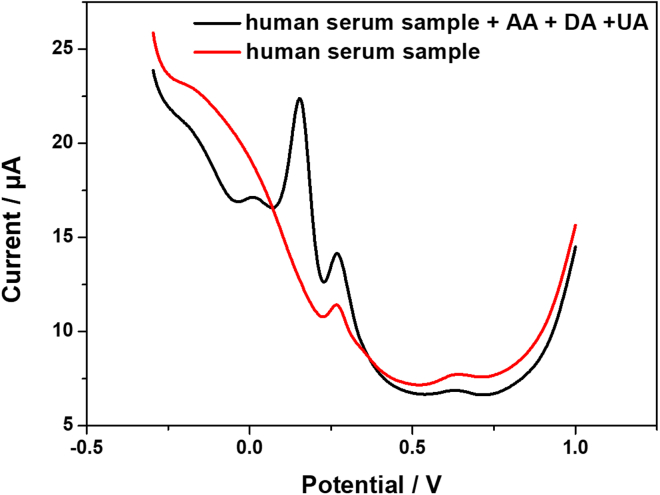
The detection of ascorbic acid (AA), dopamine (DA), and uric acid (UA) is crucial for understanding and managing various illnesses. In this research, Pt@g-C3N4 nanoparticles were synthesized via hydrothermal method and combined with N-doped carbon nanotubes (N-CNTs). The Pt@g-C3N4/N-CNTs-modified glassy carbon (GC) electrode was fabricated as an electrochemical sensor for the determination of AA, DA, and UA. The linear response range of AA, DA, and UA in the optimal condition was 100-3,000 μM, 1-100 μM, and 2-215 μM boasting a low detection limit (S/N = 3) of 29.44 μM (AA), 0.21 μM (UA), and 2.99 μM (DA), respectively. Additionally, the recoveries of AA, DA, and UA in serum sample were 100.4%-106.7%. These results corroborate the feasibility of the proposed method for the simultaneous, sensitive, and reliable detection of AA, DA, and UA. Our Pt@g-C3N4/N-CNTs/GC electrode can provide a potential strategy for disease diagnosis and health monitoring in clinical settings.
Keywords: Applied sciences; Electrochemistry; Nanomaterials; Sensor.
© 2024 The Author(s).
Conflict of interest statement
The authors declare no competing interests.
Figures
Similar articles
-
Hollow nitrogen-doped carbon microspheres pyrolyzed from self-polymerized dopamine and its application in simultaneous electrochemical determination of uric acid, ascorbic acid and dopamine.Biosens Bioelectron. 2011 Feb 15;26(6):2934-9. doi: 10.1016/j.bios.2010.11.041. Epub 2010 Dec 4. Biosens Bioelectron. 2011. PMID: 21177096
-
Three-dimensional g-C3N4/MWNTs/GO hybrid electrode as electrochemical sensor for simultaneous determination of ascorbic acid, dopamine and uric acid.Anal Chim Acta. 2022 Jun 8;1211:339907. doi: 10.1016/j.aca.2022.339907. Epub 2022 May 4. Anal Chim Acta. 2022. PMID: 35589231
-
Lithium cobalt phosphate electrode for the simultaneous determination of ascorbic acid, dopamine, and serum uric acid by differential pulse voltammetry.Mikrochim Acta. 2021 May 15;188(6):190. doi: 10.1007/s00604-021-04839-5. Mikrochim Acta. 2021. PMID: 33991256
-
A mesoporous silver-doped TiO2-SnO2 nanocomposite on g-C3N4 nanosheets and decorated with a hierarchical core-shell metal-organic framework for simultaneous voltammetric determination of ascorbic acid, dopamine and uric acid.Mikrochim Acta. 2020 Jan 2;187(1):82. doi: 10.1007/s00604-019-4045-x. Mikrochim Acta. 2020. PMID: 31897862
-
Nanomaterials-Based Nanosensors for the Simultaneous Electrochemical Determination of Biologically Important Compounds: Ascorbic Acid, Uric Acid, and Dopamine.Crit Rev Anal Chem. 2019;49(2):101-125. doi: 10.1080/10408347.2018.1489217. Epub 2018 Dec 21. Crit Rev Anal Chem. 2019. PMID: 30574792 Review.
Cited by
-
Ti3C2Tx Coated with TiO2 Nanosheets for the Simultaneous Detection of Ascorbic Acid, Dopamine and Uric Acid.Molecules. 2024 Jun 19;29(12):2915. doi: 10.3390/molecules29122915. Molecules. 2024. PMID: 38930980 Free PMC article.
-
Fluorescent EGTA-derived carbon dots for turn on-off-on detection of Fe3+ and ascorbic acid via hydrothermal synthesis and cellular imaging.Sci Rep. 2025 Jul 1;15(1):21378. doi: 10.1038/s41598-025-03845-4. Sci Rep. 2025. PMID: 40594098 Free PMC article.
References
-
- Ciobanu C.A., Ionita I., Mihailescu A.I., Ciobanu A.M. Cyclic voltammetry as a measuring tool in Parkinson’s disease and associated psychiatric commorbidities. Eur. Psychiatr. 2023;66:S757–S758. doi: 10.1192/j.eurpsy.2023.1597. - DOI
-
- Tzounakas V.L., Anastasiadi A.T., Arvaniti V.-Z., Lelli V., Fanelli G., Paronis E.C., Apostolidou A.C., Balafas E.G., Kostomitsopoulos N.G., Papageorgiou E.G., et al. Supplementation with uric and ascorbic acid protects stored red blood cells through enhancement of non-enzymatic antioxidant activity and metabolic rewiring. Redox Biol. 2022;57 doi: 10.1016/j.redox.2022.102477. - DOI - PMC - PubMed
LinkOut - more resources
Full Text Sources
Miscellaneous
