Bi-doped BaBiO3 (x = 0%, 5%, 10%, 15%, and 20%) perovskite oxides by a sol-gel method: comprehensive biological assessment and RhB photodegradation
- PMID: 38433933
- PMCID: PMC10906365
- DOI: 10.1039/d3ra06354b
Bi-doped BaBiO3 (x = 0%, 5%, 10%, 15%, and 20%) perovskite oxides by a sol-gel method: comprehensive biological assessment and RhB photodegradation
Abstract
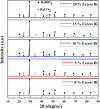
The BaBiO3 (BBO) perovskite oxide was prepared via a sol-gel method with different concentrations of Bi nitrate and examined as a photocatalyst for RhB degradation under sunlight, and its antioxidant and antibacterial activities were examined. X-ray diffraction (XRD) indicated the formation of a BaBiO3-BaCO3 (BBO-BCO) binary composite. For the degradation of RhB under solar radiation, high photocatalytic activity (73%) was observed. According to the antibacterial activity study, the addition of Bi enhanced the antibacterial activity of the resulting material against both Gram-positive and Gram-negative microorganisms. The Bi%-BBO (Bi 20%) inhibited 96.23% S. aureus. 10% Bi-BBO as an antioxidant agent had the most efficacious IC50 value of 2.50 mg mL-1. These results seem to suggest that BBO-BCO is a promising catalytic material with potential application in the fields of catalysis and medicine.
This journal is © The Royal Society of Chemistry.
Conflict of interest statement
There are no conflicts to declare.
Figures


Similar articles
-
Robust and sustainable Mg1-xCexNiyFe2-yO4 magnetic nanophotocatalysts with improved photocatalytic performance towards photodegradation of crystal violet and rhodamine B pollutants.Chemosphere. 2022 May;294:133706. doi: 10.1016/j.chemosphere.2022.133706. Epub 2022 Jan 20. Chemosphere. 2022. PMID: 35066082
-
Photocatalytic degradation of chlorazol yellow dye under sunlight irradiation using Ce, Bi, and N co-doped TiO2 photocatalyst in neutral medium.Environ Sci Pollut Res Int. 2023 Mar;30(12):35153-35169. doi: 10.1007/s11356-022-24220-0. Epub 2022 Dec 17. Environ Sci Pollut Res Int. 2023. PMID: 36527547
-
A novel bimetallic (Fe/Bi)-povidone-iodine micro-flowers composite for photocatalytic and antibacterial applications.J Photochem Photobiol B. 2021 Jun;219:112204. doi: 10.1016/j.jphotobiol.2021.112204. Epub 2021 Apr 28. J Photochem Photobiol B. 2021. PMID: 33957469
-
Revisiting the BaBiO3 semiconductor photocatalyst: synthesis, characterization, electronic structure, and photocatalytic activity.Photochem Photobiol Sci. 2021 Sep;20(9):1147-1160. doi: 10.1007/s43630-021-00086-y. Epub 2021 Aug 17. Photochem Photobiol Sci. 2021. PMID: 34403131
-
Excellent photocatalytic and antibacterial activities of bio-activated carbon decorated magnesium oxide nanoparticles.Chemosphere. 2023 Jan;312(Pt 2):137327. doi: 10.1016/j.chemosphere.2022.137327. Epub 2022 Nov 18. Chemosphere. 2023. PMID: 36410509
References
-
- Larsson S. Jansson M. Boholm Å. J. Nanopart. Res. 2019;21:1–17. - PubMed
-
- Nasrollahzadeh M. Atarod M. Sajjadi M. Sajadi S. M. Issaabadi Z. Interface Sci. Technol. 2019;28:199–322.
-
- Knell M., Nanotechnology and the Challenges of Equity, Equality and Development, 2010, pp. 127–143
-
- Linic S. Aslam U. Boerigter C. Morabito M. Nat. Mater. 2015;146:567–576. - PubMed
-
- Darabi R. Alown F. E. D. Aygun A. Gu Q. Gulbagca F. Altuner E. E. Seckin H. Meydan I. Kaymak G. Sen F. Karimi-Maleh H. Int. J. Hydrogen Energy. 2023;48:21270–21284.
LinkOut - more resources
Full Text Sources

