

Experimental and numerical analysis of the effects of thermal degradation on carbon monoxide oxidation characteristics of a three-way catalyst
- PMID: 38434079
- PMCID: PMC10906438
- DOI: 10.1016/j.heliyon.2024.e26592
Experimental and numerical analysis of the effects of thermal degradation on carbon monoxide oxidation characteristics of a three-way catalyst
Abstract
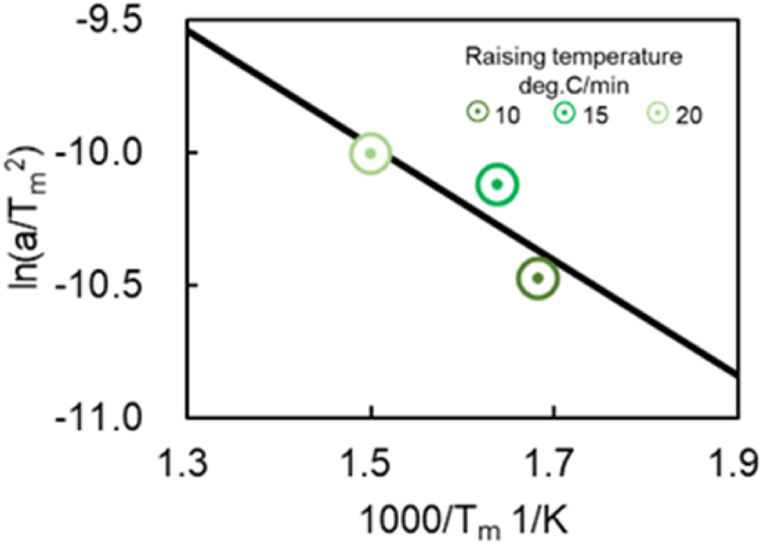
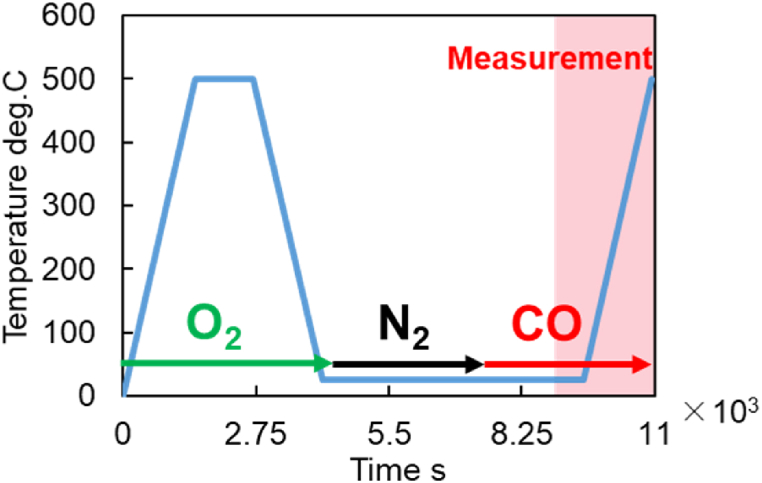
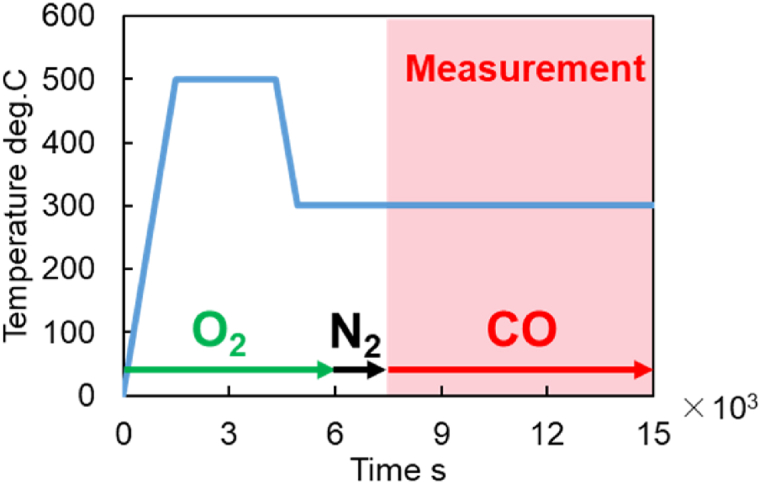
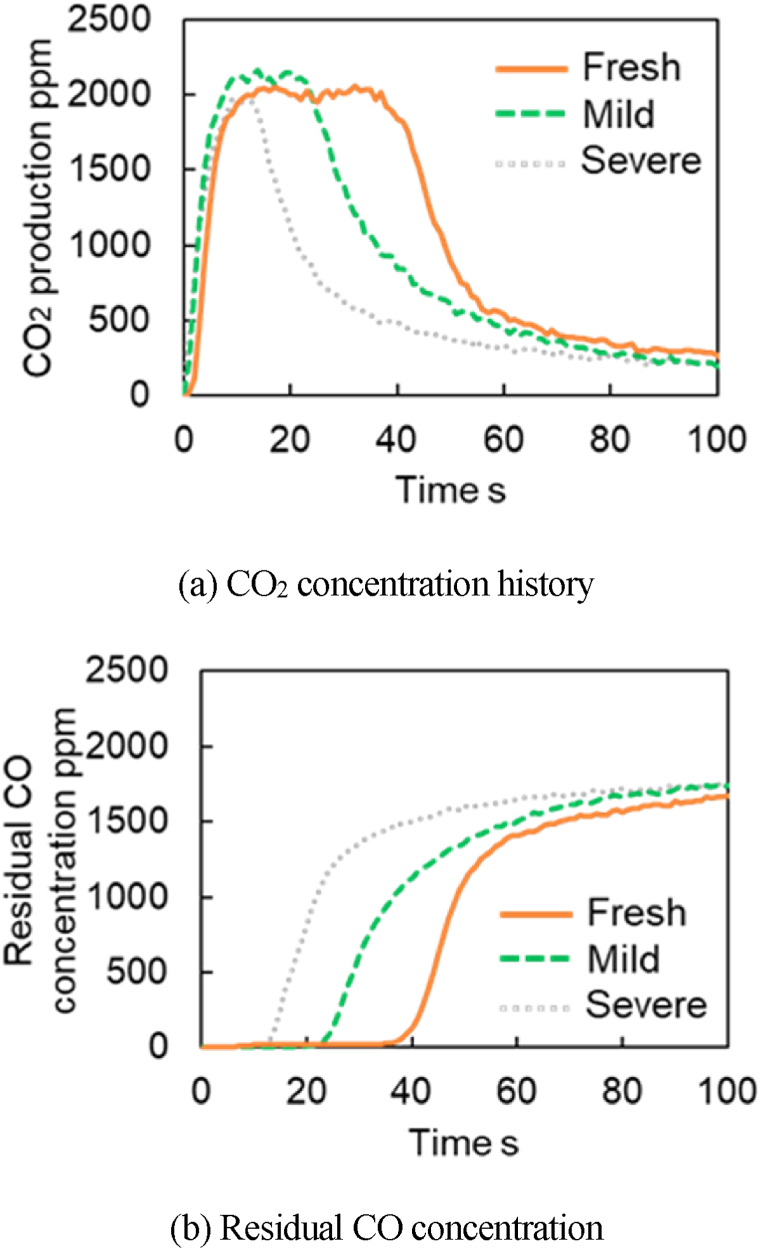
This work investigates oxygen-storage capacity (OSC) changes during thermal degradation in modern three-way catalysts. Two experiments are performed using catalysts with different degradation degrees to evaluate OSC and reaction rates. The CO2 production test, where CO and O2 are supplied at a constant temperature, shows decreased CO2 production with more degraded catalysts and reduced purification. The CO2 production test is conducted using transient temperature increases, showing that the maximum CO2 production temperature increases with catalyst degradation. The results reveal an increase in activation energy in the oxygen desorption reaction caused by thermal degradation progresses and a decrease in OSC, resulting in temperature increases in the oxygen storage reaction. In the surface reaction and mass transport model considering the 30 elementary reactions, the predicted results are well-validated for CO2 production, enabling good oxygen storage predictions based on actual data. These results can be used to predict OSC by formulating the changes in active site density and activation energy due to degradation.
Keywords: Catalyst aging; Emissions control; Gasoline engines; Modeling and simulation; Thermal degradation; Three-way catalyst.
© 2024 The Authors.
Conflict of interest statement
The authors declare that they have no known competing financial interests or personal relationships that could have appeared to influence the work reported in this paper.
Figures


References
-
- Senecal P., Leach F. Diversity in transportation: Why a mix of propulsion technologies is the way forward for the future fleet. Results Eng. 2019;4 doi: 10.1016/j.rineng.2019.100060. - DOI
-
- Japan Science and Technology Agency “Achieving Thermal efficiency of over 50% in passenger car engine” , https://www.jst.go.jp/EN/achievements/research/bt2019-04.html , accessed on 8/0January/2023.
-
- Nissan Motor Corporation, “e-POWER's internal combustion engine achieves 50% thermal efficiency”, https://www.nissan-global.com/EN/INNOVATION/TECHNOLOGY/ARCHIVE/E_POWER50/, accessed on 8/January/2023..
-
- Ratnak S., Kusaka J., Daisho Y., Yoshimura K., et al. Experiments and simulations of a lean-boost spark ignition engine for thermal efficiency improvement. SAE Int. J. Engines. 2016;9(1):379–396. doi: 10.4271/2015-32-0711. - DOI
-
- Sok R., Kusaka J., Daisho Y., Yoshimura K., Nakama K. Thermal efficiency improvement of a lean-Boosted spark ignition engine by multidimensional simulation with detailed chemical kinetics. Int. J. Automot. Technol. 2015;6(4) doi: 10.20485/jsaeijae.6.4_97. - DOI
LinkOut - more resources
Full Text Sources
