. 2023 Nov 14:6:0269.
doi: 10.34133/research.0269. eCollection 2023.

SH2B1 Tunes Hippocampal ERK Signaling to Influence Fluid Intelligence in Humans and Mice

Affiliations

SH2B1 Tunes Hippocampal ERK Signaling to Influence Fluid Intelligence in Humans and Mice

Xiujuan Du et al. Research (Wash D C). .

Abstract

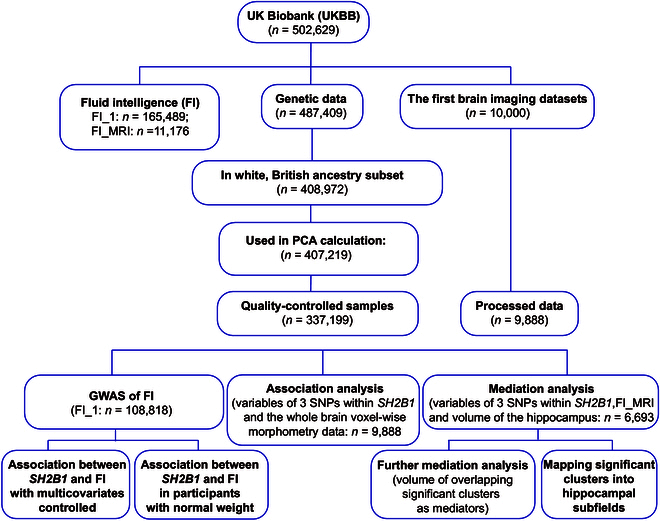
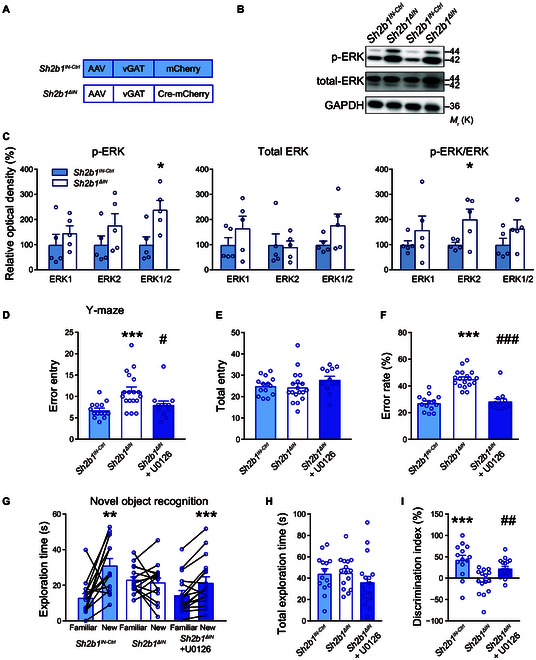
Fluid intelligence is a cognitive domain that encompasses general reasoning, pattern recognition, and problem-solving abilities independent of task-specific experience. Understanding its genetic and neural underpinnings is critical yet challenging for predicting human development, lifelong health, and well-being. One approach to address this challenge is to map the network of correlations between intelligence and other constructs. In the current study, we performed a genome-wide association study using fluid intelligence quotient scores from the UK Biobank to explore the genetic architecture of the associations between obesity risk and fluid intelligence. Our results revealed novel common genetic loci (SH2B1, TUFM, ATP2A1, and FOXO3) underlying the association between fluid intelligence and body metabolism. Surprisingly, we demonstrated that SH2B1 variation influenced fluid intelligence independently of its effects on metabolism but partially mediated its association with bilateral hippocampal volume. Consistently, selective genetic ablation of Sh2b1 in the mouse hippocampus, particularly in inhibitory neurons, but not in excitatory neurons, significantly impaired working memory, short-term novel object recognition memory, and behavioral flexibility, but not spatial learning and memory, mirroring the human intellectual performance. Single-cell genetic profiling of Sh2B1-regulated molecular pathways revealed that Sh2b1 deletion resulted in aberrantly enhanced extracellular signal-regulated kinase (ERK) signaling, whereas pharmacological inhibition of ERK signaling reversed the associated behavioral impairment. Our cross-species study thus provides unprecedented insight into the role of SH2B1 in fluid intelligence and has implications for understanding the genetic and neural underpinnings of lifelong mental health and well-being.


Conflict of interest statement

Competing interests: The authors declare that they have no competing interests.

Figures

Fig. 1.
Fig. 1.
Selection of the UKBB cohort for a study on identification of SH2B1 in fluid intelligence. Participants with all cognitive tests, genetic data, and neuroimaging data available entered the main analyses. PCA, principal component analysis; MRI, magnetic resonance imaging.
Fig. 2.
Fig. 2.
Genome-wide genetic association of FI. (A) Venn diagram showing the numbers of overlapping genes associated with TFM, BMI, and FI. (B) Venn diagram visualizing the intersections between the gene lists, showing only the top 10 genes. (C and D) The results of the GWAS. (C) An SNP-based GWAS Manhattan plot of FI, with age at baseline, sex, BMI at baseline, and 15 PCs adjusted for in the linear model. The negative log10-transformed P value (y-axis) for each SNP is plotted against the chromosomal position (x-axis). The blue line represents the genome-wide significance level at P = 5.0E−8. (D) Gene-based GWAS Manhattan plot. The red dotted line represents genome-wide significance (generated by MAGMA).
Fig. 3.
Fig. 3.
The correlations between intelligence-related SH2B1 variants and other traits. The width of the bars for each trait/SNP (rs4788102, rs7359397, and rs7498665) of SH2B1 indicates the relative significance in the genome-wide association.
Fig. 4.
Fig. 4.
Mediation results for rs4788102, rs7359397, and rs7498665 in SH2B1 in the bilateral hippocampi with BMI controlled for in the analysis. The path diagram shows the mediation model, with age at the imaging visit, sex, BMI at the imaging visit, the top 15 PCs, and the eTIV as a percentage of the cranial volume adjusted for. Significant regions (P < 0.001, 2-tailed, and 3 contiguous voxels in each of paths a, b, and a*b) mediating the correlation between rs7498665 (A), rs4788102 (B), and rs7359397 (C), respectively, and fluid intelligence scores. *P < 0.001, 2-tailed, 1,000 bootstraps.
Fig. 5.
Fig. 5.
Intelligence-related behaviors in mice are dependent on neuronal Sh2b1 expression in the hippocampus. (A) Experimental timeline. (B) Schematics of AAV injections and representative images of GFP expression in injected areas. Scale bar, 200 μm. (C and D) Representative immunoblots (C) and pooled data (D). Sh2b1+/+, n = 5; Sh2b1ΔΝ, n = 6. P = 0.0149 (*), unpaired Student’s t test. (E) Diagram of the Y-maze test. (F to H) Error entries (F), total entries (G), and error rate (%, H). Sh2b1+/+, n = 20; Sh2b1ΔΝ, n = 32. P = 0.0037 (**), 0.2535, and 0.015 (**), for (F), (G), and (H), Sh2b1+/+ versus Sh2b1ΔΝ, unpaired Student’s t test. (I) Diagrams for novel object recognition test. (J to L) Novel object recognition test. Sh2b1+/+, n = 20; Sh2b1ΔΝ, n = 32. (J) Left: Sh2b1+/+, P = 1.0E−4 (***); Right: Sh2b1ΔΝ, P = 0.3014, Familiar versus New, paired Student’s t test. (K and L) P = 0.1114 and 0.0128 (*), for (K) and (L), Sh2b1+/+ versus Sh2b1ΔΝ, unpaired Student’s t test. (M and N) Morris water maze test. (M) Percentage of time spent in the 4 quadrants during the probe trials after learning. (N) Reverse learning curve. Sh2b1+/+, n = 18; Sh2b1ΔΝ, n = 19. Two-way repeated measures ANOVA, main effect of group, F1,35 = 2.577, P = 0.1174. P = 0.0246 (*), 0.3508, 0.2751, and 0.3114, from the first to the fourth day since reverse learning, Sh2b1+/+ versus Sh2b1ΔΝ, unpaired Student’s t test.
Fig. 6.
Fig. 6.
Mice null for Sh2b1 in inhibitory neurons, but not excitatory neurons, in the hippocampus exhibit impaired intelligence-related behaviors. (A) Schematics of AAV injections. (B and C) Representative immunoblots (B) and pooled data (C). n = 5 each group. Left: P = 1.1E−3 (**), Sh2b1ΔΕΝ versus Sh2b1ΕΝ-Ctrl; Right: P = 0.0175 (*), Sh2b1ΔIΝ versus Sh2b1IΝ-Ctrl, unpaired Student’s t test. (D to F) Y-maze test. Sh2b1ΕΝ-Ctrl, n = 12; Sh2b1ΔEΝ, n = 13. Sh2b1IΝ-Ctrl, n = 13; Sh2b1ΔIΝ, n = 11. P = 0.5307, 0.9571, and 0.4031, for error entries (D), total entries (E), and error rate (%, F), respectively, Sh2b1ΔEΝ versus Sh2b1ΕΝ-Ctrl, unpaired Student’s t test. P = 3.7E−3 (**), 0.1052, and 9.0E−4 (***), for error entries (D), total entries (E), and error rate (%, F), respectively, Sh2b1ΔIΝ versus Sh2b1IΝ-Ctrl, unpaired Student’s t test. (G to I) Novel object recognition test. Sh2b1ΕΝ-Ctrl, n = 11; Sh2b1ΔEΝ, n = 11. Sh2b1IΝ-Ctrl, n = 13; Sh2b1ΔIΝ, n = 11. (G) Exploration time for each object. P = 6.5E−3 (**), 3.4E−3 (**), 2.0E−4 (***), and 0.6273, Familiar versus New, for the Sh2b1ΕΝ-Ctrl, Sh2b1ΔΕΝ, Sh2b1IΝ-Ctrl, and Sh2b1ΔIN mice, respectively, paired Student’s t test. (H) Total exploration time. P = 0.6403 and 0.8206, for Sh2b1ΕΝ-Ctrl versus Sh2b1ΔΕΝ and Sh2b1IΝ-Ctrl versus Sh2b1ΔIN, respectively, unpaired Student’s t test. (I) Discrimination index. P = 0.5120 and 1.0E−4 (***), for Sh2b1ΕΝ-Ctrl versus Sh2b1ΔΕΝ and Sh2b1IΝ-Ctrl versus Sh2b1ΔIN, respectively, unpaired Student’s t test.
Fig. 7.
Fig. 7.
Single-nucleus gene expression analysis of Sh2b1 conditional depletion in mouse hippocampal inhibitory neurons. (A) Experimental design. (B and C) UMAP visualization of 13,603 cells colored by cluster (9 major clusters, names indicated), sampled. Dots, individual cells; colors, neuron clusters. (D to G) Feature violin plot and UMAP plot show the cell-type-specific marker genes Gad1 (D and F) and Gad2 (E and G) in the inhibitory neurons. (H) Heatmap of genes with differential expression between pairwise comparison of 330 Sh2b1IN-Ctrl and 370 Sh2b1ΔIN inhibitory neuron nuclei. (I) Dot plot graph represents top GO terms enriched for differentially expressed genes in pairwise comparison of Sh2b1ΔIN versus Sh2b1IN-Ctrl inhibitory neuron nuclei for 10x Genomics.
Fig. 8.
Fig. 8.
Sh2b1 regulates intelligence through hippocampal ERK signaling. (A) Schematics of AAV injections. (B and C) Representative immunoblots (B) and pooled data (C). n = 5 each group. Left: p-ERK, P = 0.3813, 0.2518, and 0.0195 (*); Middle: total ERK, P = 0.2687, 0.8625, and 0.1297; Right: the ratio of p-ERK and total ERK, P = 0.3349, 0.0372 (*), and 0.1683, Sh2b1IΝ-Ctrl versus Sh2b1ΔIΝ, for ERK1, ERK2, and ERK1/2, respectively, unpaired Student’s t test. (D to I) Effects of pharmacological inhibition of ERK on the behavioral performance. (D to F) Y-maze test. Sh2b1IN-Ctrl, n = 14; Sh2b1ΔIΝ, n = 18; Sh2b1ΔIΝ + U0126, n = 12. (D) P = 9.0E−4 (***), Sh2b1IN-Ctrl versus Sh2b1ΔIΝ; #P = 0.0324, Sh2b1ΔIΝ versus Sh2b1ΔIΝ + U0126; (E) P = 0.8006, Sh2b1IN-Ctrl versus Sh2b1ΔIΝ; P = 0.1840, Sh2b1ΔIΝ versus Sh2b1ΔIΝ + U0126; (F) P = 4.2E−9 (***), Sh2b1IN-Ctrl versus Sh2b1ΔIΝ; P = 3.6E−7 (###), Sh2b1ΔIΝ versus Sh2b1ΔIΝ+ U0126, unpaired Student’s t test. (G to I) Novel object recognition test. Sh2b1IN-Ctrl, n = 15; Sh2b1ΔIΝ, n = 18; Sh2b1ΔIΝ + U0126, n = 17. (G) P = 3.4E−3 (**), 0.5709, and 7.0E−4 (***), Familiar versus New, for the Sh2b1IΝ-Ctrl, Sh2b1ΔIN, and Sh2b1ΔIΝ + U0126 mice, respectively, paired Student’s t test. (H) P = 0.8917 and 0.2118, for Sh2b1IΝ-Ctrl versus Sh2b1ΔIN and Sh2b1ΔIΝ versus Sh2b1ΔIΝ + U0126, respectively, unpaired Student’s t test. (I) P = 4.0E−4 (***) and 2.4E−3 (##), for Sh2b1IΝ-Ctrl versus Sh2b1ΔIN and Sh2b1ΔIΝ versus Sh2b1ΔIΝ + U0126, respectively, unpaired Student’s t test.

Similar articles

Cited by

References

    1. Deary IJ, Penke L, Johnson W. The neuroscience of human intelligence differences. Nat Rev Neurosci. 2010;11(3):201–211. - PubMed
    1. Duncan J, Chylinski D, Mitchell DJ, Bhandari A. Complexity and compositionality in fluid intelligence. Proc Natl Acad Sci U S A. 2017;114(20):5295–5299. - PMC - PubMed
    1. Davies G, Tenesa A, Payton A, Yang J, Harris SE, Liewald D, Ke X, Le Hellard, Christoforou A, Luciano M, et al. . Genome-wide association studies establish that human intelligence is highly heritable and polygenic. Mol Psychiatry. 2011;16(10):996–1005. - PMC - PubMed
    1. Bartels M, Rietveld MJ, Van Baal, Boomsma DI. Genetic and environmental influences on the development of intelligence. Behav Genet. 2002;32(4):237–249. - PubMed
    1. Wisdom NM, Callahan JL, Hawkins KA. The effects of apolipoprotein E on non-impaired cognitive functioning: A meta-analysis. Neurobiol Aging. 2011;32(1):63–74. - PubMed