

Chinese herbal decoction, Yi-Qi-Jian-Pi formula exerts anti-hepatic fibrosis effects in mouse models of CCl4-induced liver fibrosis
- PMID: 38434258
- PMCID: PMC10907526
- DOI: 10.1016/j.heliyon.2024.e26129
Chinese herbal decoction, Yi-Qi-Jian-Pi formula exerts anti-hepatic fibrosis effects in mouse models of CCl4-induced liver fibrosis
Abstract
Background: Yi-Qi-Jian-Pi Formula (YQJPF) is a herbal medicine that is used to treat patients with liver failure. However, scientific evidence supporting the treatment of hepatic fibrosis with YQJPF has not been forthcoming. The present study aimed to determine the mechanisms underlying the anti-fibrotic effects of YQJPF in mouse models of hepatic fibrosis.
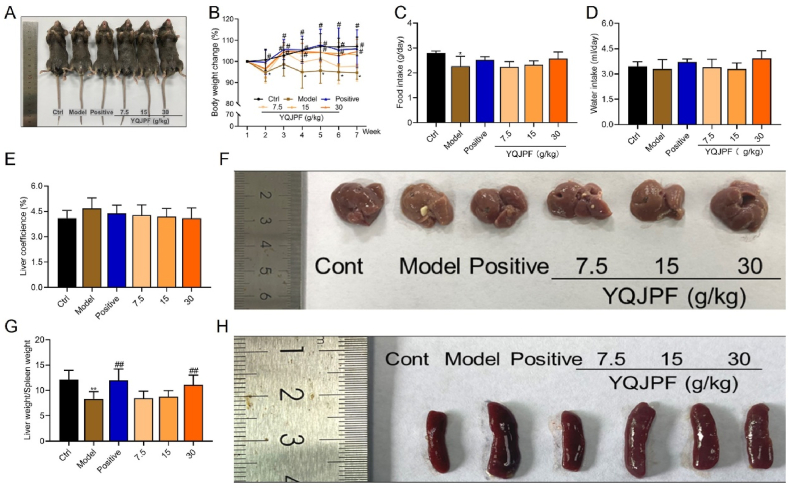
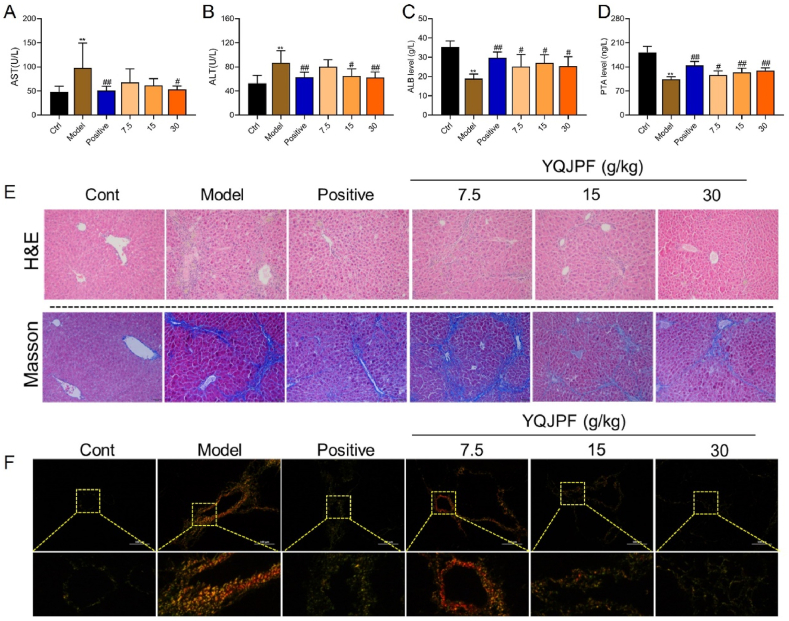
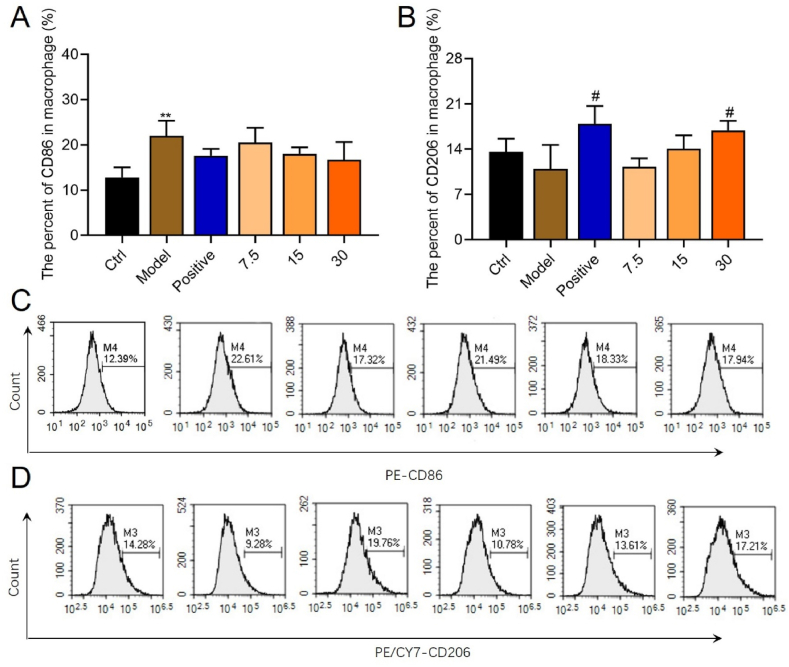
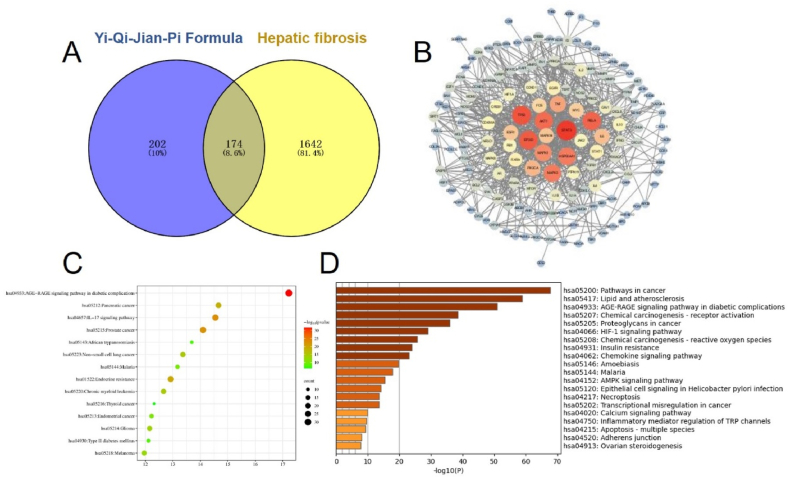
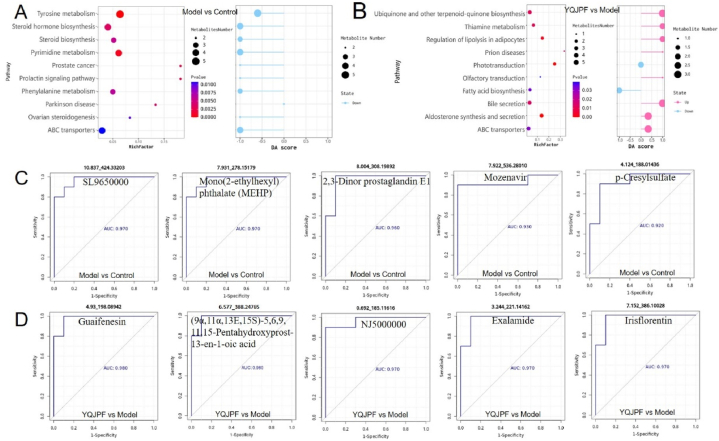
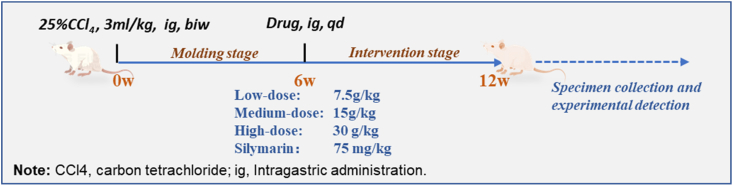
Methods: Mice were randomly assigned to control, hepatic fibrosis model, silymarin (positive treated), and low-, medium- and high-dose YQJPF (7.5, 15, and 30 g/kg, respectively) groups. Liver function, inflammatory cytokines, and oxygen stress were analyzed using ELISA kits. Sections were histopathologically stained with hematoxylin-eosin, Masson trichrome, and Sirius red. Macrophage polarization was measured by flow cytometry and immunofluorescence. Potential targets of YQJPF against hepatic fibrosis were analyzed by network pharmacology of Chinese herbal compound and the effects of YQJPF on the transforming growth factor-beta (TGF-β)/Suppressor of Mothers against Decapentaplegic family member 3 (Smad3) signaling pathway were assessed using qRT-PCR and immunohistochemical staining. Finally, metagenomics and LC-MS/MS were used to detect the intestinal flora and metabolites of the mice, and an in-depth correlation analysis was performed by spearman correlation analysis. The data were compared by one-way ANOVA and least significant differences (LSDs) or ANOVA-Dunnett's T3 method used when no homogeneity was detected.
Results: We induced hepatic fibrosis using CCl4 to establish mouse models and found that YQJPF dose-dependently increased body weight, improved liver function, and reversed hepatic fibrosis. Elevated levels of the pro-inflammatory factors IL-1β, IL-6, and TNF-α in the model mice were substantially decreased by YQJPF, particularly at the highest dose. Levels of serum malondialdehyde and superoxide dismutase (SOD) activity were elevated and reduced, respectively. The malondialdehyde concentration decreased and SOD activity increased in the high-dose group. M1 polarized macrophages (CD86) in the mouse models were significantly decreased and M2 polarization was mildly decreased without significance. However, high-dose YQJPF increased the numbers of M2 macrophages and inhibited TGF-β/Smad3 signaling. Metagenomic and non-targeted metabolomics detection results showed that YQJPF could regulate intestinal homeostasis, and Spearman correlation analysis showed that the abundance of Calditerrivibrio_nitroreducens was significantly negatively correlated with 18β-glycyrrhetinic acid. It is suggested that Calditerrivibrio_nitroreducens may reduce the anti-fibrosis effect of licorice and other Chinese herbs by digesting 18β-glycyrrhetinic acid.
Conclusions: YQJPF can reverse liver fibrosis by inhibiting inflammation, suppressing oxidative stress, regulating the immunological response initiated by macrophages, inhibiting TGF-β/Smad3 signaling and regulating intestinal flora homeostasis. Therefore, YQJPF may be included in clinical regimens to treat hepatic fibrosis.
Keywords: Hepatic fibrosis; Herbal medicine; Intestinal flora homeostasis; Network pharmacology.
© 2024 The Authors.
Conflict of interest statement
The authors declare that they have no known competing financial interests or personal relationships that could have appeared to influence the work reported in this paper.
Figures


Similar articles
-
Yi-Qi-Jian-Pi formula inhibits hepatocyte pyroptosis through the IDH2-driven tricarboxylic acid cycle to reduce liver injury in acute-on-chronic liver failure.J Ethnopharmacol. 2023 Dec 5;317:116683. doi: 10.1016/j.jep.2023.116683. Epub 2023 Jun 13. J Ethnopharmacol. 2023. PMID: 37315653
-
Yi-Qi-Jian-Pi formula modulates the PI3K/AKT signaling pathway to attenuate acute-on-chronic liver failure by suppressing hypoxic injury and apoptosis in vivo and in vitro.J Ethnopharmacol. 2021 Nov 15;280:114411. doi: 10.1016/j.jep.2021.114411. Epub 2021 Jul 12. J Ethnopharmacol. 2021. PMID: 34265380
-
Yi-Qi-Jian-Pi formula ameliorates immune function in acute-on-chronic liver failure by upregulating autophagy and mitochondrial biogenesis in CD8+ T lymphocytes.J Ethnopharmacol. 2023 May 23;308:116276. doi: 10.1016/j.jep.2023.116276. Epub 2023 Feb 17. J Ethnopharmacol. 2023. PMID: 36806340
-
Baihe Wuyao decoction ameliorates CCl4-induced chronic liver injury and liver fibrosis in mice through blocking TGF-β1/Smad2/3 signaling, anti-inflammation and anti-oxidation effects.J Ethnopharmacol. 2020 Dec 5;263:113227. doi: 10.1016/j.jep.2020.113227. Epub 2020 Aug 9. J Ethnopharmacol. 2020. PMID: 32783983
-
Advances in anti hepatic fibrotic therapy with Traditional Chinese Medicine herbal formula.J Ethnopharmacol. 2020 Apr 6;251:112442. doi: 10.1016/j.jep.2019.112442. Epub 2019 Dec 28. J Ethnopharmacol. 2020. PMID: 31891799 Review.
Cited by
-
Research and application of medicines for treating liver fibrosis: current status and prospects.Front Pharmacol. 2025 Jul 9;16:1582258. doi: 10.3389/fphar.2025.1582258. eCollection 2025. Front Pharmacol. 2025. PMID: 40703362 Free PMC article. Review.
-
Efficacy of Oroxylin A in ameliorating renal fibrosis with emphasis on Sirt1 activation and TGF-β/Smad3 pathway modulation.Front Pharmacol. 2024 Dec 2;15:1499012. doi: 10.3389/fphar.2024.1499012. eCollection 2024. Front Pharmacol. 2024. PMID: 39687299 Free PMC article.
-
The Metabolomic Footprint of Liver Fibrosis.Cells. 2024 Aug 11;13(16):1333. doi: 10.3390/cells13161333. Cells. 2024. PMID: 39195223 Free PMC article. Review.
-
Network pharmacology analysis of the Huangqi-Gancao herb pair reveals quercetin as a therapeutics for allergic rhinitis via the RELA-regulated IFNG/IRF1 axis response.Naunyn Schmiedebergs Arch Pharmacol. 2025 Feb;398(2):1597-1612. doi: 10.1007/s00210-024-03353-8. Epub 2024 Aug 12. Naunyn Schmiedebergs Arch Pharmacol. 2025. PMID: 39133272 Free PMC article.
-
Sini san regulates intestinal flora and short-chain fatty acids to ameliorate hepatocyte apoptosis and relieve CCl4-induced liver fibrosis in mice.Front Pharmacol. 2024 Aug 30;15:1408459. doi: 10.3389/fphar.2024.1408459. eCollection 2024. Front Pharmacol. 2024. PMID: 39281277 Free PMC article.
References
-
- Kisseleva T., Brenner D. Molecular and cellular mechanisms of liver fibrosis and its regression. Nat. Rev. Gastroenterol. Hepatol. 2021;18:151–166. - PubMed
LinkOut - more resources
Full Text Sources
Research Materials
Miscellaneous
