

A Comparison of Bottom-Up Proteomic Sample Preparation Methods for the Human Parasite Trichomonas vaginalis
- PMID: 38434803
- PMCID: PMC10905575
- DOI: 10.1021/acsomega.3c10040
A Comparison of Bottom-Up Proteomic Sample Preparation Methods for the Human Parasite Trichomonas vaginalis
Abstract
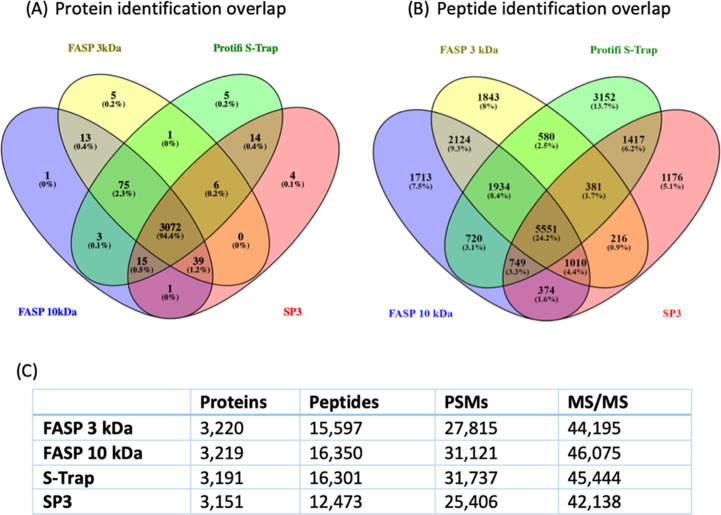
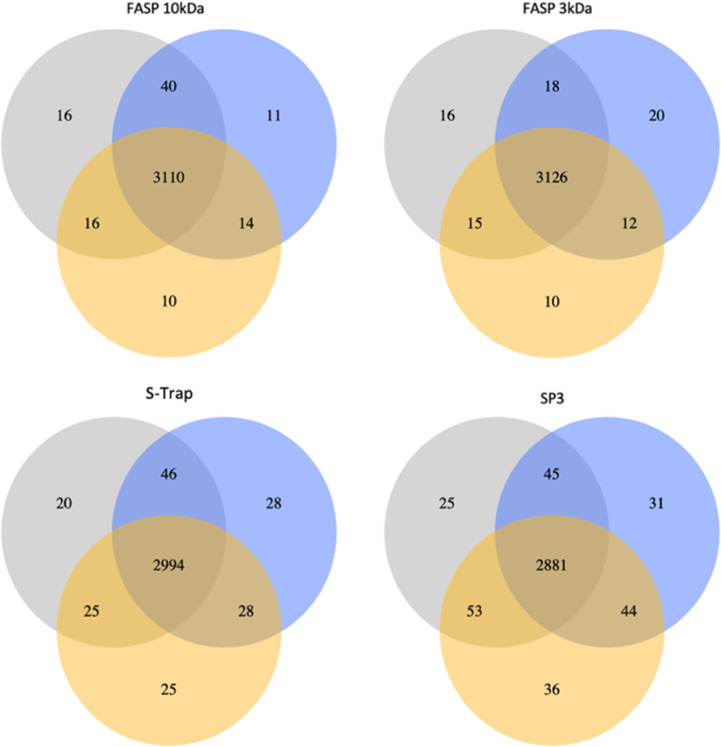
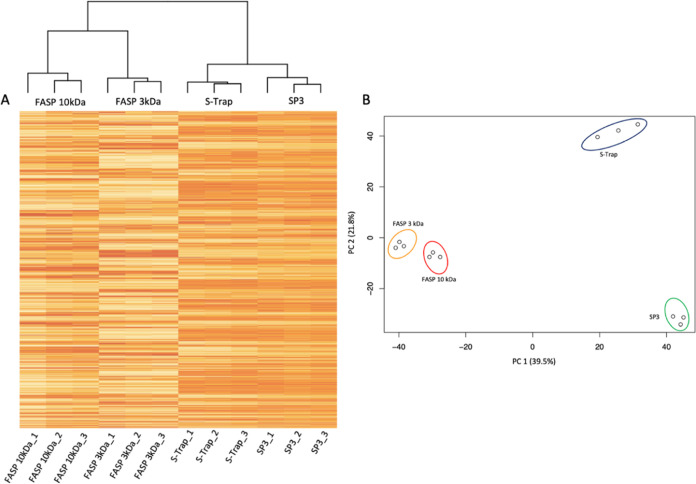
Bottom-up proteomic approaches depend on the efficient digestion of proteins into peptides for mass spectrometric analysis. Sample preparation strategies, based on magnetic beads, filter-aided systems, or in-solution digests, are commonly used for proteomic analysis. Time-intensive methods like filter-aided sample preparation (FASP) have led to the development of new, more time-efficient filter-based strategies like suspension trappings (S-Traps) or magnetic bead-based strategies like SP3. S-Traps have been reported as an alternative proteomic sample preparation method as they allow for high sodium dodecyl sulfate (SDS) concentrations to be present in the sample. In this study, we compare the efficiency of different protocols for FASP, SP3, and S-Trap-based digestion of proteins after extraction from Trichomonas vaginalis. Overall, we found a high number of protein IDs for all tested methods and a high degree of reproducibility within each method type. However, FASP with a 3 kDa cutoff filter unit outperformed the other methods analyzed, referring to the number of protein IDs. This is the first work providing the direct comparison of four different bottom-up proteomic approaches regarding the most efficient proteomic sample preparation protocol for the human parasite T. vaginalis.
© 2024 The Authors. Published by American Chemical Society.
Conflict of interest statement
The authors declare no competing financial interest.
Figures


Similar articles
-
Comparison of In-Solution, FASP, and S-Trap Based Digestion Methods for Bottom-Up Proteomic Studies.J Proteome Res. 2018 Jul 6;17(7):2480-2490. doi: 10.1021/acs.jproteome.8b00235. Epub 2018 May 24. J Proteome Res. 2018. PMID: 29754492 Free PMC article.
-
SP3 Protocol for Proteomic Plant Sample Preparation Prior LC-MS/MS.Front Plant Sci. 2021 Mar 10;12:635550. doi: 10.3389/fpls.2021.635550. eCollection 2021. Front Plant Sci. 2021. PMID: 33777071 Free PMC article.
-
Ecological Monitoring and Omics: A Comprehensive Comparison of Workflows for Mass Spectrometry-Based Quantitative Proteomics of Fish (Labeo rohita) Liver Tissue.OMICS. 2022 Sep;26(9):489-503. doi: 10.1089/omi.2022.0086. Epub 2022 Aug 26. OMICS. 2022. PMID: 36036978
-
Bottom-Up Proteomics: Advancements in Sample Preparation.Int J Mol Sci. 2023 Mar 10;24(6):5350. doi: 10.3390/ijms24065350. Int J Mol Sci. 2023. PMID: 36982423 Free PMC article. Review.
-
A review of suspension trapping digestion method in bottom-up proteomics.J Sep Sci. 2022 Aug;45(16):3150-3168. doi: 10.1002/jssc.202200297. Epub 2022 Jul 11. J Sep Sci. 2022. PMID: 35770343 Review.
Cited by
-
The proteomic landscape of Toxoplasma gondii extracellular vesicles across diverse host cell types.Front Cell Infect Microbiol. 2025 Mar 18;15:1565684. doi: 10.3389/fcimb.2025.1565684. eCollection 2025. Front Cell Infect Microbiol. 2025. PMID: 40171158 Free PMC article.
-
Comparative proteomic analysis of metronidazole-sensitive and resistant Trichomonas vaginalis suggests a novel mode of metronidazole action and resistance.Int J Parasitol Drugs Drug Resist. 2024 Dec;26:100566. doi: 10.1016/j.ijpddr.2024.100566. Epub 2024 Sep 26. Int J Parasitol Drugs Drug Resist. 2024. PMID: 39368438 Free PMC article.
-
Host-specific targets of Histomonas meleagridis antigens revealed by immunoprecipitation.Sci Rep. 2025 Feb 17;15(1):5800. doi: 10.1038/s41598-025-88855-y. Sci Rep. 2025. PMID: 39962091 Free PMC article.
References
LinkOut - more resources
Full Text Sources