. 2024 Feb 17;15(7):2045-2065.
doi: 10.7150/jca.92128. eCollection 2024.

Analysis of m6A-related lncRNAs for prognostic and immunotherapeutic response in hepatocellular carcinoma

Affiliations

Analysis of m6A-related lncRNAs for prognostic and immunotherapeutic response in hepatocellular carcinoma

Xingwei Wu et al. J Cancer. .

Abstract

Background: RNA methylation modifications are important post-translational modifications that are regulated in an epigenetic manner. Recently, N6-methyladenosine (m6A) RNA modifications have emerged as potential epigenetic markers in tumor biology. Methods: Gene expression and clinicopathological data of LIHC were obtained from the cancer genome atlas (TCGA) database. The relationship between long non-coding RNAs (lncRNAs) and m6A-related genes was determined by gene expression analysis using Perl and R software. Co-expression network of m6A-lncRNA was constructed, and the relevant lncRNAs associated with prognosis were identified using univariate Cox regression analysis. These lncRNAs were then divided into two clusters (cluster 1 and cluster 2) to determine the differences in survival, pathoclinical parameters, and immune cell infiltration between the different lncRNA subtypes. The least absolute shrinkage and selection operator (LASSO) was carried out for regression analysis and prognostic model. The HCC patients were randomly divided into a train group and a test group. According to the median risk score of the model, HCC patients were divided into high-risk and low-risk groups. We built models using the train group and confirmed them through the test group. The m6A-lncRNAs derived from the models were analyzed for the tumor mutational burden (TMB), immune evasion and immune function using R software. AL355574.1 was identified as an important m6A-associated lncRNA and selected for further investigation. Finally, in vitro experiments were conducted to confirm the effect of AL355574.1 on the biological function of HCC and the possible biological mechanisms. Huh7 and HepG2 cells were transfected with AL355574.1 siRNA and cell proliferation ability was measured by CCK-8, EdU and colony formation assays. Wound healing and transwell assays were used to determine the cell migration capacity. The expression levels of MMP-2, MMP-9, E-cadherin, N-cadherin and Akt/mTOR phosphorylation were all determined by Western blotting. Results: The lncRNAs with significant prognostic value were classified into two subtypes by a consistent clustering analysis. We found that the clinical features, immune cell infiltration and tumor microenvironment (TME) were significantly different between the lncRNA subtypes. Our analysis revealed significant correlations between these different lncRNA subtypes and immune infiltrating and stromal cells. We created the final risk profile using LASSO regression, which notably included three lncRNAs (AL355574.1, AL158166.1, TMCC1-AS1). A prognostic signature consisting of the three lncRNAs was constructed, and the model showed excellent prognostic predictive ability. The overall survival (OS) of the low-risk cohort was significantly higher than that of the high-risk cohort in both the train and test group. Both risk score [hazard ratio (HR)=1.062; P<0.001] and stage (HR=1.647; P< 0.001) were considered independent indicators of HCC prognosis by univariate and multivariate Cox regression analysis. In Huh7 and HepG2 cells, AL355574.1 knockdown inhibited cell proliferation and migration, suppressed the protein expression levels of MMP-2, MMP-9, N-cadherin and Akt/mTOR phosphorylation, but promoted the protein expression levels of E-cadherin. Conclusions: This study established a predictive model for the OS of HCC patients, and these OS-related m6A-lncRNAs, especially AL355574.1 may play a potential role in the progression of HCC. In vitro experiments also showed that AL355574.1 could enhance the expression of MMPs and EMT through the Akt/mTOR signaling pathway, thereby affected the proliferation and migration of HCC. This provides a new perspective on the anticancer molecular mechanism of AL355574.1 in HCC.

Keywords: HCC; LASSO; immune; lncRNAs; m6A.


Conflict of interest statement

Competing Interests: The authors have declared that no competing interest exists.

Figures

Figure 1
Figure 1
Workflow of the study.
Figure 2
Figure 2
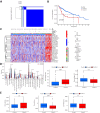
To identify m6A gene-associated prognostic lncRNAs and their differential expression levels in HCC patients. A. Expression Sankey diagram between lncRNA expression and m6A-related gene expression in HCC patients based on TCGA database; B. Correlation between m6A-associated gene expression and lncRNA expression in HCC patients using the TCGA database. C. The prognosis-related lncRNA expression data were analysed by univariate Cox regression and presented as a forest plot. Hazard ratios were calculated for the confidence intervals of correlated lncRNAs, and the red color represents high-risk lncRNAs; D. Differences in the expression of lncRNAs associated with the prognosis of m6A in HCC tissues and normal tissues were analysed on the basis of the TCGA database and presented as heatmaps.
Figure 3
Figure 3
Analysis of prognosis-related m6A-lncRNAs between survival, clinicopathological parameters, and immune infiltration in HCC patients. A. According to the expression of lncRNAs, when K=2, there were least cross-mixing part between the two types and the CDF value was lowest, so we classified lncRNAs into two types: cluser 1 and cluster 2; B. Survival analysis according to the subtype group of different lncRNAs; C. Relationship between the difference in expression of prognostic lncRNAs in different lncRNA subtype groups and different clinicopathological parameters in HCC patients, red represents high expression clusters, blue represents low expression clusters, the horizontal axis represents samples, the vertical axis represents m6A-related prognostic lncRNAs; D. The differential analysis of the infiltration of immune cells in the different clusters is shown in the vioplot; E. Differential analysis of tumour microenvironment in different clusters was performed and results shown in vioplot.
Figure 4
Figure 4
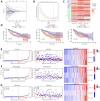
Construction of a prognostic model for m6A-related lncRNAs based on the TCGA database. A-B. Prognostic model was constructed via LASSO regression; C. Heat map of correlation of AL355574.1, AL158166.1 and TMCC1-AS1 with m6A gene; D. Kaplan-Meier curve analysis between the high-risk group and low-risk group was performed in the all-dataset, train data set and test data set; E. Patient risk scores and survivals with high and low-risk values in the all-dataset, train data set and test data set; Expression of m6A-associated lncRNA models for each patient presented in the cluster analysis heat map (AL35574.1, AL158166.1, and TMCC1-AS1); F-G. Correlation analysis results for the train and test dataset.
Figure 5
Figure 5
Independent prognostic value of risk model for m6A-lncRNA. A. Forest plot of univariate Cox regression suggest that the pathological stage and risk score of HCC patients are relevant prognostic values; B. Forest plot of multivariate Cox regression showing pathological stage and risk score as independent prognostic factors in HCC patients; C. The ROC curves show the sensitivity of the risk scores in predicting the survival of patients with HCC (sensitivity of patient survival at 1, 3 and 5 years). The ROC curves represent the reliability of the risk models described above; D. ROC curve showing the sensitivity of risk model, age, gender, pathological stage, and histological grade; E. The c-index (exponential curve) shows that the risk score is the most sensitive factor; F. The likelihood of 1-year, 3-year and 5-year OS predicted by the nomogram, and the likelihood of 1-year, 3-year and 5-year OS predicted by the calibration curve of the nomogram.
Figure 6
Figure 6
Principal component analysis between the two groups based on A. total gene expression profile; B. 23 m6A genes; C. m6A-associated lncRNAs and D. 3 m6A-associated lncRNA profiles based on TCGA database.
Figure 7
Figure 7
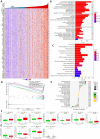
Enrichment analysis and mutation analysis. A. The correlation between the high-risk and low-risk groups in terms of immune function; B. GO results show that model molecules are associated with the biological processes of Tubulin binding/Microtubule Binding and peptidase regulator activity; C. KEGG results show that model molecules are associated with biological processes such as cell cycle, ECM-receptor integration and P53 signaling pathway; D. Differences in mutation types of different genes in HCC patients in the high-risk and low-risk groups; E. Violin plot showen that the difference between high-risk and low risk groups in TMB; F. Difference in survival time between TMB patients in the high-risk group and the low-risk group; G. The prognosis in different groups; H. Violin plot showed the difference between high and low-risk groups in TIDE.
Figure 8
Figure 8
Expression level and prognosis of AL355574.1 in HCC samples. A. The expression of AL355574.1 in different tumor tissues; B-C. The expression levels of AL355574.1 were elevated in HCC based on the TCGA database; D. Based on the TCGA database, the overall survival time of HCC patients with high AL355574.1 expression was significantly shorter than that of patients with low AL355574.1 expression; E. For the TCGA database, elevated AL355574.1 expression in HCC subjects with working characteristic analysis (AUC=0.891) had diagnostic value; F-H. AL355574.1 expression was positively correlated with Histological grade, Pathological stage and T stage; I. Likelihood of OS at 1, 3, and 5 years in HCC patients predicted by prediction plots. Likelihood of calibration plots of 1-year, 3-year, and 5-year OS prediction column plots.
Figure 9
Figure 9
AL355574.1 GO, KEGG enrichment analysis and GSEA enrichment score as well as immune infiltration. A. The top 100 genes associated with AL355574.1 expression. B. The biological functional pathways associated with AL355574.1 were identified using GO enrichment analysis; C. KEGG enrichment analysis, and GSEA D; E. Relationship between AL355574.1 expression levels and the relative abundance of 22 immune cell types; F-G. Sensitivity of drugs between patients with high and low AL355574.1 expression.
Figure 10
Figure 10
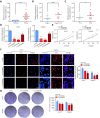
The expression of AL355574.1 in HCC tissues and the effect of AL355574.1 on HCC cells proliferation. A. AL355574.1 was highly expressed in HCC tissues. B-C. The expression of AL355574.1 in the different pathological stage and T-stages of clinical patients. Huh7 and HepG2 cells were transfected with si-AL355574.1 and negative control siRNA (si-NC) for the indicated times, RT-qPCR was used to verify the knockdown efficiency (D); CCK-8 assay was used to detect the cell viability (E); EdU and colony formation assays were used to measure the cell proliferation (F-G). Scale bar=50 μm, data were shown as mean±SD.*P < 0.05, **P < 0.01 and ***P < 0.001.
Figure 11
Figure 11
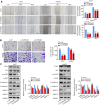
The effect of AL355574.1 on migration of HCC cells. Huh7 and HepG2 cells were transfected with si-AL355574.1 and negative control siRNA, wound healing assay (A) and transwell assay (B) were used to investigate the effects of AL355574.1 on cell migration, respectively, the expression levels of MMP-2, MMP-9, E-cadherin, N-cadherin and the phosphorylation of Akt and mTOR all were measured using Western blotting (C). Scale bar=50 μm, data were shown as mean±SD.*P < 0.05, **P < 0.01 and ***P < 0.001.

Similar articles

Cited by

References

    1. Nagaraju GP, Dariya B, Kasa P, Peela S, El-Rayes BF. Epigenetics in hepatocellular carcinoma. Seminars in cancer biology. 2022;86:622–632. - PubMed
    1. Chen L, Guo P, He Y, Chen Z, Chen L, Luo Y. et al. HCC-derived exosomes elicit HCC progression and recurrence by epithelial-mesenchymal transition through MAPK/ERK signalling pathway. Cell death & disease. 2018;9:513. - PMC - PubMed
    1. Lee J, Kang H. Role of MicroRNAs and Long Non-Coding RNAs in Sarcopenia. Cells. 2022;11:187. - PMC - PubMed
    1. Chen LL. Linking Long Noncoding RNA Localization and Function. Trends in biochemical sciences. 2016;41:761–772. - PubMed
    1. Santos F, Capela AM, Mateus F, Nóbrega-Pereira S, Bernardes de Jesus B. Non-coding antisense transcripts: fine regulation of gene expression in cancer. Computational and structural biotechnology journal. 2022;20:5652–5660. - PMC - PubMed