

Increased PD-1+ NK Cell Subset in the Older Population
- PMID: 38435114
- PMCID: PMC10907132
- DOI: 10.2147/IJGM.S452476
Increased PD-1+ NK Cell Subset in the Older Population
Abstract
Background: The aging of the immune system is associated with various diseases. It is worth exploring the changes of the immune system in aging. Previous studies have shown that aged T cells have enhanced expression of co-inhibitory molecules. However, it remains unclear whether aged NK cells exhibit similar characteristics to aged T cells. The objective of our research was to clarify this aspect.
Patients and methods: This study included 98 adults aged 24-90 years (50 males and 48 females). We detected the subset of peripheral blood NK cells and the expression of various receptors on NK cells among donors of different age groups by flow cytometry. Immune subsets were initially defined by forward and side-scatter characteristics and then staining with the appropriate marker.
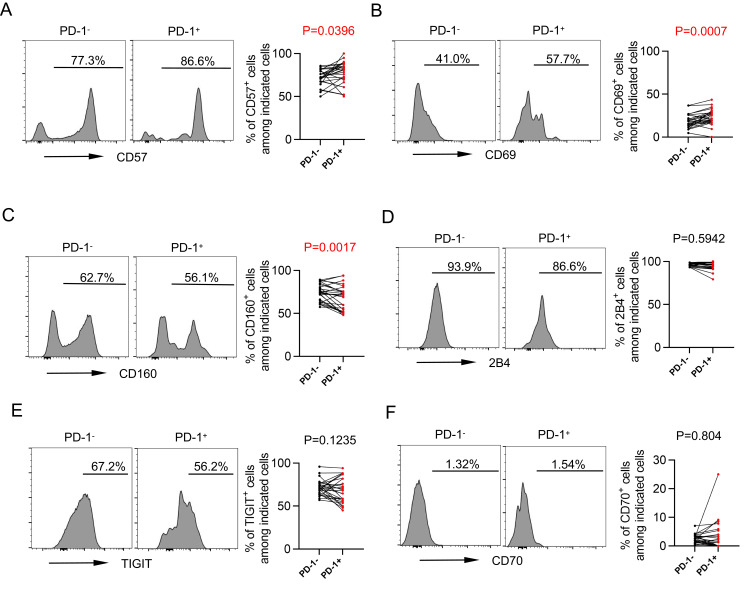
Results: The absolute number and subset distribution of NK cells were not associated with age. However, CD57 expression and CD69 expression were correlated with age. Furthermore, we found that PD-1 was up-regulated on NK cells in older people, associated with aging, while no such change was observed in other co-inhibitory molecules, including 2B4, CTLA-4, TIM-3, BTLA, CD70, CD39, CD160, and TIGIT. PD-1+ NK cells expressed high levels of CD57 and CD69, indicating PD-1+ NK cells displayed a phenotype of over-activation and aging.
Discussion: This study indicated that PD-1+ NK cells were one of the characteristics of NK cells in older people.
Conclusion: This study indicated that PD-1+ NK cells were one of the characteristics of NK cells in older people. Those findings provided new ideas to explore the underlying drivers of NK aging.
Keywords: NK cell; PD-1; aging; co-inhibitory molecules.
© 2024 Deng et al.
Conflict of interest statement
The authors declare no conflicts of interest in this work.
Figures


Similar articles
-
High co-expression of immune checkpoint receptors PD-1, CTLA-4, LAG-3, TIM-3, and TIGIT on tumor-infiltrating lymphocytes in early-stage breast cancer.World J Surg Oncol. 2022 Oct 21;20(1):349. doi: 10.1186/s12957-022-02810-z. World J Surg Oncol. 2022. PMID: 36271406 Free PMC article.
-
Increased Frequency of Dysfunctional Siglec-7-CD57+PD-1+ Natural Killer Cells in Patients With Non-alcoholic Fatty Liver Disease.Front Immunol. 2021 Feb 22;12:603133. doi: 10.3389/fimmu.2021.603133. eCollection 2021. Front Immunol. 2021. PMID: 33692781 Free PMC article. Clinical Trial.
-
PD-1, CTLA-4, LAG-3, and TIGIT: The roles of immune checkpoint receptors on the regulation of human NK cell phenotype and functions.Immunol Lett. 2021 Dec;240:15-23. doi: 10.1016/j.imlet.2021.09.009. Epub 2021 Sep 29. Immunol Lett. 2021. PMID: 34599946
-
Features of Memory-Like and PD-1(+) Human NK Cell Subsets.Front Immunol. 2016 Sep 14;7:351. doi: 10.3389/fimmu.2016.00351. eCollection 2016. Front Immunol. 2016. PMID: 27683578 Free PMC article. Review.
-
Increased expression of NK cell markers on T lymphocytes in aging and chronic activation of the immune system reflects the accumulation of effector/senescent T cells.Mech Ageing Dev. 2000 Dec 20;121(1-3):77-88. doi: 10.1016/s0047-6374(00)00199-8. Mech Ageing Dev. 2000. PMID: 11164462 Review.
Cited by
-
Immunoinflammation and post-translational modifications in the aging process.J Transl Med. 2025 Aug 14;23(1):910. doi: 10.1186/s12967-025-06892-7. J Transl Med. 2025. PMID: 40814109 Free PMC article. Review.
-
Integration of humanized ROBO1 CAR in PD-1 locus in natural killer cells delivers synergistic tumor-killing effect against non-small cell lung cancer.Cancer Gene Ther. 2025 Sep 5. doi: 10.1038/s41417-025-00957-x. Online ahead of print. Cancer Gene Ther. 2025. PMID: 40913086
-
The Role of Aging and Senescence in Immune Checkpoint Inhibitor Response and Toxicity.Int J Mol Sci. 2024 Jun 27;25(13):7013. doi: 10.3390/ijms25137013. Int J Mol Sci. 2024. PMID: 39000121 Free PMC article. Review.
References
LinkOut - more resources
Full Text Sources
Research Materials
