

Effects of guanidinoacetic acid supplementation on liver and breast muscle fat deposition, lipid levels, and lipid metabolism-related gene expression in ducks
- PMID: 38435369
- PMCID: PMC10904544
- DOI: 10.3389/fvets.2024.1364815
Effects of guanidinoacetic acid supplementation on liver and breast muscle fat deposition, lipid levels, and lipid metabolism-related gene expression in ducks
Abstract
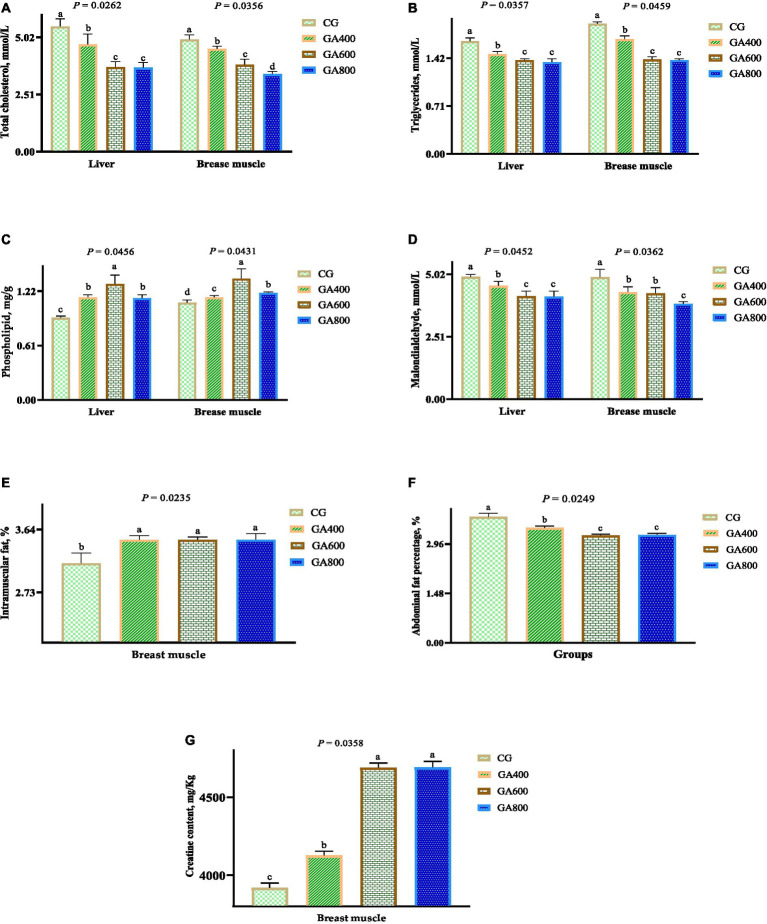
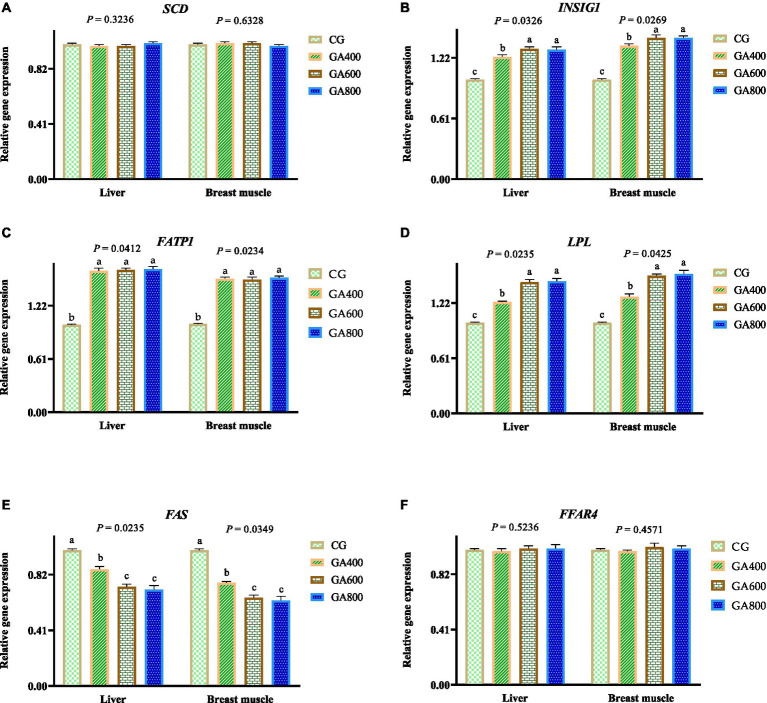
Exogenous supplementation of guanidinoacetic acid can mechanistically regulate the energy distribution in muscle cells. This study aimed to investigate the effects of guanidinoacetic acid supplementation on liver and breast muscle fat deposition, lipid levels, and lipid metabolism-related gene expression in ducks. We randomly divided 480 42 days-old female Jiaji ducks into four groups with six replicates and 20 ducks for each replicate. The control group was fed the basal diet, and the experimental groups were fed the basal diet with 400, 600, and 800 mg/kg (GA400, GA600, and GA800) guanidinoacetic acid, respectively. Compared with the control group, (1) the total cholesterol (p = 0.0262), triglycerides (p = 0.0357), malondialdehyde (p = 0.0452) contents were lower in GA400, GA600 and GA800 in the liver; (2) the total cholesterol (p = 0.0365), triglycerides (p = 0.0459), and malondialdehyde (p = 0.0326) contents in breast muscle were decreased in GA400, GA600 and GA800; (3) the high density lipoprotein (p = 0.0356) and apolipoprotein-A1 (p = 0.0125) contents were increased in GA600 in the liver; (4) the apolipoprotein-A1 contents (p = 0.0489) in breast muscle were higher in GA600 and GA800; (5) the lipoprotein lipase contents (p = 0.0325) in the liver were higher in GA600 and GA800; (6) the malate dehydrogenase contents (p = 0.0269) in breast muscle were lower in GA400, GA600, and GA800; (7) the insulin induced gene 1 (p = 0.0326), fatty acid transport protein 1 (p = 0.0412), and lipoprotein lipase (p = 0.0235) relative expression were higher in GA400, GA600, and GA800 in the liver; (8) the insulin induced gene 1 (p = 0.0269), fatty acid transport protein 1 (p = 0.0234), and lipoprotein lipase (p = 0.0425) relative expression were increased in GA400, GA600, and GA800 in breast muscle. In this study, the optimum dosage of 600 mg/kg guanidinoacetic acid improved the liver and breast muscle fat deposition, lipid levels, and lipid metabolism-related gene expression in ducks.
Keywords: fat deposition; fatty acid composition; guanidinoacetic acid; lipase activity; lipid metabolism genes.
Copyright © 2024 Wu, Xie, Peng, Ji, Qian, Shen and Hou.
Conflict of interest statement
QS was employed by the Hainan Xuhuai Technology Co., Ltd. The remaining authors declare that the research was conducted in the absence of any commercial or financial relationships that could be construed as a potential conflict of interest.
Figures
Similar articles
-
Effects of a high-fat diet on the growth performance, lipid metabolism, and the fatty acids composition of liver and skin fat in Pekin ducks aged from 10 to 40 days.Poult Sci. 2023 Mar;102(3):102429. doi: 10.1016/j.psj.2022.102429. Epub 2022 Dec 20. Poult Sci. 2023. PMID: 36587452 Free PMC article.
-
Dietary supplementation with hydroxy-methionine manganese improves meat quality, antioxidant capacity, and lipid metabolism in Cherry Valley ducks (Anas platyrhynchos domesticus).Front Vet Sci. 2025 Apr 4;12:1481793. doi: 10.3389/fvets.2025.1481793. eCollection 2025. Front Vet Sci. 2025. PMID: 40256604 Free PMC article.
-
Does overfeeding enhance genotype effects on energy metabolism and lipid deposition in breast muscle of ducks?Comp Biochem Physiol A Mol Integr Physiol. 2006 Dec;145(4):413-8. doi: 10.1016/j.cbpa.2006.07.024. Epub 2006 Nov 1. Comp Biochem Physiol A Mol Integr Physiol. 2006. PMID: 17081789
-
Dietary lipid levels impact lipoprotein lipase, hormone-sensitive lipase, and fatty acid synthetase gene expression in three tissues of adult GIFT strain of Nile tilapia, Oreochromis niloticus.Fish Physiol Biochem. 2015 Feb;41(1):1-18. doi: 10.1007/s10695-014-0001-1. Epub 2014 Oct 28. Fish Physiol Biochem. 2015. PMID: 25347968 Clinical Trial.
-
β-Casomorphin increases fat deposition in broiler chickens by modulating expression of lipid metabolism genes.Animal. 2019 Apr;13(4):777-783. doi: 10.1017/S1751731118002197. Epub 2018 Aug 24. Animal. 2019. PMID: 30139413
Cited by
-
Effect of Guanidinoacetic Acid and Zilpaterol Hydrochloride Feed Additions on Lambs' Productive Performance, Carcass Characteristics, and Blood Chemistry.Animals (Basel). 2025 Jun 7;15(12):1692. doi: 10.3390/ani15121692. Animals (Basel). 2025. PMID: 40564244 Free PMC article.
-
An indirect competitive ELISA for determination of guanidine acetic acid in animal feed.Sci Rep. 2025 May 2;15(1):15325. doi: 10.1038/s41598-025-00130-2. Sci Rep. 2025. PMID: 40312435 Free PMC article.
-
Effects of Dietary Guanidinoacetic Acid on the Performance, Rumen Fermentation, Metabolism, and Meat of Confined Steers.Animals (Basel). 2024 Sep 9;14(17):2617. doi: 10.3390/ani14172617. Animals (Basel). 2024. PMID: 39272402 Free PMC article.
-
Guanidinoacetic acid in laying hen diets with varying dietary energy: Productivity, antioxidant status, yolk fatty acid profile, hepatic lipid metabolism, and gut health.Poult Sci. 2025 Jul;104(7):105159. doi: 10.1016/j.psj.2025.105159. Epub 2025 Apr 13. Poult Sci. 2025. PMID: 40267570 Free PMC article.
-
Effects of Pueraria extracts on growth performance, immune function, and immune-related gene expression of Wuzhishan piglets.Front Vet Sci. 2025 May 30;12:1491130. doi: 10.3389/fvets.2025.1491130. eCollection 2025. Front Vet Sci. 2025. PMID: 40520430 Free PMC article.
References
LinkOut - more resources
Full Text Sources
Research Materials