. 2024 Feb 26;8(2):e45.
doi: 10.1002/hem3.45. eCollection 2024 Feb.

Integrative single-cell expression and functional studies unravels a sensitization to cytarabine-based chemotherapy through HIF pathway inhibition in AML leukemia stem cells

Affiliations

Integrative single-cell expression and functional studies unravels a sensitization to cytarabine-based chemotherapy through HIF pathway inhibition in AML leukemia stem cells

Talia Velasco-Hernandez et al. Hemasphere. .

Abstract

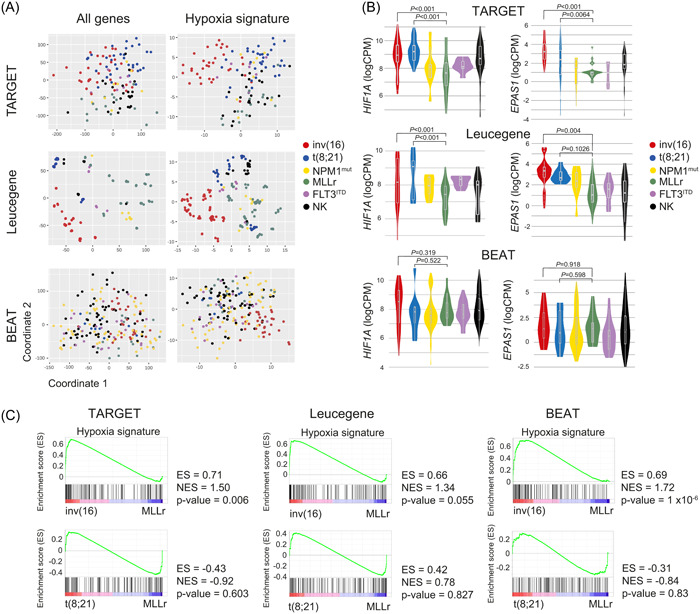
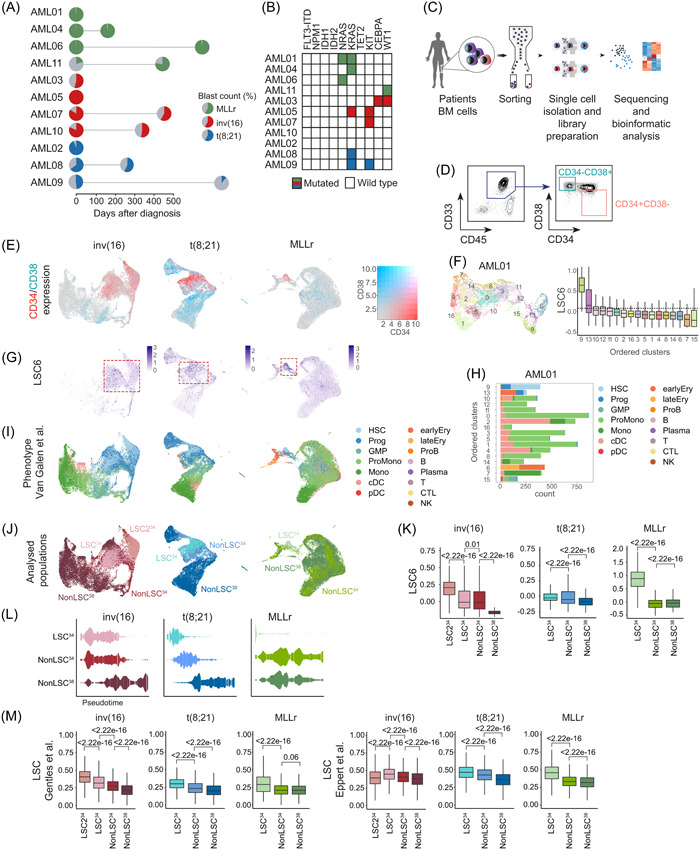
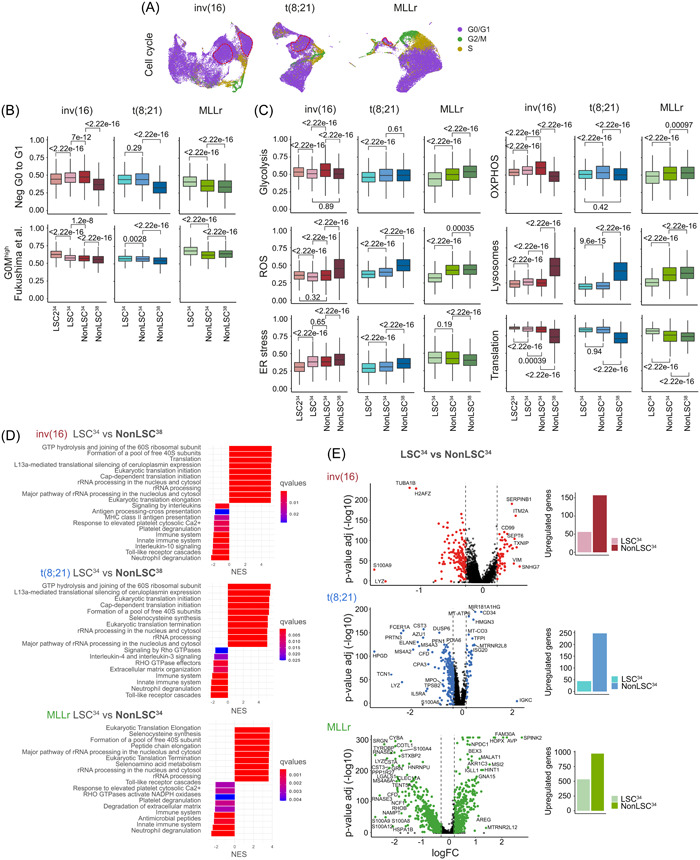
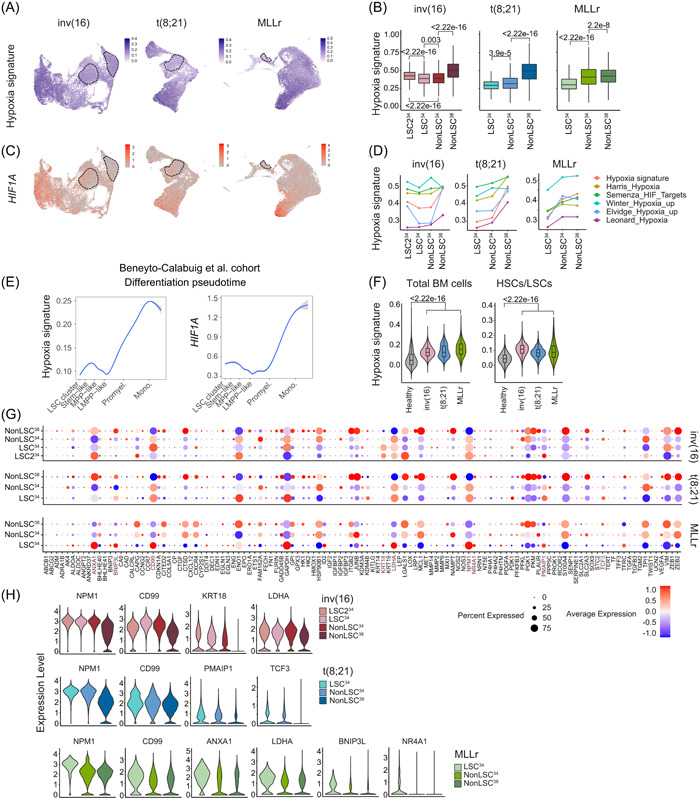
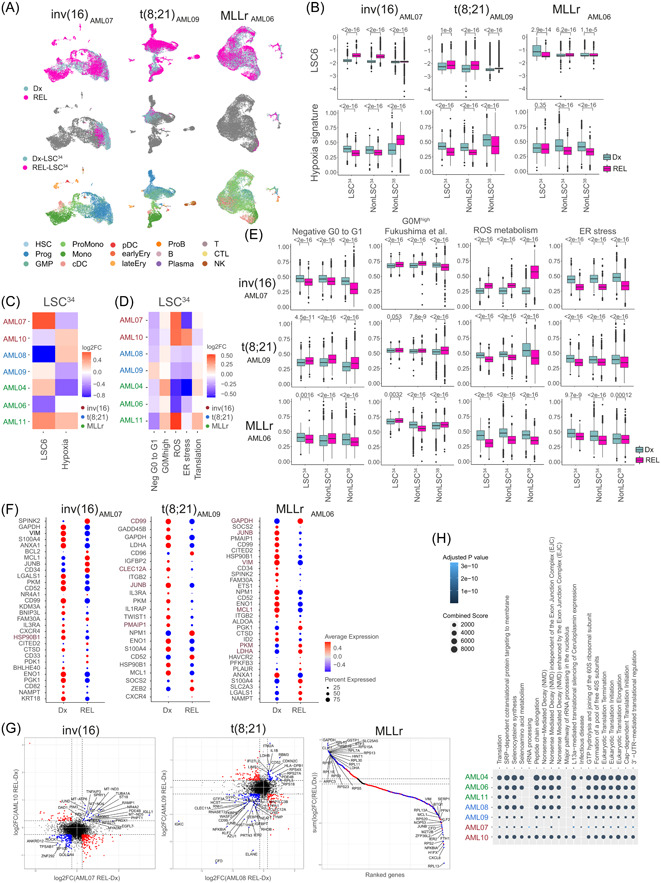
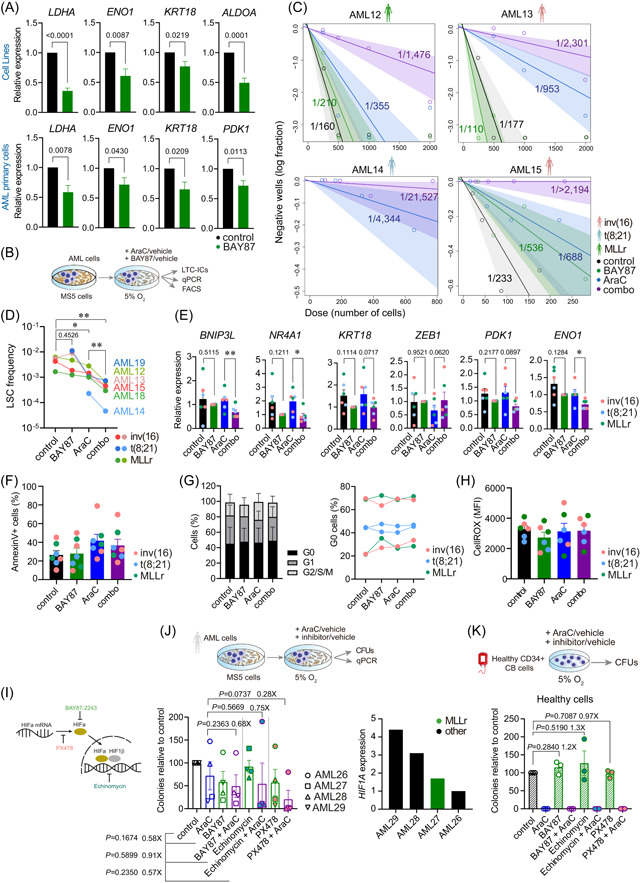
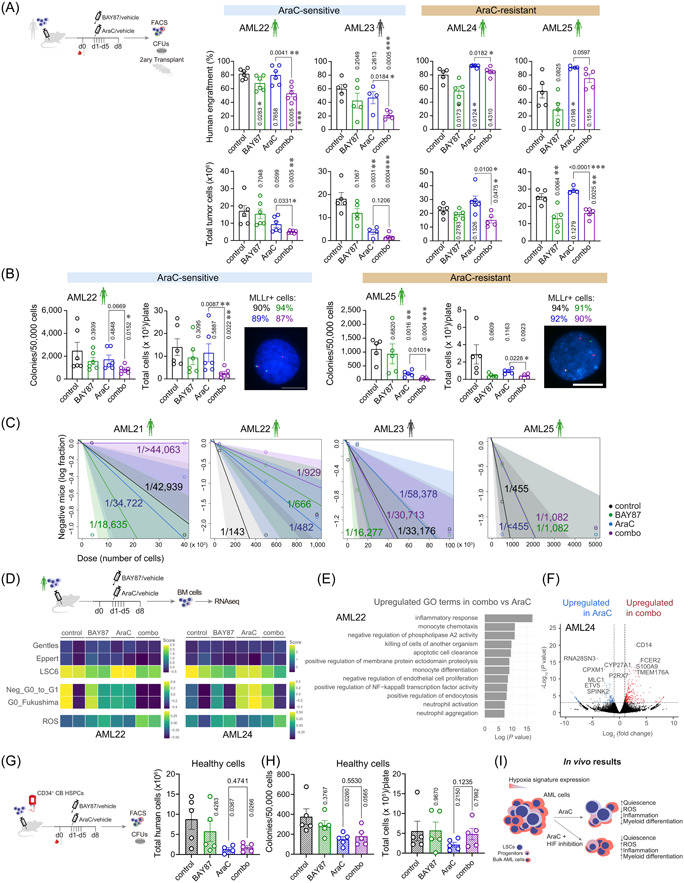
Relapse remains a major challenge in the clinical management of acute myeloid leukemia (AML) and is driven by rare therapy-resistant leukemia stem cells (LSCs) that reside in specific bone marrow niches. Hypoxia signaling maintains cells in a quiescent and metabolically relaxed state, desensitizing them to chemotherapy. This suggests the hypothesis that hypoxia contributes to the chemoresistance of AML-LSCs and may represent a therapeutic target to sensitize AML-LSCs to chemotherapy. Here, we identify HIFhigh and HIFlow specific AML subgroups (inv(16)/t(8;21) and MLLr, respectively) and provide a comprehensive single-cell expression atlas of 119,000 AML cells and AML-LSCs in paired diagnostic-relapse samples from these molecular subgroups. The HIF/hypoxia pathway signature is attenuated in AML-LSCs compared with more differentiated AML cells but is more expressed than in healthy hematopoietic cells. Importantly, chemical inhibition of HIF cooperates with standard-of-care chemotherapy to impair AML growth and to substantially eliminate AML-LSCs in vitro and in vivo. These findings support the HIF pathway in the stem cell-driven drug resistance of AML and unravel avenues for combinatorial targeted and chemotherapy-based approaches to specifically eliminate AML-LSCs.


Conflict of interest statement

Pablo Menéndez is the founder of the spin‐off OneChain Immunotherapeutics, which has no connection with the present research. The other authors declare no conflict of interest.

Figures

Figure 1
Figure 1
Hypoxia inducible factor (HIF) pathway gene expression signature in different acute myeloid leukemia (AML) cytogenetic subgroups. (A) Multidimensional scaling (MDS) representation of AML samples from TARGET (78 patient samples and 147 runs), Leucegene (72 patient samples and 301 runs), and BEAT‐AML (206 patients and 707 runs) datasets analyzing the expression of all the detected genes (left panels) or, specifically, the 119 HIF target genes (right panels). (B) Expression (LogCPM) of HIF1A and HIF2A (EPAS1) in each cytogenetic AML subgroup from TARGET, Leucegene, and BEAT‐AML. (C) Gene set enrichment analysis (GSEA) of the HIF pathway comparing inv(16) and t(8;21) with MLLr AMLs. CPM, counts per million; ES, enrichment score; NES, normalized enrichment score.
Figure 2
Figure 2
Enrichment and identification of the leukemia stem cell (LSC) compartment in the scRNA‐seq dataset. (A) Overview of the primary acute myeloid leukemia (AML) samples used for the scRNA‐seq analysis. The distinct cytogenetic subgroups are color‐coded. The colored area of the pie charts depicts the percentage of blasts. Paired‐relapsed samples are depicted with a second pie chart at the time of relapse. Further information on each sample can be found in Table S3. (B) Mutational profile of the analyzed samples. (C) Scheme depicting the different steps from sample sourcing to scRNA‐seq analysis. (D) Representative FACS profile depicting how the CD34+CD38 and CD34CD38+AML cells were FACS‐purified for scRNA‐seq. The specific FACS profiles of each AML sample can be found in Supporting Information S1: Figure S1. (E) Uniform manifold approximation and projection (UMAP) plots showing the expression of CD34 and CD38 among all cells integrated from different samples in each cytogenetic subgroup. (F) UMAP plot showing the random clusterization of the cells from the sample AML01 and boxplot of the LSC6 score (Elsayed et al. 35 ) of each cluster for the identification of the LSC‐enriched cluster. Dotted line marks the 9th decile. (G) UMAP plots depicting the LSC6 score assigned to each cell. All cells from the different samples in each cytogenetic subgroup are integrated. Red square marks the LSC6‐enriched area. (H) Number of cells from each predicted phenotype, according to Van Galen et al., included in each cluster identified in sample AML01. (I, J) UMAP plots showing the predicted phenotype of the cells according to Van Galen et al. (I), and the assigned population (LSC34, nonLSC34, and nonLSC38) (J) for downstream analysis. All cells from the different samples in each cytogenetic subgroup are integrated. (K) LSC6 (Elsayed et al. 35 ) score of each of the defined populations (LSC34, nonLSC34, and nonLSC38). Nonparametric Wilcoxon test p‐values are shown for each comparison. (L) Trajectory/pseudotime analysis of the defined populations from the different cytogenetic subgroups. (M) Expression of the LSC signatures described by Gentles. and Eppert et al. in each of the defined populations for the different cytogenetic subgroups. Nonparametric Wilcoxon test p‐values are shown for each comparison. B, mature B cell; cDC, conventional dendritic cells; CTL, cytotoxic T lymphocyte; Ery, erythroid progenitor; FACS, fluorescence‐activated cell sorting; GMP, granulocyte‐macrophage progenitor; HSC, hematopoietic stem cell; log2FC, log2 fold change; Mono, monocyte; NK, natural killer cell; pDC, plasmacytoid dendritic cells; Plasma, plasma cell; ProB, B cell progenitor; Prog, progenitor; ProMono, promonocyte; T, naïve T cell.
Figure 3
Figure 3
Cell cycle and metabolic characterization of the leukemia stem cells (LSC)34 cluster. (A) Uniform manifold approximation and projection (UMAP) plots showing the cell cycle phase prediction for each cell. Cells from all the different samples in each cytogenetic subgroup are integrated. (B) Quiescence status analysis of the defined populations from the different cytogenetic subgroups using the gene ontology (GO) signature Neg G0 to G1 (GO:0070 317) and the dormancy signature G0Mhigh described in Fukushima et al. Nonparametric Wilcoxon test p‐values are shown for each comparison. (C) Analysis of different metabolic pathways related to stemness and hypoxia (Glycolysis, OXPHOS, reactive oxygen species [ROS], Lysosomes, ER stress, and translation) for the defined populations from the different cytogenetic subgroups. Nonparametric Wilcoxon test p‐values are shown for each comparison. (D) Gene set enrichment analysis (GSEA) showing the enriched biological pathways in the indicated populations of cells. For inv(16) and t(8;21) acute myeloid leukemia (AML), LSC34 cells are compared with nonLSC38 cells. For MLLr AML, LSC34 cells are compared with nonLSC34 cells. Complementary analyses are shown in Supporting Information S1: Figure S3. (E) Volcano plots showing the differentially expressed genes (DEGs) between LSC34 and nonLSC34 cells of each cytogenetic subgroup. Plots on the right show the total number of overexpressed genes in each population.
Figure 4
Figure 4
Low expression of hypoxia signaling signature in human acute myeloid leukemia (AML)‐leukemia stem cells (LSCs). (A) Uniform manifold approximation and projection (UMAP) plots showing expression of the hypoxia signature in all cells integrated from the different samples in each cytogenetic subgroup. (B) Hypoxia signature score in each of the defined populations from the different cytogenetic subgroups. Nonparametric Wilcoxon test p‐values are shown for each comparison. (C) UMAP plots showing expression of the HIF1A gene in all cells integrated from the different samples in each cytogenetic subgroup. (D) Hypoxia signature score of each of the defined clusters comparing the hypoxia signature used in this study with five hypoxia signatures previously reported. (E) Hypoxia signature and HIF1A expression in AML cells from Beneyto‐Calabuig et al. AML cohort. (F) Hypoxia expression signature comparing each AML cytogenetic subgroup with healthy total BM cells (left plot) or healthy hematopoietic stem cells (HSCs)/LSCs (right plot). Nonparametric Wilcoxon test p‐values are shown for each comparison. (G) Expression of the 119 genes from the hypoxia signature in each of the defined clusters. HIF1A targets significantly highly expressed in the LSC34 cluster are highlighted in brown color. (H) Violin plots showing the expression of the significantly overexpressed genes of the hypoxia signaling pathway in the LSC34 cluster in each cytogenetic AML subgroup.
Figure 5
Figure 5
Relapse (REL)‐leukemia stem cells (LSC)34 cluster reveals patient‐specific differential molecular features. (A) Uniform manifold approximation and projection (UMAP) plots integrating patient‐matched acute myeloid leukemia (AML) cells at diagnostic (Dx) and REL (top plots), showing the identified LSC34 cluster at Dx and REL (middle plots) and showing the predicted phenotype according to Van Galen et al. (bottom plots). One pair from each cytogenetic subgroup is shown. Additional paired samples are analyzed in Supporting Information S1: Figure S5A,B. (B) LSC6 score (top plots) and hypoxia signature score (bottom plots) of the defined clusters at Dx and REL for each AML cytogenetic subgroup. Nonparametric Wilcoxon test p‐values are shown for each comparison. (C, D) Heatmap of the variation of the LSC6 and hypoxia (C) and metabolic pathways (D) signature scores in the LSC34 population in the seven Dx‐REL pairs. (E) Score of indicated metabolic pathways related to stemness and hypoxia in the defined clusters at Dx and REL for each AML cytogenetic subgroup. Nonparametric Wilcoxon test p‐values are shown for each comparison. (F) Hypoxia inducible factor (HIF) target genes differentially expressed in the LSC34 population at Dx versus REL in each pair from the indicated patients. Additional paired samples are analyzed in Supporting Information S1: Figure S5G. Genes consistently higher or lower expressed in all patients from each AML subgroup are highlighted in brown color. (G) Comparison of the differentially expressed genes (DEGs) in the LSC34 population of each paired sample in each cytogenetic subgroup. For inv(16) and t(8;21) AMLs, plots compare two AML Dx‐REL pairs (AML07 and AML10 for inv[16]; AML08 and AML09 for t[8;21]). For MLLr AMLs, the plot compares three AML Dx‐REL pairs (AML04, AML06, and AML11). Each dot represents a gene with similar (in blue) or different (in red) expression in paired Dx versus REL samples. (H) Reactome showing biological pathways enriched in REL‐LSC34 cells compared to Dx‐LSC34 cells. B, mature B cell; cDC, conventional dendritic cells; CTL, cytotoxic T lymphocyte; Ery, erythroid progenitor; GMP, granulocyte‐macrophage progenitor; log2FC, log2 fold change; LSC, leukemic stem cell; Mono, monocyte; NK, natural killer cell; pDC, plasmacytoid dendritic cells; Plasma, plasma cell; ProB, B cell progenitor; Prog, progenitor; ProMono, promonocyte; T, naïve T cell.
Figure 6
Figure 6
Inhibition of the hypoxia inducible factor (HIF) pathway sensitizes acute myeloid leukemia (AML)‐leukemia stem cells (LSCs) to chemotherapy in vitro. (A) Expression of the indicated HIF target genes after 48 h treatment at 5% O2 in n = 5 cell lines (ME1, Kasumi1, THP1, MV[4;11], and Molm13; upper panels) and in n = 8–9 AML primary samples (lower panels). Statistical significance was calculated using the paired Student's t‐test. Expression is normalized with respect to control samples. (B) Experimental overview for (C–H). Human AML primary cells were cultured over MS5 cells for 4 days and treated afterward with the indicated drugs for 48 h at 5% O2. After the treatment, cells were used for gene expression, flow cytometry, or long‐term culture‐initiating cells (LTC‐IC) assays (n = 15 wells/treatment and AML sample). (C) Estimation of the LSC frequency after the LTC‐IC assay was calculated using the ELDA software. (D) Impact of the indicated treatment on the LSC frequency for all the analyzed samples (n = 6) using data from the LTC‐IC assays. Statistical significance was calculated using the Ratio paired Student's t‐test. p‐Values are indicated for the AraC‐combo groups comparison. (E) Expression of the indicated HIF target genes identified in the scRNA‐seq analysis to be overexpressed in the LSC cluster after 48 h treatment with the indicated drugs at 5% O2 (n = 6 samples, AML03, AML16‐AML20; 2 per cytogenetic group). Statistical significance was calculated using the paired Student's t‐test. Expression is normalized with respect to the BAY87 samples. (F–H) Apoptosis quantification with Annexin V staining (F), cell cycle analysis by fluorescence‐activated cell sorting (FACS) (G), and reactive oxygen species (ROS) content measured using CellROX staining (H), in AML cells treated with the indicated drugs for 48 h at 5% O2 (n = 6 samples, AML03, AML16‐AML20). (I) Scheme depicting the mechanisms of action of the HIF inhibitor drugs used in (J, K). (J) Colony unit forming (CFU)‐assays from AML primary cells (n = 4) treated during 48 h with the indicated drugs at 5% O2. Right plot shows the HIF1A expression levels of each of the four AMLs used for this assay. (K) CFU‐assays from healthy CD34+ cord blood HSPCs (n = 3 donors) treated during 48 h with the indicated drugs at 5% O2. Data are shown as mean ± SEM. *p < 0.1, **p < 0.01, ***p < 0.001. Student's t‐test analysis.
Figure 7
Figure 7
Inhibition of the hypoxia inducible factor (HIF) pathway sensitizes acute myeloid leukemia (AML)‐leukemia stem cells (LSCs) to chemotherapy in vivo. (A) Human AML‐engrafted mice were treated with the indicated drugs for 5 days. After completion of the treatment, organs were collected and analyzed by FACS. Cells from the BM were used for ex vivo CFU assays and secondary transplantations. Percentage (upper plots) of human engraftment in BM after treatment and total tumor cells (bottom plots) in bones (tibias, femurs, and hips) are shown (n = 4–6 mice/group). p‐Values of the comparison to control are shown in vertical. (B) Ex vivo clonogenic capacity of BM cells retrieved from mice treated as indicated (n = 4–6/group). Left plot shows the number of colonies per 50,000 plated cells. Right plot shows the total number of cells collected from each CFU plate. FISH analysis confirmed the leukemic identity of these cells. Percentages of MLLr+ cells are shown on top of the FISH image for each indicated treatment (n = 200 counted cells). Scale bar = 10 µm. p‐Values of the comparison to control are shown in vertical. (C) BM cells from treated primary mice were transplanted into secondary recipients at specific doses. LSC estimation in secondary recipients was calculated using ELDA software. Mice were considered leukemic when presenting >0.1% human cells in BM (n = 1–5 mice/dose and group). (D) RNA sequencing analysis was performed from BM cells from treated animals (n = 2 mice/group). Heatmap showing the expression of different LSCs, quiescence, and reactive oxygen species (ROS) signatures. (E) Gene ontology (GO) terms highly expressed in combo‐treated versus AraC‐treated samples. (F) Volcano plot showing the DEGs in AraC and combo‐treated samples. (G) Human CD34+CB cells‐engrafted mice were treated with the indicated drugs for 5 days. After completion of the treatment, organs were collected and analyzed by FACS. Cells from the BM were used for ex vivo CFU assays. Total human cells in bones (tibias, femurs, and hips) after treatment are shown (n = 4–5 mice/group). p‐Values of the comparison to control are shown in vertical. (H) Ex vivo clonogenic capacity of BM cells retrieved from mice treated as indicated (n = 4–6/group). Left plot shows the number of colonies per 50,000 plated cells. Right plot shows the total number of cells collected from each CFU plate. p‐Values of the comparison to control are shown in vertical. (I) Schematic diagram depicting the impact on AML cells of HIF inhibition over the treatment with AraC. BM, bone marrow; d, day; CFU, colony unit forming; FACS, fluorescence‐activated cell sorting; PB, peripheral blood; RBC, red blood cells; WBC, white blood cells. Data are shown as mean ± SEM. *p < 0.05; **p < 0.01; ***p < 0.001. Student's t‐test analysis.

Comment in

References

    1. Döhner H, Wei AH, Löwenberg B. Towards precision medicine for AML. Nat Rev Clin Oncol. 2021;18(9):577‐590. - PubMed
    1. Döhner H, Estey E, Grimwade D, et al. Diagnosis and management of AML in adults: 2017 ELN recommendations from an international expert panel. Blood. 2017;129(4):424‐447. - PMC - PubMed
    1. Bonnet D, Dick JE. Human acute myeloid leukemia is organized as a hierarchy that originates from a primitive hematopoietic cell. Nat Med. 1997;3(7):730‐737. - PubMed
    1. Ho TC, LaMere M, Stevens BM, et al. Evolution of acute myelogenous leukemia stem cell properties after treatment and progression. Blood. 2016;128(13):1671‐1678. - PMC - PubMed
    1. Shlush LI, Mitchell A, Heisler L, et al. Tracing the origins of relapse in acute myeloid leukaemia to stem cells. Nature. 2017;547(7661):104‐108. - PubMed