. 2024 Jan 17;10(2):251-263.
doi: 10.1021/acscentsci.3c01023. eCollection 2024 Feb 28.

Hydrogen-Deuterium Exchange Mass Spectrometry Identifies Local and Long-Distance Interactions within the Multicomponent Radical SAM Enzyme, PqqE

Affiliations

Hydrogen-Deuterium Exchange Mass Spectrometry Identifies Local and Long-Distance Interactions within the Multicomponent Radical SAM Enzyme, PqqE

Wen Zhu et al. ACS Cent Sci. .

Abstract

Interactions among proteins and peptides are essential for many biological activities including the tailoring of peptide substrates to produce natural products. The first step in the production of the bacterial redox cofactor pyrroloquinoline quinone (PQQ) from its peptide precursor is catalyzed by a radical SAM (rSAM) enzyme, PqqE. We describe the use of hydrogen-deuterium exchange mass spectrometry (HDX-MS) to characterize the structure and conformational dynamics in the protein-protein and protein-peptide complexes necessary for PqqE function. HDX-MS-identified hotspots can be discerned in binary and ternary complex structures composed of the peptide PqqA, the peptide-binding chaperone PqqD, and PqqE. Structural conclusions are supported by size-exclusion chromatography coupled to small-angle X-ray scattering (SEC-SAXS). HDX-MS further identifies reciprocal changes upon the binding of substrate peptide and S-adenosylmethionine (SAM) to the PqqE/PqqD complex: long-range conformational alterations have been detected upon the formation of a quaternary complex composed of PqqA/PqqD/PqqE and SAM, spanning nearly 40 Å, from the PqqA binding site in PqqD to the PqqE active site Fe4S4. Interactions among the various regions are concluded to arise from both direct contact and distal communication. The described experimental approach can be readily applied to the investigation of protein conformational communication among a large family of peptide-modifying rSAM enzymes.


Conflict of interest statement

The authors declare no competing financial interest.

Figures

Figure 1
Figure 1
PQQ biosynthesis and reaction catalyzed by PqqE. a) Overview of PQQ biosynthesis. b) Reaction catalyzed by PqqE (green box) in which PqqA is first modified via a cross-linking reaction. The reduced RS Fe4S4 cluster of PqqE initiates reductive SAM cleavage to generate a 5′-dA radical that abstracts a hydrogen from Glu16 of PqqA that is bound to its chaperone PqqD (light-orange box). This leads to a C–C cross-linked product with Tyr20 (numbering refers to Methylorubrum extorquens). The AuxI and AuxII iron–sulfur clusters thought to shuttle electrons within PqqE are shown as black boxes adjacent to the RS site. c) Protein sample sets prepared and analyzed in this work. The designated name for each sample is shown in parentheses.
Figure 2
Figure 2
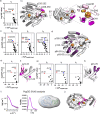
HDX of binary complex PqqDE. a) Volcano plot of Δ%DeDE-E for PqqE-derived peptides at t1 obtained by comparing the %D HDX value for the complex PqqDE to that for PqqE alone (PqqDE-PqqE). Red dots represent type I peptides with p < 0.01. b) Two type I peptides, ep235–252 (light pink) and ep328–350 (magenta) are in the SPASM domain of PqqE. Missing loops and the RS Fe4S4 cluster in the X-ray structure for PqqE were modeled using AlphaFold, and the CteB crystal structure. Iron–sulfur clusters are shown as spheres. c) Volcano plots of the Δ%DeDE-E for PqqE-derived peptides at t2, t3, and t4. Red dots represent type I peptides with p < 0.01. Blue dots represent type II peptides with p < 0.01. d) Type II peptides, highlighted in purple, are located in the TIM barrel of PqqE. e) Volcano plot of Δ%DdDE-D for PqqD-derived peptides at t1 obtained by comparing %D of HDX for the complex PqqDE to the value for PqqD alone (PqqDE-PqqD). Red dots represent type I peptides with p < 0.01. f) Two type I peptides, dp(−18)–22 and dp23–33 (magenta), are located in the N-terminal loop region and the first two β-sheets. PqqE binding residues identified by NMR are shown as spheres. g) Volcano plots of the Δ%DdDE-D for PqqD-derived peptides at t2, t3, and t4. Red dots represent type I peptides with p < 0.01. Blue dots represent type II peptides with p < 0.01. h) Type II peptides cover an α-helical region in PqqD, including Asp-71, a previously proposed PqqE-binding residue. Type II peptide, dp45–76, is highlighted in purple. PqqE binding residues identified by NMR are shown as spheres. i) SAXS data (left) and pair distance distribution analysis (middle) for the PqqDE complex. (Right) The electron density generated by DENSS (gray surface) matches the PqqD (green) and PqqE (light blue) complex in “side-on” mode. j) A PqqDE structural model constructed from HDX-MS analysis. The interface between PqqD and PqqE, as deduced from HDX, is shown in magenta.
Figure 3
Figure 3
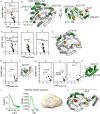
HDX of ternary complex PqqADE. a) Volcano plot of Δ%DeADE-DE values for PqqE-derived peptides at t1, obtained by comparing %D of HDX for the PqqADE complex to that of PqqDE (PqqADE-PqqDE). Red dots represent type I peptides with p < 0.01. b) Type I peptides (green) are located in the TIM barrel of PqqE. c) Volcano plots of the Δ%DeADE-DE for PqqE-derived peptides at t2, t3, and t4. Red dots represent type I peptides with p < 0.01. Blue dots represent type II peptides with p < 0.01. d) Mapping the PqqE-derived type II peptides (highlighted in green) on the structure. e) Volcano plot of Δ%DdADE-DE for PqqD-derived peptides at t1, obtained by comparing %D of HDX for the PqqADE complex to the value in PqqDE (PqqADE-PqqDE). f) The type I peptide (green), dp45–55, is located in a helical region. PqqA binding residues identified by NMR are shown as spheres. g) Volcano plots of the Δ%DdADE-DE for PqqD-derived peptides at t2, t3, and t4. Blue dots represent type II peptides with p < 0.01. h) Type II peptides (green) contain all PqqA binding residues previously identified by NMR, shown as spheres. i) SAXS data (left) and pair distance distribution analysis (middle) for the PqqADE complex. (Right) Electron density generated by DENSS (orange surface) matches the PqqD (green), PqqE (light blue), and PqqA (magenta) complex in the side-on model. j) Proposed PqqADE structural model based on HDX analysis, in which the PqqA structure (red) has been predicted by AlphaFold to lack discrete secondary structure. The PqqA-protected region identified by HDX for both PqqD and PqqE is shown in green, and PqqA has been modeled on top of PqqE and PqqD accordingly.
Figure 4
Figure 4
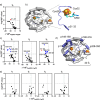
HDX of the PqqDES ternary complex. a) Volcano plot of Δ%DeDES-DE for PqqE-derived peptides at t1, obtained by comparing %D of HDX for the complex PqqDES to the value of PqqDE. Red dot represents type I peptide with p < 0.01. b) Type I peptide (light purple) is located at the RS site of PqqE. The RS loop, the RS Fe4S4 cluster (orange/yellow spheres), which is missing in the crystal structure, and SAM (cyan) were modeled using AlphaFold and the CteB crystal structure. c) Volcano plots of the Δ%DeDES-DE for PqqE-derived peptides at t2, t3, and t4. Red dot represents type I peptide with p < 0.01. Blue dots represent type II peptides with p < 0.01. d) Type II peptides (light purple) are mostly located in the TIM barrel of PqqE. Overlapping peptides are not labeled. e) Volcano plots of Δ%DdDES-DE for PqqD-derived peptides at all time points, obtained by comparing %D of HDX for the complex PqqDES to the value of PqqDE.
Figure 5
Figure 5
HDX of quaternary complex PqqADES in comparison with PqqADE. a) Volcano plot of Δ%DeADES-ADE for PqqE-derived peptides at t1, obtained by comparing %D of HDX for the complex PqqADES to the value of PqqADE. Red dots represent type I peptides with p < 0.01. b) Type I peptide (blue), ep180–216, mapped on the structure of PqqE. c) Volcano plots of Δ%DeADES-ADE for PqqE-derived peptides at t2, t3, and t4. Blue dots represent type II peptides with p < 0.01. d) Type II peptides (blue) are mostly located in the TIM barrel of PqqE. The time dependence of the type II exchange pattern is highlighted. e) Volcano plots of Δ%DdADES-ADE for PqqD-derived peptides at all time points, obtained by comparing %D of HDX for the complex PqqADES to the value of PqqADE. f) Mapping dp45–55 (raspberry) onto the PqqD NMR structure is consistent with the assigned PqqA binding pocket (Figure 3f); this peptide becomes more solvent-exposed on SAM binding.
Figure 6
Figure 6
HDX of quaternary complex PqqADES in comparison with PqqDES. a) Volcano plots of Δ%DeADES-DES for PqqE-derived peptides at t1, obtained by comparing %D of HDX for the complex PqqADES to the value of PqqDES. Blue dots represent type II peptides with p < 0.01. b) Type II peptides with negative Δ%DeADES-DES (light green) mapped onto the structure of PqqE. The peptide, ep21–32, exhibiting positive Δ%DeADES-DES is highlighted in raspberry. c) Volcano plots of Δ%DdADES-DES for PqqD-derived peptides at all time points obtained by comparing %D of HDX for the complex PqqADES to the value of PqqDES. Blue dots represent type II peptides with p < 0.01. d) Mapping type II peptides onto the NMR-derived structure (light green) shows the PqqA binding pocket in PqqD that becomes more protected upon PqqA addition.
Figure 7
Figure 7
Proposed quaternary complex formation. Binding of SAM (cyan sticks) and PqqA (red) in PqqE (light purple) and PqqD (yellow) leads to reciprocal effects (highlighted in the raspberry shaded circle) on PqqD and PqqE, respectively. The model includes an extended conformation for the bound PqqA that stretches from its tethered site on PqqD toward the rSAM catalytic site. A second minor conformation detected for PqqDE is shown in parentheses, as this may play a role in the initiation of the substrate-dependent reductive cleavage of SAM within a quaternary complex.

Similar articles

Cited by

References

    1. Pawson T.; Nash P. Protein-Protein Interactions Define Specificity in Signal Transduction. Genes Dev. 2000, 14 (9), 1027–1047. 10.1101/gad.14.9.1027. - DOI - PubMed
    1. Wang J. Protein Recognition by Cell Surface Receptors: Physiological Receptors versus Virus Interactions. Trends Biochem. Sci. 2002, 27 (3), 122–126. 10.1016/S0968-0004(01)02038-2. - DOI - PubMed
    1. Montalbán-López M.; Scott T. A.; Ramesh S.; Rahman I. R.; Van Heel A. J.; Viel J. H.; Bandarian V.; Dittmann E.; Genilloud O.; Goto Y.; et al. New Developments in RiPP Discovery, Enzymology and Engineering. Nat. Prod. Rep. 2021, 38 (1), 130–239. 10.1039/D0NP00027B. - DOI - PMC - PubMed
    1. Grell T. A. J.; Goldman P. J.; Drennan C. L. SPASM and Twitch Domains in S-Adenosylmethionine (SAM) Radical Enzymes. J. Biol. Chem. 2015, 290 (7), 3964–3971. 10.1074/jbc.R114.581249. - DOI - PMC - PubMed
    1. Benjdia A.; Balty C.; Berteau O. Radical SAM Enzymes in the Biosynthesis of Ribosomally Synthesized and Post-Translationally Modified Peptides (RiPPs). Front. Chem. 2017, 5, 87.10.3389/fchem.2017.00087. - DOI - PMC - PubMed

LinkOut - more resources