. 2024 Jan 31;10(2):402-416.
doi: 10.1021/acscentsci.3c01250. eCollection 2024 Feb 28.

High-Performance Genetically Encoded Green Fluorescent Biosensors for Intracellular l-Lactate

Affiliations

High-Performance Genetically Encoded Green Fluorescent Biosensors for Intracellular l-Lactate

Saaya Hario et al. ACS Cent Sci. .

Abstract

l-Lactate is a monocarboxylate produced during the process of cellular glycolysis and has long generally been considered a waste product. However, studies in recent decades have provided new perspectives on the physiological roles of l-lactate as a major energy substrate and a signaling molecule. To enable further investigations of the physiological roles of l-lactate, we have developed a series of high-performance (ΔF/F = 15 to 30 in vitro), intensiometric, genetically encoded green fluorescent protein (GFP)-based intracellular l-lactate biosensors with a range of affinities. We evaluated these biosensors in cultured cells and demonstrated their application in an ex vivo preparation of Drosophila brain tissue. Using these biosensors, we were able to detect glycolytic oscillations, which we analyzed and mathematically modeled.


Conflict of interest statement

The authors declare no competing financial interest.

Figures
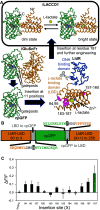
Figure 1
Figure 1
iLACCO design strategy. (A) Schematic representation of the overall strategy used to engineer iLACCO1. Structures shown are AlphaFold, models of iLACCO1, iGluSnFr, cpGFP, and E. coli LldR. The Zn2+ (purple sphere) and l-lactate (yellow sphere) were positioned based on a superposition with the sialic acid-binding homologue NanR (PDB ID: 6ON4). Gate post residues demarcate the beginning and end of the cpGFP domain. Pink spheres represent insertion sites that were initially tested. To remove the N-terminal DNA-binding domain, the region of DNA encoding the first 79 residues of LldR was removed. (B) Schematic representation of the 11 insertion site variants initially tested. Linker regions are represented in gray. Gate posts are represented with white text on a black background. (C) ΔF/F of each prototype biosensor, where cpGFP is inserted at the site of LldR-LBD indicated on the horizontal axis. A variant with the insertion of cpGFP at site 187, which also had a point mutation in the second linker (NDG to NEG) (187′; green bar), gave the largest absolute value of ΔF/F, so this protein was designated iLACCO0.1. n = 3 technical replicates, mean ± s.d.
Figure 2
Figure 2
Directed evolution of iLACCO1. (A) Schematic of directed evolution workflow. Starting from the template of iLACCO0.4, the full-length gene was randomly mutated by error-prone PCR and the resulting library was used to transform E. coli. Bright colonies were picked and cultured, and ΔF/F upon addition of 10 mM l-lactate was determined using crude protein extracts. The genes encoding the variants with the highest ΔF/F were used as the template for the next round. (B) ΔF/F rank plot representing all proteins tested during the directed evolution. For each round, tested variants are ranked from lowest to highest ΔF/F value from left to right. (C) Lineage of iLACCO variants from LldR-LBD. (D) Modeled structure, of iLACCO1 with the position of mutations indicated.
Figure 3
Figure 3
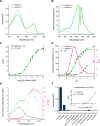
In vitro characterization of iLACCO1. (A) Absorbance spectra of iLACCO1 in the presence (10 mM) and absence of l-lactate. (B) Excitation (emission at 570 nm) and emission spectra (excitation at 450 nm) of iLACCO1 in the presence (95 mM) and the absence of l-lactate. (C) Dose–response curve of iLACCO1 for l-lactate. n = 3 technical replicates (mean ± s.d.). (D) pH titration curve of iLACCO1 in the presence (10 mM) and the absence of l-lactate. n = 3 technical replicates (mean ± s.d.). (E) Two-photon excitation spectra of iLACCO1 in the presence (10 mM) (represented in green dots) and absence of l-lactate (represented in gray dots) shown with the GM values label on the left Y axis. ΔF2/F2 is the ratio of the two-photon excitation spectra (represented in magenta dots) labeling the right Y axis. (F) Molecular specificity (9 mM each) of iLACCO1 and dose–response curve of iLACCO1 for d-lactate. n = 3 technical replicates (mean ± s.d.).
Figure 4
Figure 4
Characterization and demonstrations of iLACCO affinity series. (A–C) Excitation and emission spectra of iLACCO variants in the presence (95 mM) and the absence of l-lactate. n = 3 technical replicates (mean ± s.d.). (D) Dose–response curves of purified iLACCO1 variants upon treatment with l-lactate. n = 3 technical replicates (mean ± s.d.). (E) Dose–response curves of HeLa cells expressing iLACCO1 variants in response to treatments with extracellular l-lactate, as measured using flow cytometry. iLACCO1, 1.1, and 1.2 gave 50% of their maximal response at treatment concentrations of 4.8 mM, >10 mM, and 0.47 mM, respectively. n = 3 from independent experiments (mean ± s.d.), and around 1.0 × 10⁵ cells were analyzed for each independent experiment. (F) Fluorescent images of HeLa cells expressing iLACCO variants, pHuji, Green Lindoblum, and Laconic in the presence (10 mM) and absence of l-lactate. ΔF/F0 and ΔR/R0 are calculated from cells in the images shown. Scale bars represent 100 μm. F0 and R0 are determined as average fluorescence intensities of 15 data points before the addition of any reagent. (G) Glia cells of Drosophila melanogaster expressing iLACCO1. The image on the left is the whole brain (20× objective), and the images on the right are a close-up view before and after the addition of 10 mM l-lactate (63× objective). The grayscale image was inverted using ImageJ. The graph shows the ΔF/F0 of iLACCO1 (black) and DiLACCO1 (gray) during imaging. l-Lactate (10 mM) was added right after the snapshot at 1 min. n = 3, mean ± s. d.
Figure 5
Figure 5
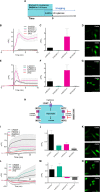
Imaging of iLACCO variants in starved and MCT-inhibited mammalian cells. (A) Schematic of imaging conditions of the starvation experiment. HeLa and HEK293 cells were starved in no-glucose medium for 2 to 3 h and were treated with a final concentration of 5 mM d-glucose at time = 0. Glucose-induced changes in the intracellular l-lactate concentration were observed with iLACCO1 variants expressed in HeLa (data shown in B–D) and HEK293 (data shown in E–G) cells. (B, E) Representative time courses show mean ± s.d. iLACCO1 (black, n = 6 and 3 cells for HeLa and HEK293, respectively), iLACCO1.1 (green, n = 5 and 2 cells for HeLa and HEK293, respectively), iLACCO1.2 (pink, n = 5 and 3 cells for HeLa and HEK293, respectively), and DiLACCO1 (gray, n = 5 and 4 cells for HeLa and HEK293, respectively) from a single independent experiment and pHuji (red, n = 21 and 12 cells for HeLa and HEK293, respectively). (C, F) Bar graphs show the mean ± s.d of maximum ΔF/F0 determined as the peak values within 5 min after the addition of d-glucose. iLACCO1 = (23, 6), iLACCO1,1 = (21, 6), iLACCO1.2 (20, 5), and DiLACCO1 = (10, 3), where (x, y) = (number of cells in total, number of independent experiments). (D, G) Representative images of HeLa cells expressing iLACCO1.2 (data shown in D) and HEK293 cells expressing iLACCO1.2 (data shown in G) before and after the treatment. Scale bars represent 100 μm. (H) Schematic of the MCT1,2 inhibitor experiment. The fluorescence intensity change was observed during the addition of AR-C155858 in HeLa (data shown in I–K) and HEK293 (data shown in L–N) cells. (I, L) Fluorescence response of iLACCO1 variants expressing HeLa and HEK293 cells upon treatment of MCT1,2 inhibitor AR-C155858. AR-C155858 (final 1 μM) was added at 0 min under a high glucose (25 mM) condition. Mean ± s.d. iLACCO1 (black, n = 4 and 4 cells for HeLa and HEK293, respectively), iLACCO1.1 (green, n = 2 and 5 cells for HeLa and HEK293, respectively), iLACCO1.2 (pink, n = 3 and 6 cells for HeLa and HEK293, respectively), and DiLACCO1 (gray, n = 4 and 4 cells for HeLa and HEK293, respectively) from a single independent experiment and pHuji (red, n = 13 and 20 cells for HeLa and HEK293, respectively). (J, M) Bar graphs show the mean ± s.d values of ΔF/F0 during time = 15 to 25 min for iLACCO1 = (22, 5), iLACCO1,1 = (16, 5), iLACCO1.2 (17, 4), and DiLACCO1 = (15, 5), where (x, y) = (number of cells in total, number of independent experiments). (K, M) Representative images of HeLa cells expressing iLACCO1 (data shown in K) and HEK293 cells expressing iLACCO1.1 (data shown in M) before and after the treatment. Scale bars represent 100 μm.
Figure 6
Figure 6
Characterization and modeling of l-lactate oscillations in HeLa cells. (A–D) Representative fluorescent images of HeLa cells expressing iLACCO1.2. (A, B) Snapshots from Movie S2 showing a whole field of view (A) and three cells at five time points (B). (C) Fluorescence response of iLACCO1.2 in selected cells versus time. Insets show the enlarged views of the time course at 240–260 s (indicated with red lines). (D) Experimental data of fluorescence versus time for 69 individual HeLa cells expressing iLACCO1.2, imaged in one experiment. HeLa cells were starved for around 4 h, and 5 mM d-glucose was used for treatment at t = 0. (E) 2D kernel density plot of instantaneous oscillatory frequencies. Oscillatory cells are defined as cells that oscillate at frequencies greater than 15 mHz (solid horizontal line). (F) Schematic representation of the model. The letters within circles indicate the metabolites of the model, the arrows indicate the fluxes, and the lines ending in circles or bars represent activation or inhibition, respectively. Gex is extracellular glucose, G is intracellular glucose, X is intermediates after the PFK reaction, Y is l-lactate and other intermediates after the PK reaction, Yex is extracellular lactate, A2 is ADP, and A3 is ATP. Model and figure adapted from Amemiya et al. (G) One example of simulated Y (l-lactate and other intermediates after the PK reaction concentration) with α fixed at a value of 0.25 (Supporting Information). (H) Distribution of the simulated instantaneous frequency. Oscillatory cells are defined as cells that oscillate at frequencies greater than 15 mHz (solid horizontal line).

References

    1. Levitt M. D.; Levitt D. G. Quantitative Evaluation of D-Lactate Pathophysiology: New Insights into the Mechanisms Involved and the Many Areas in Need of Further Investigation. Clin. Exp. Gastroenterol. 2020, 13, 321–337. 10.2147/CEG.S260600. - DOI - PMC - PubMed
    1. Hill A. V.; Kupalov P. Anaerobic and Aerobic Activity in Isolated Muscle. Proc. R. Soc. London B Biol. Sci. 1929, 105 (737), 313–322. 10.1098/rspb.1929.0045. - DOI
    1. Rabinowitz J. D.; Enerbäck S. Lactate: The Ugly Duckling of Energy Metabolism. Nat. Metab 2020, 2 (7), 566–571. 10.1038/s42255-020-0243-4. - DOI - PMC - PubMed
    1. Brooks G. A. Lactate as a Fulcrum of Metabolism. Redox Biol. 2020, 35, 10145410.1016/j.redox.2020.101454. - DOI - PMC - PubMed
    1. Magistretti P. J.; Allaman I. Lactate in the Brain: From Metabolic End-Product to Signalling Molecule. Nat. Rev. Neurosci. 2018, 19 (4), 235–249. 10.1038/nrn.2018.19. - DOI - PubMed

LinkOut - more resources