Can a Purposeful Walk Intervention with a Distance Goal Using an Activity Monitor Improve Individuals' Daily Activity and Function Post Total Hip Replacement Surgery. A Randomized Pilot Trial
- PMID: 38435675
- PMCID: PMC10907016
- DOI: 10.34133/cbsystems.0069
Can a Purposeful Walk Intervention with a Distance Goal Using an Activity Monitor Improve Individuals' Daily Activity and Function Post Total Hip Replacement Surgery. A Randomized Pilot Trial
Abstract
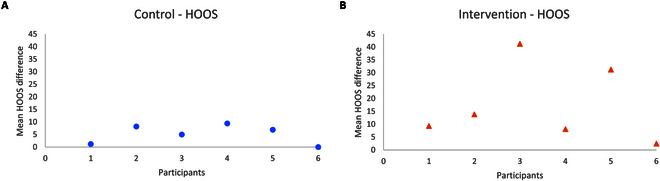
Individuals have increasingly high expectations of return to activity following total hip replacement (THR) surgery. The current literature demonstrates marked improvements in pain following THR. However, there is limited evidence showing objective improvement in daily activity. This randomized pilot trial aimed to determine the effect of an intervention where outdoor walking distance is used as a goal to increase daily activity of older adults using a commercial activity monitor at 3 to 6 months post THR. Findings suggested that the participants in the intervention group had higher activity levels after THR, compared to those in the control group. The Cohen's effect sizes were larger for the changes in the gait, Hip Disability and Osteoarthritis Outcome Score, and Psychosocial Impact of Assistive Devices Scale data in the intervention group in contrast to the control group. However, further research with a larger sample size is required to provide tangible evidence on the significance of the effect of the purposeful walk compared to step count.
Copyright © 2023 Shayan Bahadori et al.
Conflict of interest statement
Author contributions: SB was responsible for the conceptualization, writing, and management. SB wrote the initial draft of the manuscript. SC, JW, and IS all supervised the writing and helped to revise the manuscript. All authors read and approved the final manuscript.
Figures


Similar articles
-
A feasibility study to evaluate a purposeful walk intervention with a distance goal using a commercially available activity monitor in elderly people post total hip replacement surgery.J Rehabil Assist Technol Eng. 2023 Aug 22;10:20556683231195927. doi: 10.1177/20556683231195927. eCollection 2023 Jan-Dec. J Rehabil Assist Technol Eng. 2023. PMID: 37635835 Free PMC article.
-
Erratum.Mult Scler. 2016 Oct;22(12):NP9-NP11. doi: 10.1177/1352458515585718. Epub 2015 Jun 3. Mult Scler. 2016. PMID: 26041800
-
Hip-spine syndrome: the effect of total hip replacement surgery on low back pain in severe osteoarthritis of the hip.Spine (Phila Pa 1976). 2007 Sep 1;32(19):2099-102. doi: 10.1097/BRS.0b013e318145a3c5. Spine (Phila Pa 1976). 2007. PMID: 17762811 Clinical Trial.
-
Post-operative gait analysis in total hip replacement patients-a review of current literature and meta-analysis.Gait Posture. 2012 May;36(1):1-6. doi: 10.1016/j.gaitpost.2011.12.024. Epub 2012 Mar 10. Gait Posture. 2012. PMID: 22410129 Review.
-
Kinematic Gait Analysis After Primary Total Hip Replacement: A Systematic Review: Gait After Total Hip Replacement: A Systematic Review.Indian J Orthop. 2020 Apr 16;54(6):767-775. doi: 10.1007/s43465-020-00101-x. eCollection 2020 Nov. Indian J Orthop. 2020. PMID: 33133399 Free PMC article. Review.
Cited by
-
Comprehensive Stiffness Modeling and Evaluation of an Orthopedic Surgical Robot for Enhanced Cutting Operation Performance.Biomimetics (Basel). 2025 Jun 8;10(6):383. doi: 10.3390/biomimetics10060383. Biomimetics (Basel). 2025. PMID: 40558352 Free PMC article.
-
Promoting osteogenesis and bone regeneration employing icariin-loaded nanoplatforms.J Biol Eng. 2024 Apr 22;18(1):29. doi: 10.1186/s13036-024-00425-4. J Biol Eng. 2024. PMID: 38649969 Free PMC article. Review.
-
Comparative analysis of vision transformers and convolutional neural networks in osteoporosis detection from X-ray images.Sci Rep. 2024 Aug 3;14(1):18007. doi: 10.1038/s41598-024-69119-7. Sci Rep. 2024. PMID: 39097627 Free PMC article.
-
How Expectations and Trust in Telemedicine Contribute to Older Adults' Sense of Control: An Empirical Study.Healthcare (Basel). 2024 Aug 23;12(17):1685. doi: 10.3390/healthcare12171685. Healthcare (Basel). 2024. PMID: 39273710 Free PMC article.
-
Biosensor-Driven IoT Wearables for Accurate Body Motion Tracking and Localization.Sensors (Basel). 2024 May 10;24(10):3032. doi: 10.3390/s24103032. Sensors (Basel). 2024. PMID: 38793886 Free PMC article.
References
-
- National Joint Registry N. National Joint Registry 19th Annual Report. United Kingdom; 2022. - PubMed
-
- Ferguson RJ, Palmer AJ, Taylor A, Porter ML, Malchau H, Glyn-Jones S. Hip replacement. Lancet. 2018;392(10158):1662–1671. - PubMed
-
- Culliford D, Maskell J, Judge A, Cooper C, Prieto-Alhambra D, Arden NK, COASt Study Group . Future projections of total hip and knee arthroplasty in the UK: Results from the UK clinical practice research datalink. Osteoarthr Cartil. 2015;23(4):594–600. - PubMed
-
- Learmonth ID, Young C, Rorabeck C. The operation of the century: Total hip replacement. Lancet. 2007;370(9597):1508–1519. - PubMed
-
- Ewen AM, Stewart S, St Clair Gibson A, Kashyap SN, Caplan N. Post-operative gait analysis in total hip replacement patients-a review of current literature and meta-analysis. Gait Posture. 2012;36(1):1–6. - PubMed
LinkOut - more resources
Full Text Sources