

High-throughput characterization of the effect of sodium chloride and potassium chloride on 31 lactic acid bacteria and their co-cultures
- PMID: 38435689
- PMCID: PMC10904479
- DOI: 10.3389/fmicb.2024.1328416
High-throughput characterization of the effect of sodium chloride and potassium chloride on 31 lactic acid bacteria and their co-cultures
Abstract
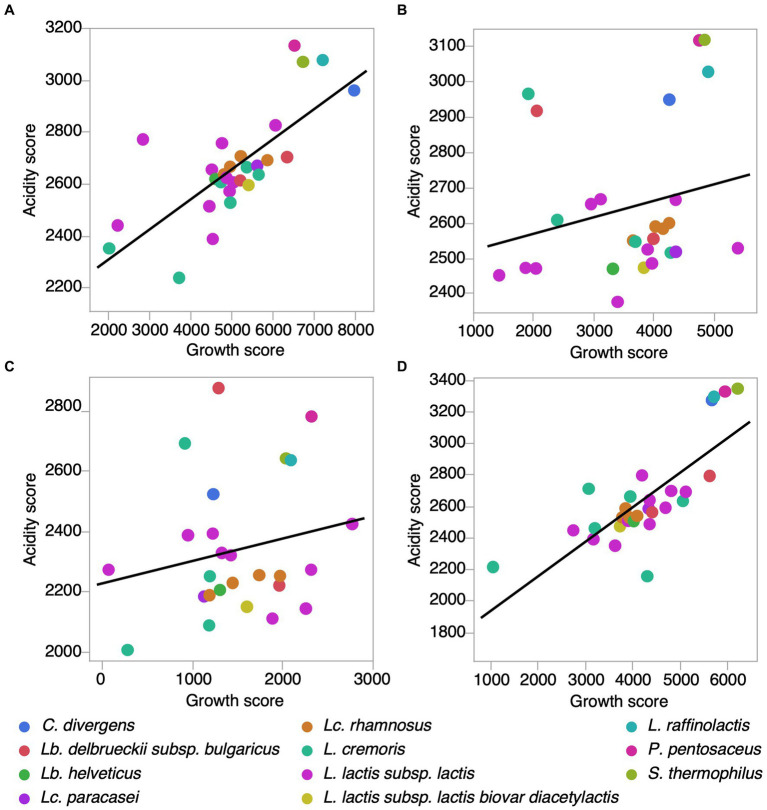
Salt (NaCl) is associated with a risk of hypertension and the development of coronary heart disease, so its consumption should be limited. However, salt plays a key role in the quality and safety of food by controlling undesirable microorganisms. Since studies have focused primarily on the effect of salts on the overall counts of the lactic acid bacteria (LAB) group, we have not yet understood how salt stress individually affects the strains and the interactions between them. In this study, we characterized the effect of sodium chloride (NaCl) and potassium chloride (KCl) on the growth and acidification of 31 LAB strains. In addition, we evaluated the effect of salts on a total of 93 random pairwise strain combinations. Strains and co-cultures were tested at 3% NaCl, 5% NaCl, and 3% KCl on solid medium using an automated approach and image analysis. The results showed that the growth of LAB was significantly reduced by up to 68% at 5% NaCl (p < 0.0001). For the co-cultures, a reduction of up to 57% was observed at 5% NaCl (p < 0.0001). However, acidification was less affected by salt stress, whether for monocultures or co-cultures. Furthermore, KCl had a lesser impact on both growth and acidification compared to NaCl. Indeed, some strains showed a significant increase in growth at 3% KCl, such as Lactococcus lactis subsp. lactis 74310 (23%, p = 0.01). More importantly, co-cultures appeared to be more resilient and had more varied responses to salt stress than the monocultures, as several cases of suppression of the significant effect of salts on acidification and growth were detected. Our results highlight that while salts can modulate microbial interactions, these latter can also attenuate the effect of salts on LAB.
Keywords: acidification; bacterial co-culture; high-throughput culturing; image analysis; lactic acid bacteria; microbial interactions; salt.
Copyright © 2024 Ndiaye, Fliss and Filteau.
Conflict of interest statement
The authors declare that the research was conducted in the absence of any commercial or financial relationships that could be construed as a potential conflict of interest.
Figures


Similar articles
-
The effect of sodium reduction with and without potassium chloride on the survival of Listeria monocytogenes in Cheddar cheese.J Dairy Sci. 2013 Oct;96(10):6172-85. doi: 10.3168/jds.2013-6675. Epub 2013 Aug 1. J Dairy Sci. 2013. PMID: 23910550
-
Lactic Acid Bacteria in Cheddar Cheese Made with Sodium Chloride, Potassium Chloride or Mixtures of the Two Salts.J Food Prot. 1995 Jan;58(1):62-69. doi: 10.4315/0362-028X-58.1.62. J Food Prot. 1995. PMID: 31121776
-
Fermentation profiles of Manzanilla-Aloreña cracked green table olives in different chloride salt mixtures.Food Microbiol. 2010 May;27(3):403-12. doi: 10.1016/j.fm.2009.11.015. Epub 2009 Nov 24. Food Microbiol. 2010. PMID: 20227606
-
Reduced-sodium cheeses: Implications of reducing sodium chloride on cheese quality and safety.Compr Rev Food Sci Food Saf. 2020 Mar;19(2):733-758. doi: 10.1111/1541-4337.12524. Epub 2020 Jan 20. Compr Rev Food Sci Food Saf. 2020. PMID: 33325171 Review.
-
Implications of salt and sodium reduction on microbial food safety.Crit Rev Food Sci Nutr. 2010 Mar;50(3):209-27. doi: 10.1080/10408391003626207. Crit Rev Food Sci Nutr. 2010. PMID: 20301012 Review.
Cited by
-
Healthier Traditional Green Natural Aloreña de Málaga Table Olives Through Mineral Chlorides Fortification During Packaging.Foods. 2024 Dec 16;13(24):4061. doi: 10.3390/foods13244061. Foods. 2024. PMID: 39767003 Free PMC article.
References
-
- Albarracín W., Sánchez I. C., Grau R., Barat J. M. (2011). Salt in food processing; usage and reduction: a review. Int. J. Food Sci. Technol. 46, 1329–1336. doi: 10.1111/j.1365-2621.2010.02492.x - DOI
-
- Alvarez M. M., Aguirre-Ezkauriatza E. J., Ramirez-Medrano A., Rodriguez-Sanchez A. (2010). Kinetic analysis and mathematical modeling of growth and lactic acid production of Lactobacillus casei var. rhamnosus in milk whey. J. Dairy Sci. 93, 5552–5560. doi: 10.3168/jds.2010-3116, PMID: - DOI - PubMed
-
- Andreevskaya M., Jaaskelainen E., Johansson P., Ylinen A., Paulin L., Bjorkroth J., et al. . (2018). Food spoilage-associated Leuconostoc, Lactococcus, and Lactobacillus species display different survival strategies in response to competition. Appl. Environ. Microbiol. 84:e00554-18. doi: 10.1128/AEM.00554-18, PMID: - DOI - PMC - PubMed
-
- Arboatti A. S., Olivares M. L., Sabbag N. G., Costa S. C., Zorrilla S. E., Sihufe G. A. (2014). The influence of sodium chloride reduction on physicochemical, biochemical, rheological and sensory characteristics of mozzarella cheese. Dairy Sci. Technol. 94, 373–386. doi: 10.1007/s13594-014-0169-2 - DOI
LinkOut - more resources
Full Text Sources
Molecular Biology Databases
Miscellaneous