Review
. 2023 Nov 9;9(2):e10601.
doi: 10.1002/btm2.10601. eCollection 2024 Mar.

A landscape of recent advances in lipid nanoparticles and their translational potential for the treatment of solid tumors

Affiliations
Review

A landscape of recent advances in lipid nanoparticles and their translational potential for the treatment of solid tumors

Radu A Paun et al. Bioeng Transl Med. .

Abstract

Lipid nanoparticles (LNPs) are biocompatible drug delivery systems that have found numerous applications in medicine. Their versatile nature enables the encapsulation and targeting of various types of medically relevant molecular cargo, including oligonucleotides, proteins, and small molecules for the treatment of diseases, such as cancer. Cancers that form solid tumors are particularly relevant for LNP-based therapeutics due to the enhanced permeation and retention effect that allows nanoparticles to accumulate within the tumor tissue. Additionally, LNPs can be formulated for both locoregional and systemic delivery depending on the tumor type and stage. To date, LNPs have been used extensively in the clinic to reduce systemic toxicity and improve outcomes in cancer patients by encapsulating chemotherapeutic drugs. Next-generation lipid nanoparticles are currently being developed to expand their use in gene therapy and immunotherapy, as well as to enable the co-encapsulation of multiple drugs in a single system. Other developments include the design of targeted LNPs to specific cells and tissues, and triggerable release systems to control cargo delivery at the tumor site. This review paper highlights recent developments in LNP drug delivery formulations and focuses on the treatment of solid tumors, while also discussing some of their current translational limitations and potential opportunities in the field.

Keywords: chemotherapy; drug combination; gene therapy; immunotherapy; lipid nanoparticles; solid tumors; translational limitations.


Conflict of interest statement

The authors declare no conflict of interest.

Figures

FIGURE 1
FIGURE 1
Schematic diagram illustrating the complexity of the tumor microenvironment and the various components that may contribute to nanoparticle sequestration. These include the enhanced permeation and retention effect (EPR) and the presence of scavenger cells such as tumor‐associated macrophages (TAM), as well as physical constraints such as a dense extracellular matrix (ECM). Created with BioRender.com.
FIGURE 2
FIGURE 2
(a) Venn diagram showing the number of reviews found by performing a SCOPUS search using the keywords “solid tumors,” “lipid nanoparticles,” “translational limitations,” and “drug combination,” suggesting that currently, there are no reviews in the literature that discuss these points together. (b) Graphical representation of the primary research papers included in this review by year.
FIGURE 3
FIGURE 3
(a) Major types of lipid nanoparticles and their development timeline. (b) Various physical routes that can be used for the delivery of lipid nanoparticle formulations to patients. (c) Decision tree outlining the process of selecting a drug delivery route for the treatment of solid tumors. Created with BioRender.com.
FIGURE 4
FIGURE 4
Topical and transdermal delivery of lipid nanoparticles. (a) Micrographs of skin cryosections after treatment with the curcumin‐loaded liposome–siRNA complex in the presence or absence of iontophoresis. Scale bar = 100 μm. (b) Confocal images after application of 6‐coumarin‐loaded LNP system. RTV13, raloxifene transferosomes (a), liposomes with raloxifene (b), and ethanolic PBS with raloxifene (c). (c) Fluorescence images for the permeation of raw Rh transdermal film (left column), and Rh‐TPGS‐Transferosomes Film (middle column) and Rh‐TPGS‐Transferosomes‐TAT Film (right column) through rat skin after 1 and 4 h. Magnification ×400. (d) In vivo skin permeation of LPPC/DiI or cream/DiI (red fluorescence) after treatment in BT474 tumor‐bearing mice. (e) Ex vivo LUT release pattern of the optimized elastic liposome formulations (OLEL1) as compared with conventional liposomes (lipo) and drug solution (DS) over a period of 24 h; and drug deposition study of OLEL1, lipo, and DS into the skin after 24 h of permeation study. Figures are reprinted with publishers' permission.
FIGURE 5
FIGURE 5
Respiratory track delivery of lipid nanoparticles. (a) Confocal images showing the cellular uptake of NBD‐DPPE‐labeled liposomes (lip) and CPP33‐lip by A549 cells (scale bars, 10 μm) and normal lung fibroblast MRC‐5 cells (scale bars, 50 μm). (b) Tumor distribution of folate‐PEG‐N‐(2‐hydroxypropyl)‐3‐trimethylammonium chloride chitosan (F‐PEG‐HTCC)‐coated SLN loaded with 25‐NBD‐cholesterol after administration by inhalation. Confocal images of control untreated M109 mouse lungs and coated fluorescent SLN‐treated mouse lungs. Red = vessels labeled with isolectinB4, green = 25‐NBD‐cholesterol labeling the SLNs, blue = Alexa Fluor 405‐grafted‐F‐PEG‐HTCC labeling the coating. (c) TEM images of uncoated and coated SLNs (scale bar is 200 nm, the white arrows are SLN cores). (d) In vitro release profiles of PTX in PBS at 37°C under sink conditions. (e) Representative ex vivo fluorescence images of major organs dissected from 4T1‐luc lung metastases‐bearing mice at 1, 24, and 48 h post inhalation of DiR‐labeled PS‐coated NPs. (f) High‐performance liquid chromatography measurements of the concentration of PS‐coated NPs labeled with RhoB in various tissues of the 4T1‐luc lung metastasis mice post inhalation. (g) NP‐cGAMP inhalation plus radiation (IR) is efficacious against 4T1 breast cancer lung metastases. NP‐cGAMP was inhaled 24 h after each IR for a total of three inhalations. IVIS images of three representative animals from each treatment group. Figures are reprinted with publishers' permission.
FIGURE 6
FIGURE 6
Intratumoral delivery of lipid nanoparticles. (a) Intratumoral injection of CLN/DNA enhancing the DC activation in tumor‐draining lymph nodes in vivo. Fluorescence images of the brain, heart, lung, liver, spleen, kidney, and tumor harvested from CT26 tumor‐bearing mice at 48 h after IT injection of PBS, CLN‐NH2/DiD, CLN/DiD, CLN‐NH2/DiD/DNA, and CLN/DiD/DNA. The dose of plasmid DNA was 369 μg/kg per injection. All nanoparticles were labeled with DiD. (b) Protective effect of piTRL treatment with laser irradiation against lung metastasis of cancer. On day 28 of the first transplanted tumor challenge, mice treated with iTRL or piTRL and laser irradiation were further intravenously inoculated with CT‐26 and B16 cells, respectively. PBS‐ and poly I:C‐treated mice were also injected with the cancer cells as a control. (c) Co‐delivery of paclitaxel (PTX) and IL‐12‐expressing adenoviral vector (Ad5). Transmission electron micrograph (TEM) images of naked Ad5 (left) and AL/Ad5/PTX (right). Scale bar = 100 nm. (d) Syringe‐injected post‐surgical gel depot (iGel) for localized treatment, composed of multi nanodomain vesicles (MNDV) and cationic liposomes. (e) Liposomal polymeric gel (nLG) with combination delivery of immunotherapy drugs (TGF‐β inhibitor and IL‐2), showing controlled release clearance and biodistribution in healthy animals. Whole body biodistribution: significantly higher amounts of rhodamine were detected in the major organs of nLG‐treated animals (top panel) compared with animals injected with free dye (bottom panel). Data are presented as mean percentage of initial dose given. Time‐dependent accumulation in subcutaneous tumor: cumulative rhodamine tumor penetration (red) after B16 peritumoral injection in B6 mice. Peritumoral tissue was collected to quantify the remaining dose of nLG surrounding the tumor (black). Figures are reprinted with publishers' permission.
FIGURE 7
FIGURE 7
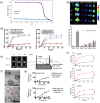
Passive intravenous delivery of lipid nanoparticles. (a) Biodistribution and anti‐metastatic effects of liposomal immunotherapy, using co‐delivered chidamide (CHI) and BMD‐202. Representative fluorescence images of mice at different time points; red circle shows the site of the tumor. (b) Quantification of average signal intensity of various mouse organs showing the time‐dependent accumulation of LNPs into the tumor tissue. (c) CHI/BMS‐202@lipF‐mediated anti‐metastasis effect in the 4T1 lung metastasis model showing the number of lung nodules. (d) Delivery of STING agonist cyclic dinucleotides (CDN) using lipid nanodiscs (LND). Coarse‐grained simulation snapshots of an LND (left) and a liposome (right), both with a diameter of 40 nm, before (t = 0 ns) and after (t = 1750 ns) being pulled through a 20 nm pore. (e) LND‐CDN demonstrates superior passive diffusion compared with liposome‐CDN in vitro. Shown is the percentage of particles detected in the receiver chamber after 24 h after diffusion through a membrane with pore sizes of 50 and 200 nm. (f) Representative whole tumor (MC38) cross sections and enlarged views of tumor vessels from mice treated with Cy5‐labeled LND or liposome (yellow). Scale bars = 50 μm. (g) Mean fluorescence intensities averaged from four tumor regions of interest per mouse. (h) Representative maximum intensity projections of whole mice with tumors identified with a white arrow. (i) Phase I clinical trial of LNP‐encapsulated tumor suppressor gene, showing DC‐TUSC2 metabolic tumor response in a metastatic lung cancer patient. The first image is the pretreatment PET scan. Second image is the post‐treatment PET scan performed 20 days following the fourth dose of DC‐TUSC2. Figures are reprinted with publishers' permission.
FIGURE 8
FIGURE 8
Intravenous delivery of targeted lipid nanoparticles. (a) Various types of targeting moieties that can be grafted onto lipid nanoparticles. (b) TEM images showing doxorubicin‐loaded LNPs functionalized with the targeting ligands cyclic RGDfK and peptide‐22. (c) Ex vivo immunofluorescence images showing the co‐localization of targeted and non‐targeted LRRs with CD206 and PD‐L1 markers. (d) Efficacy and intratumoral accumulation of fluorescently labeled aptamer‐based anti‐CD44 and anti‐PD‐L1 targeted and non‐targeted liposomes containing doxorubicin and siRNA against IDO1. (e) Mechanism of action of the PEG‐FA‐Lip construct for chemoimmunotherapy. Figures are reprinted with publishers' permission.
FIGURE 9
FIGURE 9
Triggered release delivery of lipid nanoparticles. (a) Delivery of bleomycin with pH‐sensitive liposomes quantified via pyranine release from liposomes modified with or without CHexPG‐PE at 37°C across a range of pH values. (b) Fluorescence images and their quantification of excised organs and tumors at 24 h post‐injection of L‐R, DOXL‐R, DFXL‐R, and DOX‐DFXL‐R. (c) The release profile of imiquimod (IQ), anti‐PD‐L1 (PL), and IL2 (IL) from pH responsive Treg‐tagged liposomes. (d) Drug release profiles from HLBBRT in different conditions. (e) Liposomal carrier system for tumor cell lysate with photothermal irradiation‐triggered CO2 bubble generation. (f) Morphologies of BG‐TSLs and DOX‐BG‐TSLs monitored by cryoTEM. The arrow denotes DOX encapsulation. Scale bar = 100 nm. (g) Release of DOX or TCL from TSLs or BG‐TSLs with or without NIR irradiation (2 W/cm2). Figures are reprinted with publishers' permission.
FIGURE 10
FIGURE 10
Schematic diagram of transport and targeting constraints on the development of lipid nanoparticles for the treatment of solid tumors. Future nanoparticle designs need to consolidate multiple types of barriers that limit the effectiveness of the encapsulated therapeutics as, for example, adding targeting ligands on the surface of nanoparticles can result in the recognition of nanoparticles by macrophages and lead to their accelerated clearance in the liver or spleen. Created with BioRender.com.

Similar articles

Cited by

References

    1. Siegel RL, Miller KD, Wagle NS, Jemal A. Cancer statistics, 2023. CA‐Cancer J Clin. 2023;73(1):17‐48. - PubMed
    1. Collaborators GBDUHC. Measuring universal health coverage based on an index of effective coverage of health services in 204 countries and territories, 1990‐2019: a systematic analysis for the Global Burden of Disease Study 2019. Lancet. 2020;396(10258):1250‐1284. - PMC - PubMed
    1. Welch HG, Mazer BL, Adamson AS. The rapid rise in cutaneous melanoma diagnoses. N Engl J Med. 2021;384(1):72‐79. - PubMed
    1. Chen L, Zheng Y, Yu K, et al. Changing causes of death in persons with haematological cancers 1975‐2016. Leukemia. 2022;36(7):1850‐1860. - PMC - PubMed
    1. Hou JZ, Ye JC, Pu JJ, et al. Novel agents and regimens for hematological malignancies: recent updates from 2020 ASH annual meeting. J Hematol Oncol. 2021;14(1):66. - PMC - PubMed

LinkOut - more resources