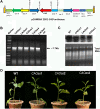
Reduced expression of chlorophyllide a oxygenase (CAO) decreases the metabolic flux for chlorophyll synthesis and downregulates photosynthesis in tobacco plants
- PMID: 38435853
- PMCID: PMC10901765
- DOI: 10.1007/s12298-023-01395-5
Reduced expression of chlorophyllide a oxygenase (CAO) decreases the metabolic flux for chlorophyll synthesis and downregulates photosynthesis in tobacco plants
Abstract
Chlorophyll b is synthesized from chlorophyllide a, catalyzed by chlorophyllide a oxygenase (CAO). To examine whether reduced chlorophyll b content regulates chlorophyll (Chl) synthesis and photosynthesis, we raised CAO transgenic tobacco plants with antisense CAO expression, which had lower chlorophyll b content and, thus, higher Chl a/b ratio. Further, these plants had (i) lower chlorophyll b and total Chl content, whether they were grown under low or high light; (ii) decreased steady-state levels of chlorophyll biosynthetic intermediates, due, perhaps, to a feedback-controlled reduction in enzyme expressions/activities; (iii) reduced electron transport rates in their intact leaves, and reduced Photosystem (PS) I, PS II and whole chain electron transport activities in their isolated thylakoids; (iv) decreased carbon assimilation in plants grown under low or high light. We suggest that reduced synthesis of chlorophyll b by antisense expression of CAO, acting at the end of Chl biosynthesis pathway, downregulates the chlorophyll b biosynthesis, resulting in decreased Chl b, total chlorophylls and increased Chl a/b. We have previously shown that the controlled up-regulation of chlorophyll b biosynthesis and decreased Chl a/b ratio by over expression of CAO enhance the rates of electron transport and CO2 assimilation in tobacco. Conversely, our data, presented here, demonstrate that-antisense expression of CAO in tobacco, which decreases Chl b biosynthesis and increases Chl a/b ratio, leads to reduced photosynthetic electron transport and carbon assimilation rates, both under low and high light. We conclude that Chl b modulates photosynthesis; its controlled down regulation/ up regulation decreases/ increases light-harvesting, rates of electron transport, and carbon assimilation.
Supplementary information: The online version contains supplementary material available at 10.1007/s12298-023-01395-5.
Keywords: Chlorophyll b; Chlorophyllide a oxygenase; Electron transport; Light intensity; Photosynthesis.
© Prof. H.S. Srivastava Foundation for Science and Society 2023. Springer Nature or its licensor (e.g. a society or other partner) holds exclusive rights to this article under a publishing agreement with the author(s) or other rightsholder(s); author self-archiving of the accepted manuscript version of this article is solely governed by the terms of such publishing agreement and applicable law.
Conflict of interest statement
Conflict of interestThe authors declare no competing financial and non-financial interests.
Figures


Similar articles
-
Light intensity-dependent modulation of chlorophyll b biosynthesis and photosynthesis by overexpression of chlorophyllide a oxygenase in tobacco.Plant Physiol. 2012 May;159(1):433-49. doi: 10.1104/pp.112.195859. Epub 2012 Mar 14. Plant Physiol. 2012. PMID: 22419827 Free PMC article.
-
Light-dependent regulation of chlorophyll b biosynthesis in chlorophyllide a oxygenase overexpressing tobacco plants.Biochem Biophys Res Commun. 2005 Jan 14;326(2):466-71. doi: 10.1016/j.bbrc.2004.11.049. Biochem Biophys Res Commun. 2005. PMID: 15582600
-
Effect of the Enhanced Production of Chlorophyll b on the Light Acclimation of Tomato.Int J Mol Sci. 2023 Feb 8;24(4):3377. doi: 10.3390/ijms24043377. Int J Mol Sci. 2023. PMID: 36834789 Free PMC article.
-
Organization of chlorophyll biosynthesis and insertion of chlorophyll into the chlorophyll-binding proteins in chloroplasts.Photosynth Res. 2015 Dec;126(2-3):189-202. doi: 10.1007/s11120-015-0154-5. Epub 2015 May 9. Photosynth Res. 2015. PMID: 25957270 Review.
-
Regulatory and retrograde signaling networks in the chlorophyll biosynthetic pathway.J Integr Plant Biol. 2025 Apr;67(4):887-911. doi: 10.1111/jipb.13837. Epub 2025 Jan 24. J Integr Plant Biol. 2025. PMID: 39853950 Free PMC article. Review.
Cited by
-
Light quality affects chlorophyll biosynthesis and photosynthetic performance in Antarctic Chlamydomonas.Photosynth Res. 2025 Jan 20;163(1):9. doi: 10.1007/s11120-024-01127-0. Photosynth Res. 2025. PMID: 39832016
-
Chlorophyll and Carotenoid Metabolism Varies with Growth Temperatures among Tea Genotypes with Different Leaf Colors in Camellia sinensis.Int J Mol Sci. 2024 Oct 7;25(19):10772. doi: 10.3390/ijms251910772. Int J Mol Sci. 2024. PMID: 39409101 Free PMC article.
References
-
- Anderson J, Chow W, Goodchild D. Thylakoid membrane organization in sun/shade acclimation. Aust J Plant Physiol. 1988;15:11–26.
LinkOut - more resources
Full Text Sources
