. 2024 Feb 29:12:e16998.
doi: 10.7717/peerj.16998. eCollection 2024.

Modeling target-density-based cull strategies to contain foot-and-mouth disease outbreaks

Affiliations

Modeling target-density-based cull strategies to contain foot-and-mouth disease outbreaks

Rachel L Seibel et al. PeerJ. .

Abstract

Total ring depopulation is sometimes used as a management strategy for emerging infectious diseases in livestock, which raises ethical concerns regarding the potential slaughter of large numbers of healthy animals. We evaluated a farm-density-based ring culling strategy to control foot-and-mouth disease (FMD) in the United Kingdom (UK), which may allow for some farms within rings around infected premises (IPs) to escape depopulation. We simulated this reduced farm density, or "target density", strategy using a spatially-explicit, stochastic, state-transition algorithm. We modeled FMD spread in four counties in the UK that have different farm demographics, using 740,000 simulations in a full-factorial analysis of epidemic impact measures (i.e., culled animals, culled farms, and epidemic length) and cull strategy parameters (i.e., target farm density, daily farm cull capacity, and cull radius). All of the cull strategy parameters listed above were drivers of epidemic impact. Our simulated target density strategy was usually more effective at combatting FMD compared with traditional total ring depopulation when considering mean culled animals and culled farms and was especially effective when daily farm cull capacity was low. The differences in epidemic impact measures among the counties are likely driven by farm demography, especially differences in cattle and farm density. To prevent over-culling and the associated economic, organizational, ethical, and psychological impacts, the target density strategy may be worth considering in decision-making processes for future control of FMD and other diseases.

Keywords: Disease modeling; Emerging infectious diseases; Farm demography; Foot-and-mouth disease; Host density; Livestock disease; Ring culling.


Conflict of interest statement

Amanda J. Meadows is employed by Ginkgo Bioworks.

Figures

Figure 1
Figure 1. Map of counties in the United Kingdom in 2001.
The shaded polygons indicate counties that were used in this study (Aberdeenshire, Cumbria, Devon, and North Yorkshire). The different colors indicate different counties. The county names are labeled next to each shaded region. Source: Office for National Statistics licensed under the Open Government Licence v.3. Contains OS data © Crown copyright and database right (2023).
Figure 2
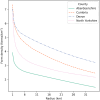
Figure 2. Mean farm density (farms/km2) against radius around each farm (km) for Aberdeenshire, Cumbria, Devon, and North Yorkshire in the UK.
The x-axis starts at 1 km.
Figure 3
Figure 3. Effects of target farm density, daily farm cull capacity, and cull radius on culled animals, culled farms, and epidemic length for simulated FMD epidemics in Aberdeenshire, United Kingdom.
For panels (A–C), we present cumulative outbreak measures across cull radius (km) and target farm density (farms/km2) for different levels of daily cull capacity (farms/day). A target farm density of 0 farms/km2 represents total ring depopulation whilst 0.4 farms/km2 represents culling the fewest farms in each ring. Different marker styles and colors represent different target farm densities. We show six levels of target farm density (0, 0.05, 0.1, 0.15, 0.2, 0.4 farms/km2), four levels of daily cull capacity (5, 10, 20, 100 farms/day) and seven levels of cull radius (0, 0.5, 1, 2, 3, 4, 5 km) for a total of 168 stochastic simulation scenarios for Aberdeenshire. Each scenario was repeated 1,000 times. (A) Total animals (cattle + sheep) culled in thousands for each scenario where each point represents the mean from 1,000 simulations ± standard error. (B) Total farms culled for each scenario where each point represents the mean from 1,000 simulations ± standard error. (C) Epidemic length in days for each scenario where each point represents the mean from 1,000 simulations ± standard error.
Figure 4
Figure 4. Effects of target farm density, daily farm cull capacity, and cull radius on culled animals, culled farms, and epidemic length for simulated FMD epidemics in Cumbria, UK.
For panels (A–C), we present cumulative outbreak measures across cull radius (km) and target farm density (farms/km2) for different levels of daily cull capacity (farms/day). A target farm density of 0 farms/km2 represents total ring depopulation whilst 0.4 farms/km2 represents culling the fewest farms in each ring. Different marker styles and colors represent different target farm densities. We show six levels of target farm density (0, 0.05, 0.1, 0.15, 0.2, 0.4 farms/km2), four levels of daily cull capacity (5, 10, 20, 100 farms/day) and seven levels of cull radius (0, 0.5, 1, 2, 3, 4, 5 km) for a total of 168 stochastic simulation scenarios for Cumbria. Each scenario was repeated 1,000 times. (A) Total animals culled in thousands for each scenario where each point represents the mean from 1,000 simulations ± standard error. (B) Total farms culled for each scenario where each point represents the mean from 1,000 simulations ± standard error. (C) Epidemic length in days for each scenario where each point represents the mean from 1,000 simulations ± standard error.
Figure 5
Figure 5. Effects of target farm density, daily farm cull capacity, and cull radius on culled animals, culled farms, and epidemic length for simulated FMD epidemics in Devon, UK.
For panels (A–C), we present cumulative outbreak measures across cull radius (km) and target farm density (farms/km2) for different levels of daily cull capacity (farms/day). A target farm density of 0 farms/km2 represents total ring depopulation whilst 0.4 farms/km2 represents culling the fewest farms in each ring. Different marker styles and colors represent different target farm densities. We show six levels of target farm density (0, 0.05, 0.1, 0.15, 0.2, 0.4 farms/km2), four levels of daily cull capacity (5, 10, 20, 100 farms/day) and seven levels of cull radius (0, 0.5, 1, 2, 3, 4, 5 km) for a total of 168 stochastic simulation scenarios for Devon. Each scenario was repeated 1,000 times. (A) Total animals culled in thousands for each scenario where each point represents the mean from 1,000 simulations ± standard error. (B) Total farms culled for each scenario where each point represents the mean from 1,000 simulations ± standard error. (C) Epidemic length in days for each scenario where each point represents the mean from 1,000 simulations ± standard error.
Figure 6
Figure 6. Effects of target farm density, daily farm cull capacity, and cull radius on culled animals, culled farms, and epidemic length for simulated FMD epidemics in North Yorkshire, UK.
For panels (A–C), we present cumulative outbreak measures across cull radius (km) and target farm density (farms/km2) for different levels of daily cull capacity (farms/day). A target farm density of 0 farms/km2 represents total ring depopulation whilst 0.4 farms/km2 represents culling the fewest farms in each ring. Different marker styles and colors represent different target farm densities. We show six levels of target farm density (0, 0.05, 0.1, 0.15, 0.2, 0.4 farms/km2), four levels of daily cull capacity (5, 10, 20, 100 farms/day) and seven levels of cull radius (0, 0.5, 1, 2, 3, 4, 5 km) for a total of 168 stochastic simulation scenarios for North Yorkshire. Each scenario was repeated 1,000 times. (A) Total animals culled in thousands for each scenario where each point represents the mean from 1,000 simulations ± standard error. (B) Total farms culled for each scenario where each point represents the mean from 1,000 simulations ± standard error. (C) Epidemic length in days for each scenario where each point represents the mean from 1,000 simulations ± standard error.

Similar articles

Cited by

References

    1. Barnett PV, Carabin H. A review of emergency foot-and-mouth disease (FMD) vaccines. Vaccine. 2002;20:1505–1514. doi: 10.1016/s0264-410x(01)00503-5. - DOI - PubMed
    1. Bessell PR, Shaw DJ, Savill NJ, Woolhouse MEJ. Statistical modeling of holding level susceptibility to infection during the 2001 foot and mouth disease epidemic in Great Britain. International Journal of Infectious Diseases. 2010;14:e210–e215. doi: 10.1016/j.ijid.2009.05.003. - DOI - PubMed
    1. Bouma A, Elbers ARW, Dekker A, Koeijer ADe, Bartels C, Vellema P, van der Wal P, van Rooij EMA, Pluimers FH, de Jong MCM. The foot-and-mouth disease epidemic in The Netherlands in 2001. Preventive Veterinary Medicine. 2003;57(3):155–166. doi: 10.1016/s0167-5877(02)00217-9. - DOI - PubMed
    1. Chis Ster I, Ferguson NM. Transmission parameters of the 2001 foot and mouth epidemic in Great Britain. PLOS ONE. 2007;2(6):e502. doi: 10.1371/journal.pone.0000502. - DOI - PMC - PubMed
    1. Department for Environment, Food and Rural Affairs of the United Kingdom Foot and mouth disease control strategy for Great Britain. 2011. https://assets.publishing.service.gov.uk/government/uploads/system/uploa.... [3 November 2020]. https://assets.publishing.service.gov.uk/government/uploads/system/uploa...

LinkOut - more resources