

Neuroscience meets behavior: A systematic literature review on magnetic resonance imaging of the brain combined with real-world digital phenotyping
- PMID: 38436603
- PMCID: PMC10911114
- DOI: 10.1002/hbm.26620
Neuroscience meets behavior: A systematic literature review on magnetic resonance imaging of the brain combined with real-world digital phenotyping
Abstract
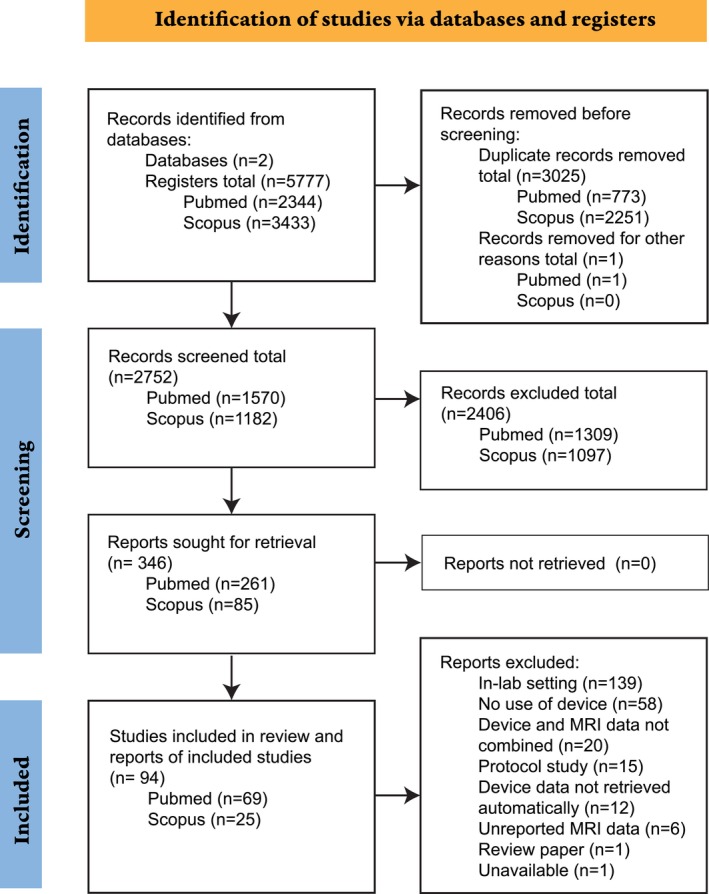
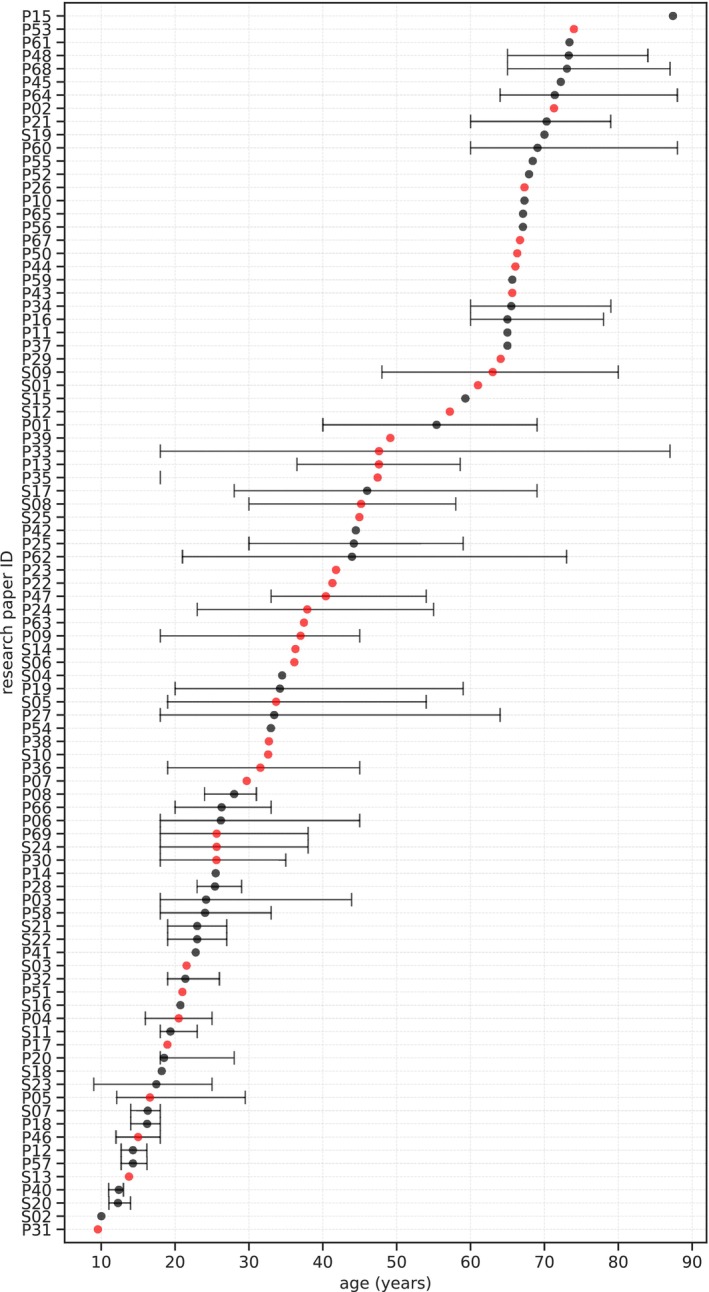
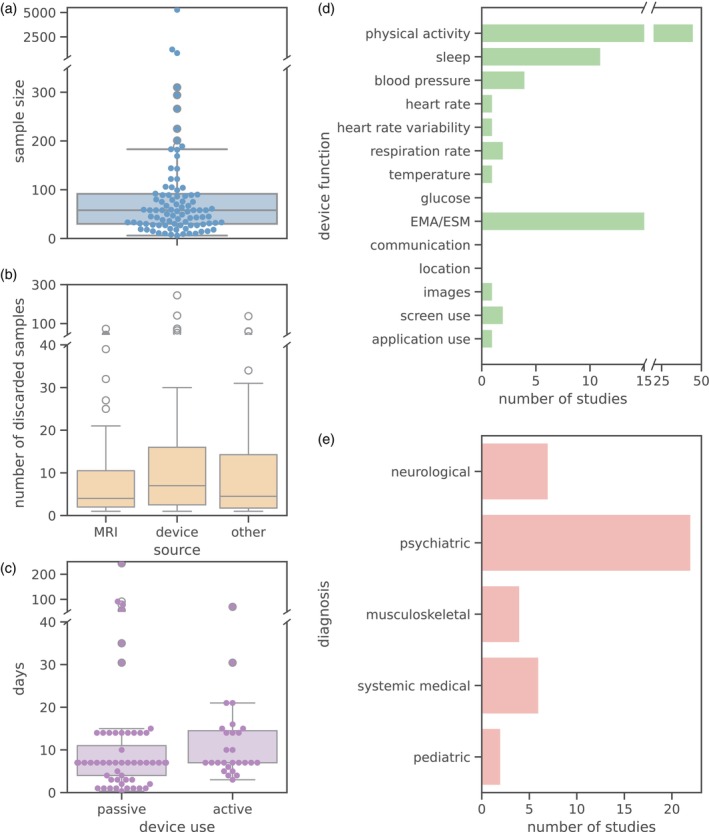
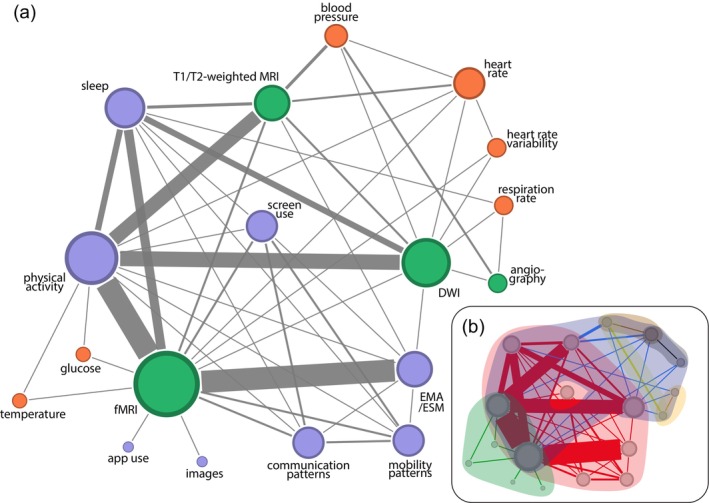
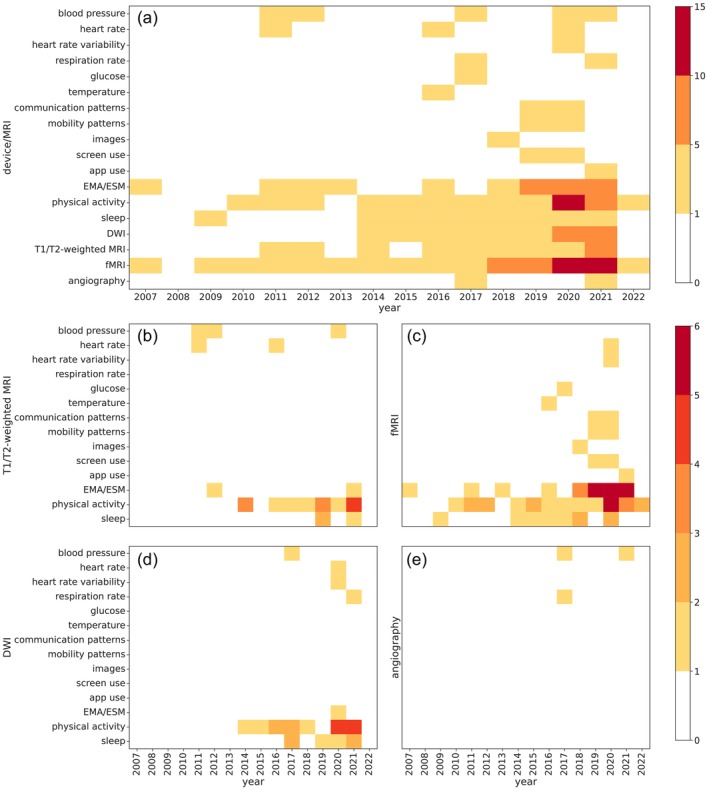
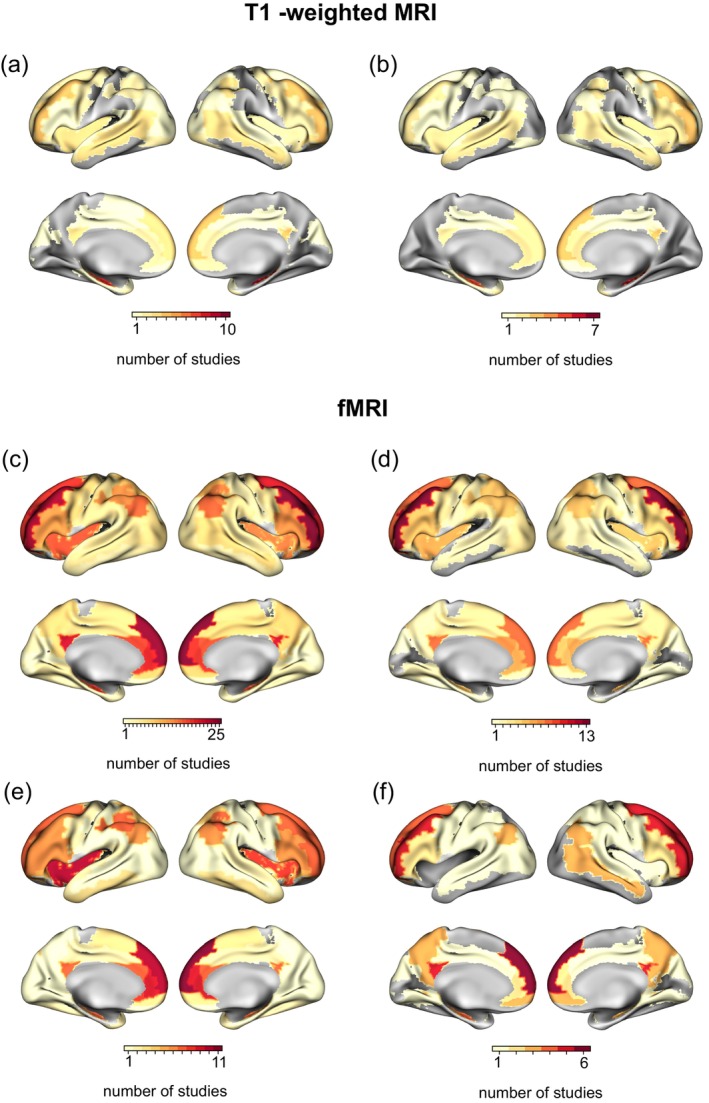
A primary goal of neuroscience is to understand the relationship between the brain and behavior. While magnetic resonance imaging (MRI) examines brain structure and function under controlled conditions, digital phenotyping via portable automatic devices (PAD) quantifies behavior in real-world settings. Combining these two technologies may bridge the gap between brain imaging, physiology, and real-time behavior, enhancing the generalizability of laboratory and clinical findings. However, the use of MRI and data from PADs outside the MRI scanner remains underexplored. Herein, we present a Preferred Reporting Items for Systematic Reviews and Meta-Analysis systematic literature review that identifies and analyzes the current state of research on the integration of brain MRI and PADs. PubMed and Scopus were automatically searched using keywords covering various MRI techniques and PADs. Abstracts were screened to only include articles that collected MRI brain data and PAD data outside the laboratory environment. Full-text screening was then conducted to ensure included articles combined quantitative data from MRI with data from PADs, yielding 94 selected papers for a total of N = 14,778 subjects. Results were reported as cross-frequency tables between brain imaging and behavior sampling methods and patterns were identified through network analysis. Furthermore, brain maps reported in the studies were synthesized according to the measurement modalities that were used. Results demonstrate the feasibility of integrating MRI and PADs across various study designs, patient and control populations, and age groups. The majority of published literature combines functional, T1-weighted, and diffusion weighted MRI with physical activity sensors, ecological momentary assessment via PADs, and sleep. The literature further highlights specific brain regions frequently correlated with distinct MRI-PAD combinations. These combinations enable in-depth studies on how physiology, brain function and behavior influence each other. Our review highlights the potential for constructing brain-behavior models that extend beyond the scanner and into real-world contexts.
Keywords: EMA; MRI; actigraph; ambulatory assessment; diffusion tensor imaging; diffusion weighted imaging; digital phenotyping; ecological momentary assessments; fMRI; functional magnetic resonance imaging; magnetic resonance imaging; physical activity; physiology; portable device; sleep; smart monitoring; smartphone; smartwatch; structural magnetic resonance imaging; wearable.
© 2024 The Authors. Human Brain Mapping published by Wiley Periodicals LLC.
Conflict of interest statement
The authors have declared no competing interests.
Figures
Similar articles
-
Magnetic resonance perfusion for differentiating low-grade from high-grade gliomas at first presentation.Cochrane Database Syst Rev. 2018 Jan 22;1(1):CD011551. doi: 10.1002/14651858.CD011551.pub2. Cochrane Database Syst Rev. 2018. PMID: 29357120 Free PMC article.
-
Regional cerebral blood flow single photon emission computed tomography for detection of Frontotemporal dementia in people with suspected dementia.Cochrane Database Syst Rev. 2015 Jun 23;2015(6):CD010896. doi: 10.1002/14651858.CD010896.pub2. Cochrane Database Syst Rev. 2015. PMID: 26102272 Free PMC article.
-
Comparison of self-administered survey questionnaire responses collected using mobile apps versus other methods.Cochrane Database Syst Rev. 2015 Jul 27;2015(7):MR000042. doi: 10.1002/14651858.MR000042.pub2. Cochrane Database Syst Rev. 2015. PMID: 26212714 Free PMC article.
-
Contrast-enhanced ultrasound using SonoVue® (sulphur hexafluoride microbubbles) compared with contrast-enhanced computed tomography and contrast-enhanced magnetic resonance imaging for the characterisation of focal liver lesions and detection of liver metastases: a systematic review and cost-effectiveness analysis.Health Technol Assess. 2013 Apr;17(16):1-243. doi: 10.3310/hta17160. Health Technol Assess. 2013. PMID: 23611316 Free PMC article.
-
Eliciting adverse effects data from participants in clinical trials.Cochrane Database Syst Rev. 2018 Jan 16;1(1):MR000039. doi: 10.1002/14651858.MR000039.pub2. Cochrane Database Syst Rev. 2018. PMID: 29372930 Free PMC article.
Cited by
-
Longitudinal single-subject neuroimaging study reveals effects of daily environmental, physiological, and lifestyle factors on functional brain connectivity.PLoS Biol. 2024 Oct 8;22(10):e3002797. doi: 10.1371/journal.pbio.3002797. eCollection 2024 Oct. PLoS Biol. 2024. PMID: 39378200 Free PMC article.
References
-
- Acosta, J. N. , Falcone, G. J. , Rajpurkar, P. , & Topol, E. J. (2022). Multimodal biomedical ai. Nature Medicine, 28(9), 1773–1784. - PubMed
-
- Ahmad, A. , Rasul, T. , Yousaf, A. , & Zaman, U. (2020). Understanding factors influencing elderly diabetic patients' continuance intention to use digital health wearables: Extending the technology acceptance model (TAM). Journal of Open Innovation: Technology, Market, and Complexity, 6(3), 81.
-
- Ahn, Y.‐Y. , Bagrow, J. P. , & Lehmann, S. (2010). Link communities reveal multiscale complexity in networks. Nature, 466(7307), 761–764. - PubMed
-
- Assaf, Y. , & Pasternak, O. (2008). Diffusion tensor imaging (dti)‐based white matter mapping in brain research: A review. Journal of Molecular Neuroscience, 34, 51–61. - PubMed
Publication types
MeSH terms
Grants and funding
LinkOut - more resources
Full Text Sources
Medical
Research Materials
Miscellaneous
