

Trends of mortality rate in patients with congenital heart defects in Germany-analysis of nationwide data of the Federal Statistical Office of Germany
- PMID: 38436738
- PMCID: PMC11026207
- DOI: 10.1007/s00392-023-02370-6
Trends of mortality rate in patients with congenital heart defects in Germany-analysis of nationwide data of the Federal Statistical Office of Germany
Abstract
Background: Congenital heart defects (CHD) are still associated with an increased morbidity and mortality. The aim of this study was to analyze trends of mortality rates in patients with CHD between 1998 and 2018 in Germany.
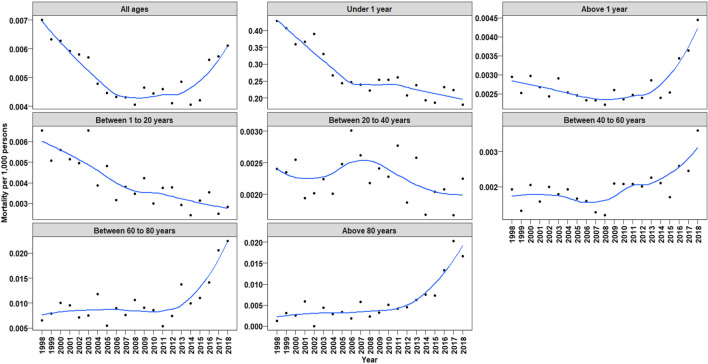
Methods: Data of registered deaths with an underlying diagnosis of CHD were used to evaluate annual mortality between 1998 and 2018. Polynomial regressions were performed to assess annual changes in CHD-associated mortality rates by age groups.
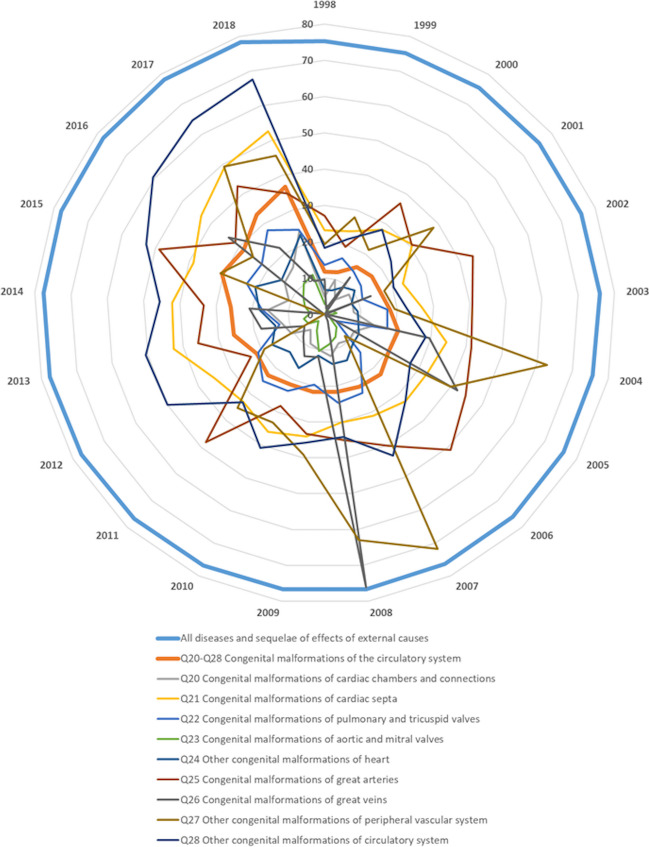
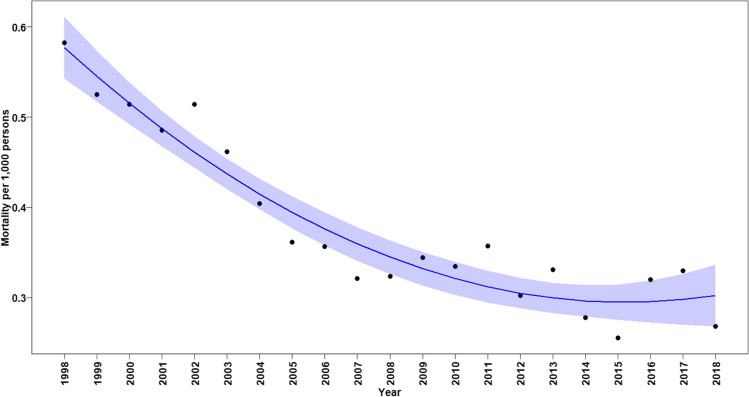
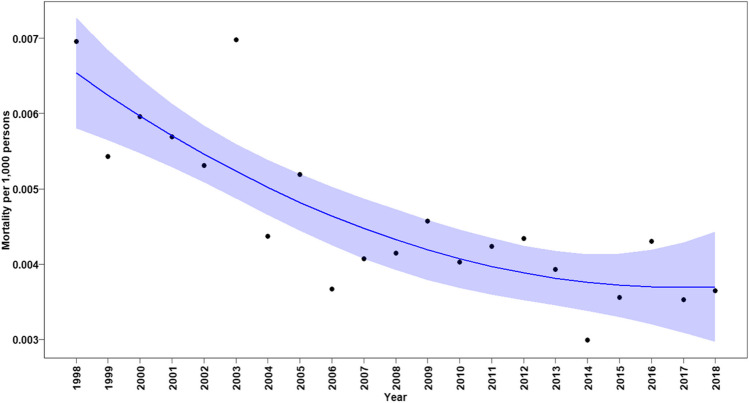
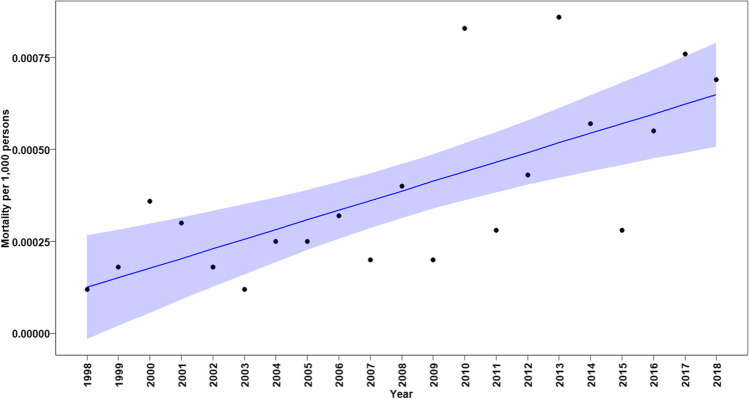
Results: During the 21-year study period, a total of 11,314 deaths were attributed to CHD with 50.9% of deaths in infants (age < 1 year) and 28.2% in neonates (age ≤ 28 days). The most frequent underlying CHDs associated with death were hypoplastic left heart syndrome (n = 1498, 13.2%), left ventricular outflow tract obstruction (n = 1009, 8.9%), atrial septal defects (n = 771, 6.8%), ventricular septal defects (n = 697, 6.2%), and tetralogy of Fallot (n = 673, 5.9%), and others (n = 6666, 58.9%). Among all patients, annual CHD-related mortality rates declined significantly between 1998 and 2010 (p < 0.0001), followed by a significant annual increase until 2018 (p < 0.0001). However, mortality rates in 2018 in all ages were significantly lower than in 1998.
Conclusion: Mortality in CHD patients decreased significantly between 1998 and 2010, but a substantial number of deaths still occurred and even significantly increased in the last 3 years of the observation period particularly in neonates and infants. This renewed slight increase in mortality rate during the last years was influenced mainly by high-risk neonates and infants. Assessment of factors influencing the mortality rate trends in association with CHD in Germany is urgently needed. Obligatory nationwide registration of death cases in relation to surgical and catheter interventions in CHD patients is necessary to provide additional valuable data on the outcome of CHD.
Keywords: Congenital heart defect; Infant; Mortality; Newborn.
© 2024. The Author(s).
Conflict of interest statement
The authors declare no competing interests.
Figures

Similar articles
-
Survival analysis of Down syndrome with congenital heart disease: a 5-years registry at QSNICH.J Med Assoc Thai. 2014 Jun;97 Suppl 6:S108-14. J Med Assoc Thai. 2014. PMID: 25391181
-
Perinatal outcomes and congenital heart defect prognosis in 53313 non-selected perinatal infants.PLoS One. 2017 Jun 7;12(6):e0177229. doi: 10.1371/journal.pone.0177229. eCollection 2017. PLoS One. 2017. PMID: 28591192 Free PMC article.
-
[Incidence of congenital heart defects in the Czech Republic--current data].Ceska Gynekol. 2010 May;75(3):221-42. Ceska Gynekol. 2010. PMID: 20731304 Czech.
-
How should we treat representative neonatal surgical diseases with congenital heart disease?Pediatr Surg Int. 2022 Sep;38(9):1235-1240. doi: 10.1007/s00383-022-05178-z. Epub 2022 Jul 15. Pediatr Surg Int. 2022. PMID: 35838788 Review.
-
Prevalence of congenital septal defects among congenital heart defect patients in East Africa: A systematic review and meta-analysis.PLoS One. 2021 Apr 22;16(4):e0250006. doi: 10.1371/journal.pone.0250006. eCollection 2021. PLoS One. 2021. PMID: 33886628 Free PMC article.
Cited by
-
[Pediatric and congenital arrhythmia treatment : A complex interplay between expertise, re-imbursement, and industry].Herzschrittmacherther Elektrophysiol. 2025 Aug 6. doi: 10.1007/s00399-025-01099-1. Online ahead of print. Herzschrittmacherther Elektrophysiol. 2025. PMID: 40767913 Review. German.
-
Identification and Functional Characterization of a Novel SOX4 Mutation Predisposing to Coffin-Siris Syndromic Congenital Heart Disease.Children (Basel). 2025 May 7;12(5):608. doi: 10.3390/children12050608. Children (Basel). 2025. PMID: 40426787 Free PMC article.
-
Ambient Air Pollution and Congenital Heart Disease: Updated Evidence and Future Challenges.Antioxidants (Basel). 2025 Jan 3;14(1):48. doi: 10.3390/antiox14010048. Antioxidants (Basel). 2025. PMID: 39857382 Free PMC article. Review.
References
MeSH terms
LinkOut - more resources
Full Text Sources
Medical
