

Caspase-11/GSDMD contributes to the progression of hyperuricemic nephropathy by promoting NETs formation
- PMID: 38436813
- PMCID: PMC10912150
- DOI: 10.1007/s00018-024-05136-z
Caspase-11/GSDMD contributes to the progression of hyperuricemic nephropathy by promoting NETs formation
Abstract
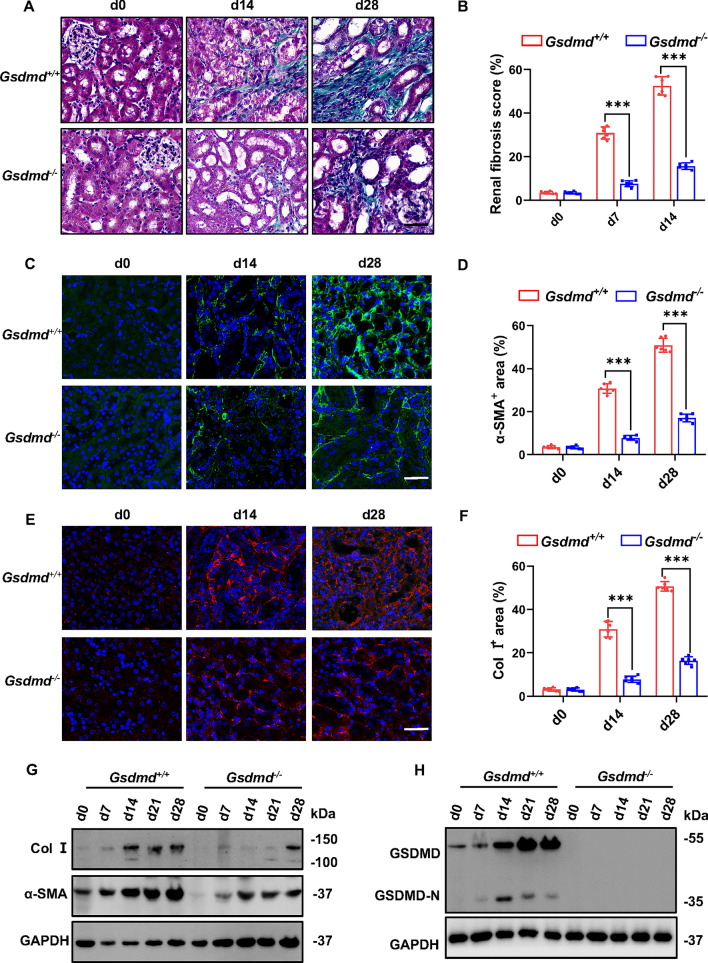
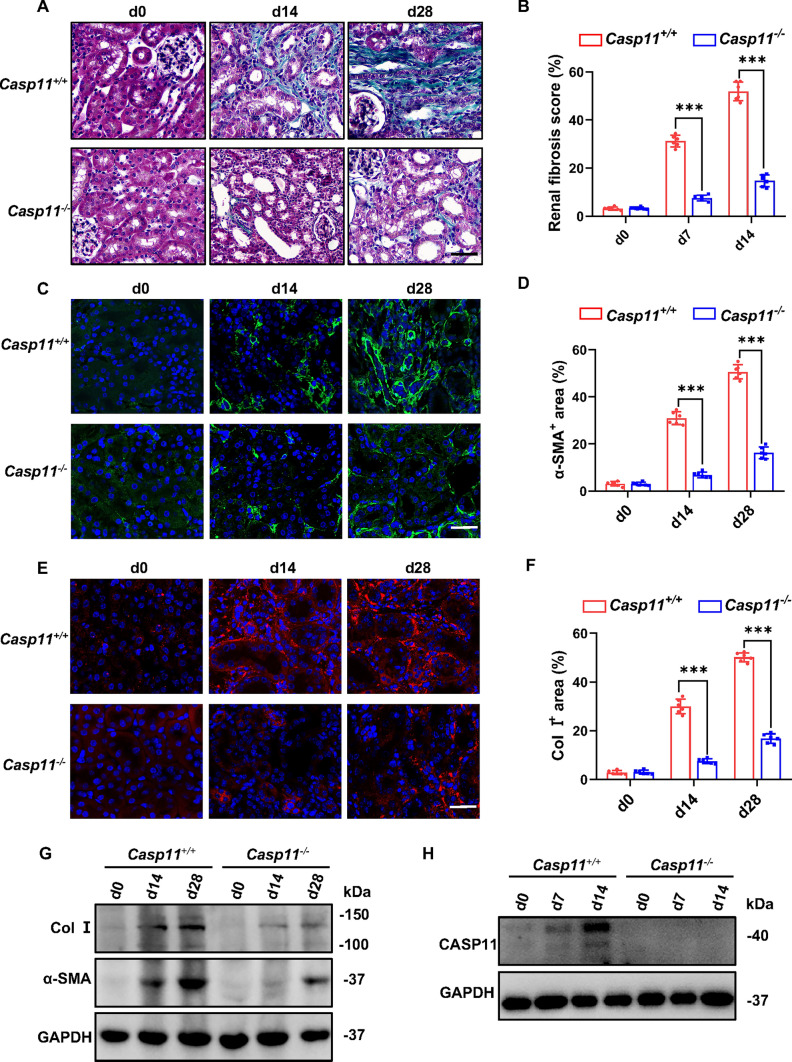
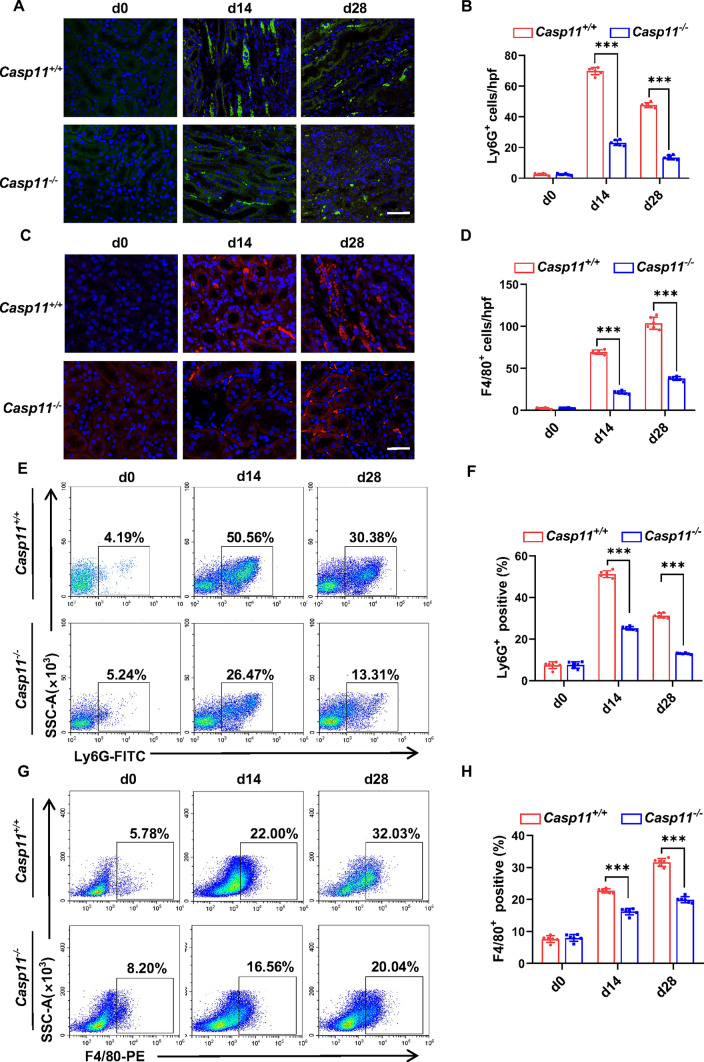
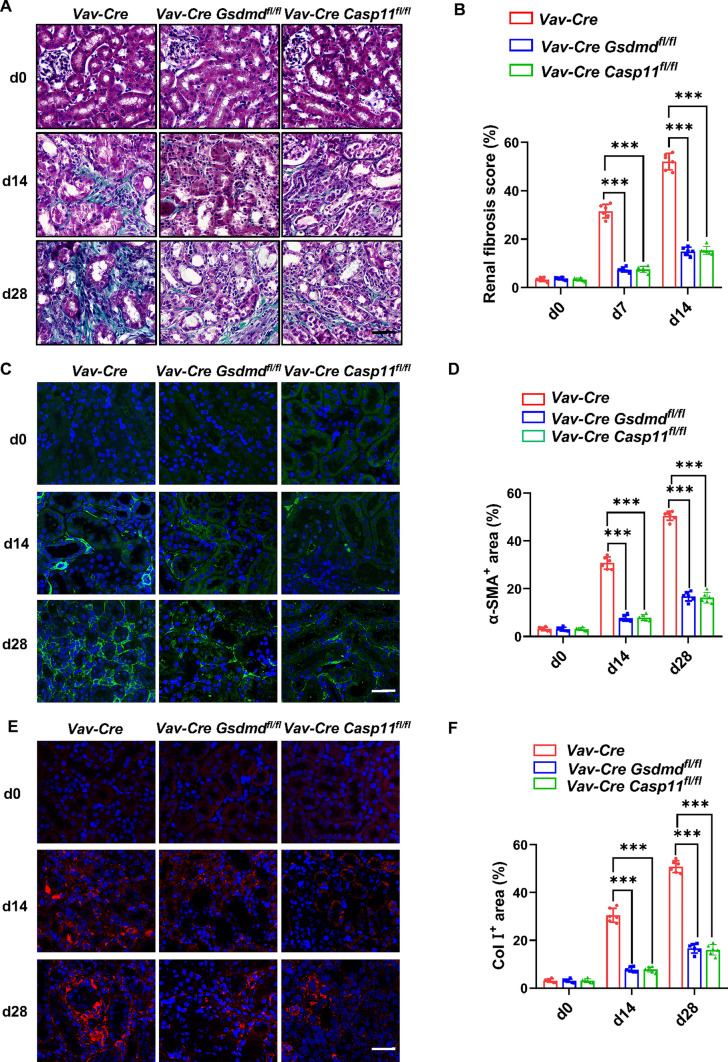
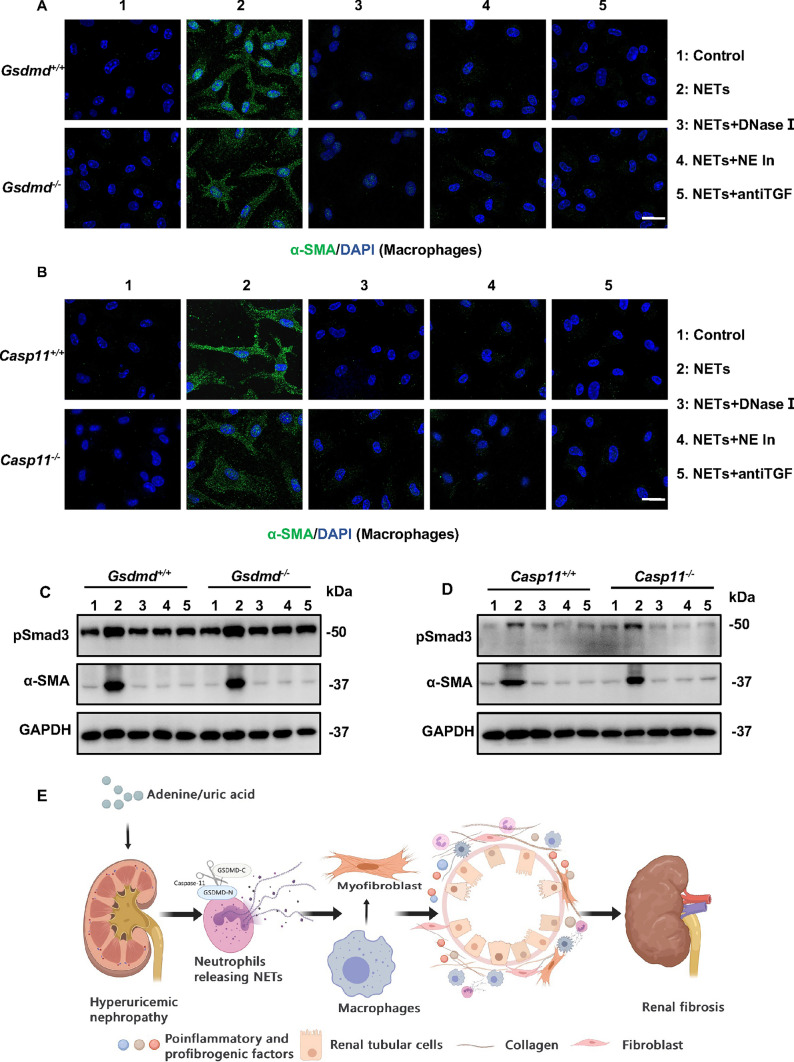
Hyperuricemia is an independent risk factor for chronic kidney disease (CKD) and promotes renal fibrosis, but the underlying mechanism remains largely unknown. Unresolved inflammation is strongly associated with renal fibrosis and is a well-known significant contributor to the progression of CKD, including hyperuricemia nephropathy. In the current study, we elucidated the impact of Caspase-11/Gasdermin D (GSDMD)-dependent neutrophil extracellular traps (NETs) on progressive hyperuricemic nephropathy. We found that the Caspase-11/GSDMD signaling were markedly activated in the kidneys of hyperuricemic nephropathy. Deletion of Gsdmd or Caspase-11 protects against the progression of hyperuricemic nephropathy by reducing kidney inflammation, proinflammatory and profibrogenic factors expression, NETs generation, α-smooth muscle actin expression, and fibrosis. Furthermore, specific deletion of Gsdmd or Caspase-11 in hematopoietic cells showed a protective effect on renal fibrosis in hyperuricemic nephropathy. Additionally, in vitro studies unveiled the capability of uric acid in inducing Caspase-11/GSDMD-dependent NETs formation, consequently enhancing α-smooth muscle actin production in macrophages. In summary, this study demonstrated the contributory role of Caspase-11/GSDMD in the progression of hyperuricemic nephropathy by promoting NETs formation, which may shed new light on the therapeutic approach to treating and reversing hyperuricemic nephropathy.
Keywords: Caspase-11; Gasdermin D; Hyperuricemic nephropathy; Neutrophil extracellular traps.
© 2024. The Author(s).
Conflict of interest statement
The authors declared no conflict of interest associated with this study.
Figures


Similar articles
-
GSDMD-dependent neutrophil extracellular traps promote macrophage-to-myofibroblast transition and renal fibrosis in obstructive nephropathy.Cell Death Dis. 2022 Aug 8;13(8):693. doi: 10.1038/s41419-022-05138-4. Cell Death Dis. 2022. PMID: 35941120 Free PMC article.
-
Natural flavonol fisetin attenuated hyperuricemic nephropathy via inhibiting IL-6/JAK2/STAT3 and TGF-β/SMAD3 signaling.Phytomedicine. 2021 Jul;87:153552. doi: 10.1016/j.phymed.2021.153552. Epub 2021 Mar 22. Phytomedicine. 2021. PMID: 33994251
-
GSDMD and GSDME synergy in the transition of acute kidney injury to chronic kidney disease.Nephrol Dial Transplant. 2024 Jul 31;39(8):1344-1359. doi: 10.1093/ndt/gfae014. Nephrol Dial Transplant. 2024. PMID: 38244230
-
Research progress on related mechanisms of uric acid activating NLRP3 inflammasome in chronic kidney disease.Ren Fail. 2022 Dec;44(1):615-624. doi: 10.1080/0886022X.2022.2036620. Ren Fail. 2022. PMID: 35382689 Free PMC article. Review.
-
The roles of NLRP3 inflammasome-mediated signaling pathways in hyperuricemic nephropathy.Mol Cell Biochem. 2021 Mar;476(3):1377-1386. doi: 10.1007/s11010-020-03997-z. Epub 2021 Jan 3. Mol Cell Biochem. 2021. PMID: 33389490 Review.
Cited by
-
Metabolomic and Cellular Mechanisms of Drug-Induced Ototoxicity and Nephrotoxicity: Therapeutic Implications of Uric Acid Modulation.Adv Sci (Weinh). 2025 Apr;12(16):e2415041. doi: 10.1002/advs.202415041. Epub 2025 Mar 5. Adv Sci (Weinh). 2025. PMID: 40041973 Free PMC article.
-
Association between the aggregate index of systemic inflammation and chronic kidney disease in adults: A cross-sectional study of NHANES 2007-2018.Medicine (Baltimore). 2025 May 23;104(21):e42480. doi: 10.1097/MD.0000000000042480. Medicine (Baltimore). 2025. PMID: 40419905 Free PMC article.
-
GSDMD-dependent NET formation in hyperuricemic nephropathy.Cell Mol Life Sci. 2024 Nov 20;81(1):460. doi: 10.1007/s00018-024-05459-x. Cell Mol Life Sci. 2024. PMID: 39562353 Free PMC article. No abstract available.
-
The relationship among inflammatory biomarkers, hyperuricemia and chronic kidney disease: analysis of the NHANES 2015-2020.Ren Fail. 2025 Dec;47(1):2553808. doi: 10.1080/0886022X.2025.2553808. Epub 2025 Sep 7. Ren Fail. 2025. PMID: 40915854 Free PMC article.
-
Overview of pharmacodynamical research of traditional Chinese medicine on hyperuricemic nephropathy: from the perspective of dual-regulatory effect on the intestines and kidneys.Front Pharmacol. 2025 Apr 8;16:1517047. doi: 10.3389/fphar.2025.1517047. eCollection 2025. Front Pharmacol. 2025. PMID: 40264662 Free PMC article. Review.
References
-
- Sellmayr M, Hernandez Petzsche MR, Ma Q, Krüger N, Liapis H, Brink A, Lenz B, Angelotti ML, Gnemmi V, Kuppe C, Kim H, Bindels EMJ, Tajti F, Saez-Rodriguez J, Lech M, Kramann R, Romagnani P, Anders HJ, Steiger S. Only hyperuricemia with crystalluria, but not asymptomatic hyperuricemia, drives progression of chronic kidney disease. J Am Soc Nephrol. 2020;31(12):2773–2792. doi: 10.1681/asn.2020040523. - DOI - PMC - PubMed
MeSH terms
Substances
Grants and funding
LinkOut - more resources
Full Text Sources
Medical
