. 2024 Mar 4;20(3):e1011879.
doi: 10.1371/journal.ppat.1011879. eCollection 2024 Mar.

Structure-guided design of VAR2CSA-based immunogens and a cocktail strategy for a placental malaria vaccine

Affiliations

Structure-guided design of VAR2CSA-based immunogens and a cocktail strategy for a placental malaria vaccine

Rui Ma et al. PLoS Pathog. .

Abstract

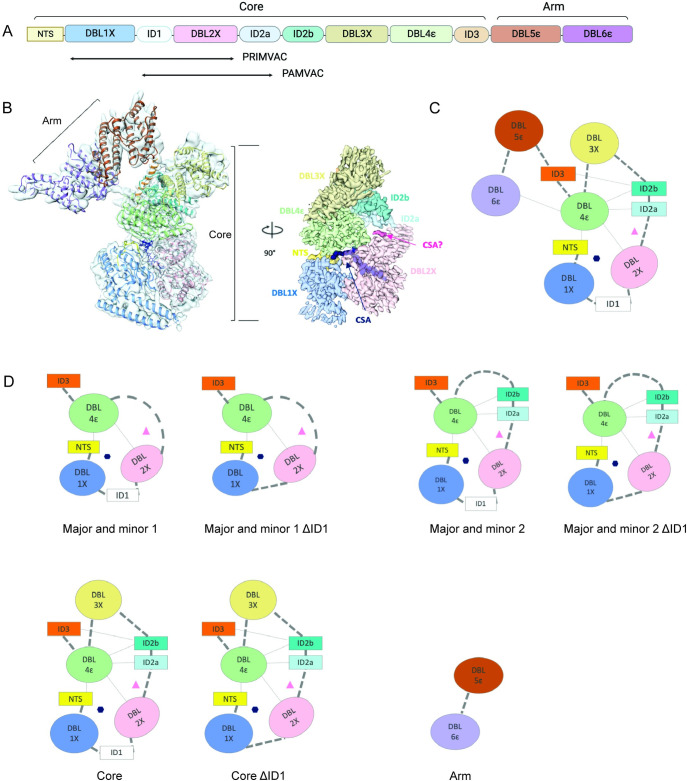
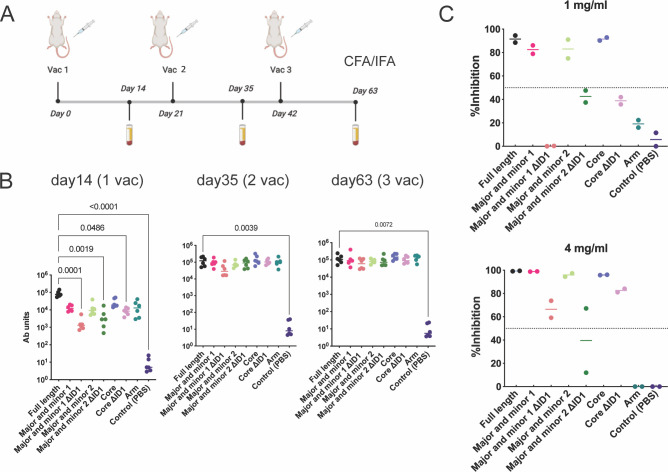
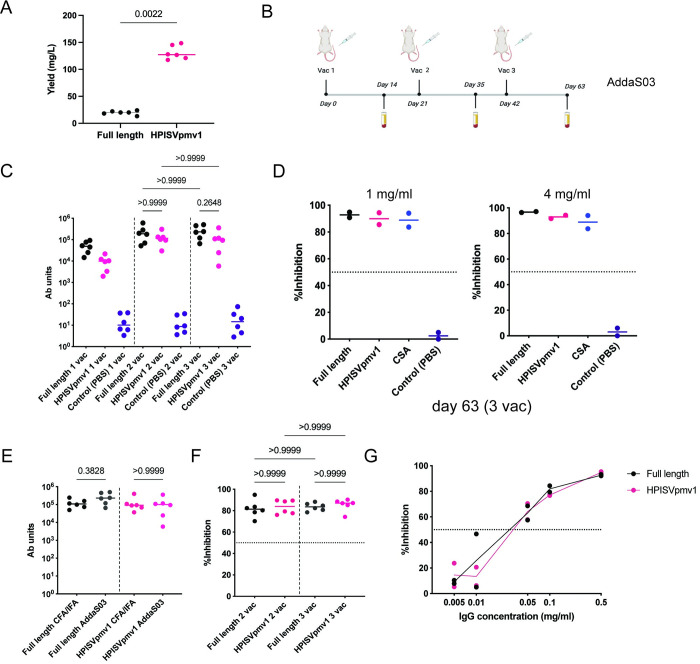
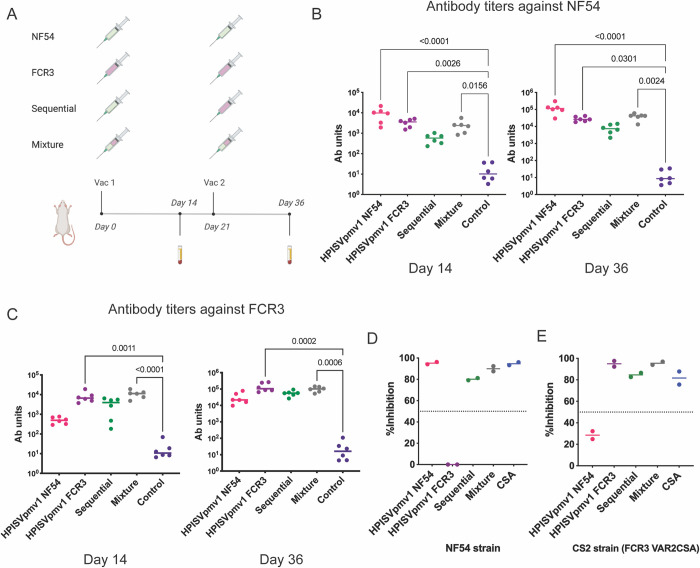
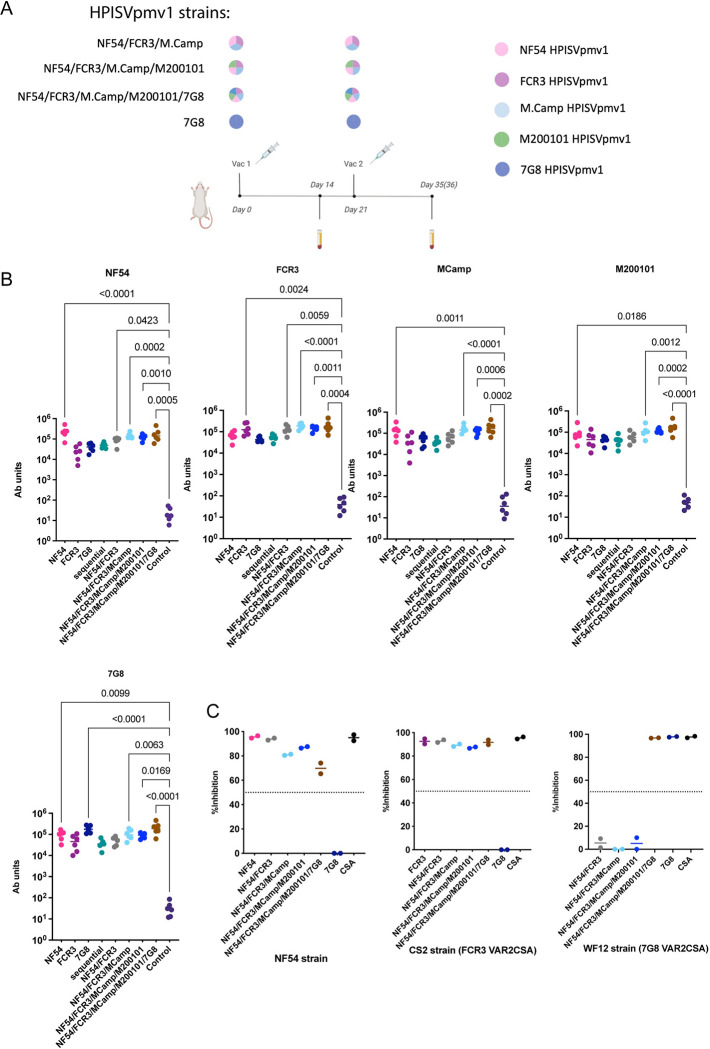
Placental accumulation of Plasmodium falciparum infected erythrocytes results in maternal anemia, low birth weight, and pregnancy loss. The parasite protein VAR2CSA facilitates the accumulation of infected erythrocytes in the placenta through interaction with the host receptor chondroitin sulfate A (CSA). Antibodies that prevent the VAR2CSA-CSA interaction correlate with protection from placental malaria, and VAR2CSA is a high-priority placental malaria vaccine antigen. Here, structure-guided design leveraging the full-length structures of VAR2CSA produced a stable immunogen that retains the critical conserved functional elements of VAR2CSA. The design expressed with a six-fold greater yield than the full-length protein and elicited antibodies that prevent adhesion of infected erythrocytes to CSA. The reduced size and adaptability of the designed immunogen enable efficient production of multiple variants of VAR2CSA for use in a cocktail vaccination strategy to increase the breadth of protection. These designs form strong foundations for the development of potent broadly protective placental malaria vaccines.


Conflict of interest statement

NHT, RM and PED are inventors on a patent application related to this work. JYAD is an inventor on patent US9855321B2.

Figures

Fig 1
Fig 1. Structure-guided design of VAR2CSA-based immunogens.
(A) Domain structures of the full-length VAR2CSA protein. (B) Left: VAR2CSA model fitted into the reconstructed density. Right: the Core structure is shown in surface with 70% transparency. The CSA 12-mer that binds within the major CSA binding channel is shown in dark blue, and the potential CSA monomer that binds within a putative minor CSA binding channel is shown in magenta. (C) Schematic drawing of the VAR2CSA structure and the major and minor CSA binding channels. The major binding channel and minor binding channel are represented by the dark-blue hexagon and magenta triangle, respectively. (D) Schematic of the designed immunogens. This figure was generated with the help of Biorender (https://www.biorender.com/) and PRISM 9.
Fig 2
Fig 2. The designed immunogens formulated in CFA/IFA elicit strong antibody responses and binding inhibitory activity.
(A) Schematic of the immunization schedule. (B) Antibody titers to full-length VAR2CSA NF54 measured two weeks after each vaccination by ELISA. Each point is the mean of three technical replicates for each individual rat, and the bar represents the median value for the group. The p-values were calculated using a two-sided Kruskal-Wallis non-parametric test with Dunn’s multiple comparisons compared to the full-length protein and comparisons with p-values less than or equal to 0.05 are shown. (C) Purified pooled IgGs from serum after three vaccinations for each group were evaluated by BIA at 1 mg/ml (upper) or 4 mg/ml (bottom). The dashed line indicates the 50% inhibition level used as a cutoff for inhibitory or non-inhibitory activity. The data shown are derived from two independent experiments, each point is the mean of two technical replicates, and the bar represents the median value. This figure was generated with the help of Biorender (https://www.biorender.com/) and PRISM 9.
Fig 3
Fig 3. HPISVpmv1 formulated in AddaS03 produced a strong antibody response and binding inhibitory activity upon vaccination of rats.
(A) Expression yield comparison between full length VAR2CSA and HPISVpmv1. The p-value of a Mann-Whitney test was shown. (B) Schematic of the immunization schedule. (C) Antibody titers measured two weeks after each vaccination by ELISA to full-length VAR2CSA NF54. Each point is the mean of three technical replicates for each individual rat, and the bar represents the median value for the group. A two-sided Kruskal-Wallis non-parametric statistical analysis followed by Dunn’s test to correct for multiple comparisons of antibody titers elicited by full-length VAR2CSA and HPISVpmv1 showed no significant difference between day 35 (2 vac) and day 63 (3 vac), indicating that a two-vaccination regimen is sufficient. (D) Purified pooled IgGs from serum after three vaccinations for each group were evaluated by BIA at 1 mg/ml (left) or 4 mg/ml (right). The dashed line indicates the 50% inhibition level used as a cutoff for inhibitory or non-inhibitory activity. The data shown are derived from two independent experiments, and each point is the mean of two technical replicates. The bar represents the median value, and 0.1 mg/ml CSA was used as the positive control. (E) A two-sided Kruskal-Wallis non-parametric statistical analysis followed by Dunn’s test to correct for multiple comparisons of antibody titers elicited by the two adjuvants used in this study at day 63 showed no significant difference, indicating that AddaS03 provides a strong immune response. (F) Purified IgGs from each individual rat were examined by BIA at 1 mg/ml for the full-length and HPISVpmv1 groups adjuvanted in AddaS03, demonstrating strong inhibitory activity in all animals. Two-sided Kruskal-Wallis non-parametric tests followed by Dunn’s test to correct for multiple comparisons were performed to evaluate whether the inhibitory activity differed between the number of vaccinations, and no significant difference was observed. The 50% inhibition level used as a cutoff for inhibitory or non-inhibitory activity is highlighted as a dashed line. (G) Dose-dependent inhibition of the purified pooled IgG after two vaccinations from the full-length and HPISVpmv1 groups by BIA. The 50% inhibition level used as a cutoff for inhibitory or non-inhibitory activity is highlighted as a dashed line. This figure was generated with the help of Biorender (https://www.biorender.com/) and PRISM 9.
Fig 4
Fig 4. Cocktail immunization with two variants increased the breadth of protection.
(A) The two-vaccination immunization schedule with the cocktail strategy illustrated above. The NF54 group was immunized with HPISVpmv1 based on the VAR2CSA NF54 sequence; the FCR3 group was immunized with HPISVpmv1 based on the VAR2CSA FCR3 sequence. The sequential strategy group was sequentially immunized first with HPISVpmv1 from NF54 and then boosted with HPISVpmv1 from FCR3. The mixture strategy group was immunized with an equal mixture of HPISVpmv1 from both NF54 and FCR3. The total amount of VAR2CSA immunogen used was kept constant and divided equally between variants. (B) The antibody titers from the rats measured by ELISA. VAR2CSA NF54 was coated on the plate. Each point is the mean of three technical replicates for each individual rat, and the bar represents the median value for the group. The p-values were calculated using a two-sided Kruskal-Wallis non-parametric test with Dunn’s multiple comparisons compared to control and comparisons with p-values less than or equal to 0.05 are shown. (C) The antibody titers from the rats measured by ELISA. VAR2CSA FCR3 was coated on the plate. Each point is the mean of three technical replicates for each individual rat, and the bar represents the median value for the group. The p-values were calculated using a two-sided Kruskal-Wallis non-parametric test with Dunn’s multiple comparisons compared to control and comparisons with p-values less than or equal to 0.05 are shown. (D) BIA assay results against the NF54 parasite strain using purified pooled IgG at 1 mg/ml from the serum after two vaccinations. The dashed line indicates the 50% inhibition level used as a cutoff for inhibitory or non-inhibitory activity. The data shown are derived from two independent experiments, and each point is the mean of two technical replicates. (E) BIA assay results against the CS2 parasite strain that contains FCR3 VAR2CSA using purified pooled IgGs at 1 mg/ml from the serum after two vaccinations. The dashed line indicates the 50% inhibition level used as a cutoff for inhibitory or non-inhibitory activity. The data shown are derived from two independent experiments, and each point is the mean of two technical replicates. This figure was generated with the help of Biorender (https://www.biorender.com/) and PRISM 9.
Fig 5
Fig 5. Cocktail immunization with up to five HPISVpmv1 variants enhanced the breadth of inhibition.
(A) The two-vaccination immunization schedule with the cocktail strategy. The groups were immunized with different combinations of HPISVpmv1 variants from NF54, FCR3, M200101, M. Camp and 7G8. The HPISVpmv1 immunogens were equally combined to generate a mixture of three (NF54/FCR3/M. Camp), four (NF54/FCR3/M. Camp/M200101), and five (NF54/FCR3/M. Camp/M200101/7G8) strains for immunization. The total amount of VAR2CSA immunogen used was kept constant and divided equally among variants. (B) Antibody titers from the rats after each of the two immunizations. The HPISVpmv1 immunogens of each strain were coated on the plate as annotated above each graph. Each point is the mean of three technical replicates for each individual rat, and the bar represents the median value for the group. The cocktail combinations of HPISV strains are shown by the titles of the X-Axis. The p-values were calculated using a two-sided Kruskal-Wallis non-parametric test with Dunn’s multiple comparisons compared to control and comparisons with p-values less than or equal to 0.05 are shown. (C) BIA assay results against NF54, CS2 (VAR2CSA FCR3 sequence), and WF12 (VAR2CSA 7G8 sequence) parasite strains using purified pooled IgGs at 1 mg/ml from the serum after two vaccinations. The dashed line indicates the 50% inhibition level used as a cutoff for inhibitory or non-inhibitory activity. The cocktail combinations of HPISV strains are shown by the titles of the x-axis. The data shown are derived from two independent experiments, and each point is the mean of two technical replicates. This figure was generated with the help of Biorender (https://www.biorender.com/) and PRISM 9.

Similar articles

Cited by

References

    1. Fried M, Duffy PE. Malaria during Pregnancy. Cold Spring Harb Perspect Med. 2017;7(6). Epub 2017/02/19. doi: 10.1101/cshperspect.a025551 ; PubMed Central PMCID: PMC5453384. - DOI - PMC - PubMed
    1. Desai M, ter Kuile FO, Nosten F, McGready R, Asamoa K, Brabin B, et al.. Epidemiology and burden of malaria in pregnancy. Lancet Infect Dis. 2007;7(2):93–104. Epub 2007/01/26. doi: 10.1016/S1473-3099(07)70021-X . - DOI - PubMed
    1. Zakama AK, Ozarslan N, Gaw SL. Placental Malaria. Curr Trop Med Rep. 2020:1–10. Epub 2020/09/22. doi: 10.1007/s40475-020-00213-2 ; PubMed Central PMCID: PMC7493061. - DOI - PMC - PubMed
    1. Guyatt HL, Snow RW. The epidemiology and burden of Plasmodium falciparum-related anemia among pregnant women in sub-Saharan Africa. Am J Trop Med Hyg. 2001;64(1–2):36–44. doi: 10.4269/ajtmh.2001.64.36 WOS:000169364300009. - DOI - PubMed
    1. Steketee RW, Nahlen BL, Parise ME, Menendez C. The burden of malaria in pregnancy in malaria-endemic areas. Am J Trop Med Hyg. 2001;64(1–2):28–35. doi: 10.4269/ajtmh.2001.64.28 WOS:000169364300008. - DOI - PubMed