. 2024 May 16;143(20):2059-2072.
doi: 10.1182/blood.2023022832.

BRG1/BRM inhibitor targets AML stem cells and exerts superior preclinical efficacy combined with BET or menin inhibitor

Affiliations

BRG1/BRM inhibitor targets AML stem cells and exerts superior preclinical efficacy combined with BET or menin inhibitor

Warren Fiskus et al. Blood. .

Abstract

BRG1 (SMARCA4) and BRM (SMARCA2) are the mutually exclusive core ATPases of the chromatin remodeling BAF (BRG1/BRM-associated factor) complexes. They enable transcription factors/cofactors to access enhancers/promoter and modulate gene expressions responsible for cell growth and differentiation of acute myeloid leukemia (AML) stem/progenitor cells. In AML with MLL1 rearrangement (MLL1r) or mutant NPM1 (mtNPM1), although menin inhibitor (MI) treatment induces clinical remissions, most patients either fail to respond or relapse, some harboring menin mutations. FHD-286 is an orally bioavailable, selective inhibitor of BRG1/BRM under clinical development in AML. Present studies show that FHD-286 induces differentiation and lethality in AML cells with MLL1r or mtNPM1, concomitantly causing perturbed chromatin accessibility and repression of c-Myc, PU.1, and CDK4/6. Cotreatment with FHD-286 and decitabine, BET inhibitor (BETi) or MI, or venetoclax synergistically induced in vitro lethality in AML cells with MLL1r or mtNPM1. In models of xenografts derived from patients with AML with MLL1r or mtNPM1, FHD-286 treatment reduced AML burden, improved survival, and attenuated AML-initiating potential of stem-progenitor cells. Compared with each drug, cotreatment with FHD-286 and BETi, MI, decitabine, or venetoclax significantly reduced AML burden and improved survival, without inducing significant toxicity. These findings highlight the FHD-286-based combinations as a promising therapy for AML with MLL1r or mtNPM1.


Conflict of interest statement

Conflict-of-interest disclosure: K.N.B. has received research funding from Iterion, Foghorn, and Nurix Pharmaceuticals; and serves as a consultant for Iterion Therapeutics. J.P., M.C., and M.H. are employed by Foghorn Therapeutics. R.S. is an employee of Active Motif. The remaining authors declare no competing financial interests.

Figures

None
Graphical abstract
Figure 1.
Figure 1.
Treatment with FHD-286 overcomes differentiation block and significantly induced CD11b expression and morphologic features of differentiation in AML cell lines with MLL1r and mtNPM1. (A-C) MV4-11, OCI-AML3, and MOLM13 cells were treated with the indicated concentrations of FHD-286 for 7 days. At the end of the treatment, cells were assessed for CD11b expression, morphologic features of differentiation, and percentage of nonviable cells. Columns, mean of 3 experiments; bars, standard error of the mean. (D) PD mtNPM1 and MLL1r AML cells were treated with the indicated concentrations of FHD-286 for 72 hours. After this, cells were stained with TO-PRO-3 iodide, and the percentage nonviable cells were determined by flow cytometry. (E-H) MV4-11, MV4-11-MITR, OCI-AML3, and OCI-AML3-MITR cells were treated with the indicated concentrations of FHD-286 for 7 days. After this, cells were assessed for the percentage expression and the mean fluorescent intensity (MFI) of CD11b by flow cytometry and morphologic features of differentiation. Data are the mean of 3 experiments; error bars indicate the standard error of the mean. ∗P < .05; ∗∗∗P < .005.
Figure 2.
Figure 2.
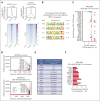
Treatment with FHD-286 depletes BRG1 occupancy on chromatin while increasing H3K27Ac occupancy on loci involved in differentiation and loss of cell viability. (A) MOLM13 cells were treated with 100 nM of FHD-286 for 16 hours. ChIP-Seq analysis was conducted with anti-BRG1 antibody. Panel shows the genome-wide peak profile and heat map of BRG1 binding at peak center ± 5 kb resolution. (B) Transcription factor binding motifs in loci with reduced BRG1 occupancy. The motif name, canonical binding motif, and the P value are shown. (C) Log2 fold decline of BRG1 binding at selected AML relevant loci in MOLM13 treated with 100 nM of FHD-286 for 16 hours. (D-E) MOLM13 cells were treated with 100 nM of FHD-286 for 16 hours. ChIP-Seq analysis was conducted with anti-H3K27Ac antibody and ranked ordering of superenhancer (ROSE) analysis was performed. (F) MOLM13 cells were treated with 100 nM of FHD-286 for 16 hours. ChIP-Seq analysis was conducted with anti-H3K27Ac antibody. Panel shows the log2 fold-increase in H3K27Ac occupancy on loci involved in differentiation and loss of viability in MOLM13 cells.
Figure 3.
Figure 3.
Treatment with FHD-286 concordantly alters chromatin accessibility and mRNA expression in MLL1-rearranged AML cells with reduction in the enrichment scores for MYC, mTORC1, E2F, interferon gamma, IL6-JAK-STAT3, as well as of inflammatory response and oxidative phosphorylation gene sets. (A-B) MOLM13 cells were treated with 100 nM of FHD-286 for 16 hours as biologic replicates. Bulk nuclei were isolated for ATAC-Seq analysis and total RNA was isolated and used for RNA-Seq analysis. RNAs and diffReps-determined ATAC-Seq peaks with ≥1.25-fold change and P value <.05 were used for the concordance analysis. Circos plot (A) and log2 fold-changes (B) of selected, concordant ATAC-Seq, and mRNA expression alterations in FHD-286–treated MOLM13 cells. (C) Gene set enrichment analysis of FHD-286–treated MOLM13 cells compared with HALLMARK pathways. Normalized enrichment scores are shown. All q-values are <0.1. (D) Enrichment plot of FHD-286–treated MOLM13 cells compared with HALLMARK_MYC_TARGETS_V1 and HALLMARK_MYC_TARGETS_V2. (E) Volcano plot (log2 fold change vs −log10 P value) of RNA-Seq determined mRNA expression changes in FHD-286–treated MOLM13 cells.
Figure 4.
Figure 4.
Treatment with FHD-286 depletes MEP cells and reduces chromatin accessibility and enrichment scores of MYC TARGET genes in the CMP cluster of PD mtNPM1 + FLT3-ITD expressing AML cells. (A) PD mtNPM1-expressing AML cells from a bone marrow aspirate were treated with 100 nM of FHD-286 for 16 hours. Multiomics (combined sc-ATAC-Seq and sc-RNA-Seq) analyses were performed on isolated nuclei. The uniform manifold approximation and projection (UMAP) plot shows the SingleR-determined composition of the individual cell clusters in the control and FHD-286-treated AML cells. (B) Percentage of each cell type in the clusters of cells from control and FHD-286–treated cells. Arrows indicate clusters with increased or decreased numbers of cells in the FHD-286–treated sample compared with the control sample. (C) Volcano plot of sc-ATAC-Seq peaks in the CMP cluster with ≥1.25-fold change up or down and P value <.05 after treatment with FHD-286. (D) Gene set enrichment analysis of FHD-286–treated cells over control cells. All q-values are <0.1. (E) Volcano plot of sc-RNA-Seq expression changes (≥1.25 fold change and P < .05) in the CMP cluster after treatment with 100 nM FHD-286 for 16 hours compared with control cells. CMP, common myeloid progenitor; MEP, megakaryocyte-erythroid progenitor.
Figure 5.
Figure 5.
Treatment with FHD-286 significantly depleted c-Myc and PU.1 expression in bulk AML cells and phenotypically defined AML stem cells with MLL1r or mtNPM1. (A) MOLM13 and PD mtNPM1 expressing AML cells were treated with 100 nM of FHD-286 for 48 hours. Total proteome profiling was conducted by mass spectrometry analysis. The heat map shows selected overlapping depleted and induced protein expressions with a fold change >1.25 and a P value <.05. (B) Log2 fold decline in protein expressions in FHD-286–treated MOLM13 and PD mtNPM1-expressing AML cells compared with REACTOME_SIGNAL_TRANSDUCTION and REACTOME_RNA_POLII_TRANSCRIPTION pathways. (C) PD MLL1r and mtNPM1 AML cells were treated with 100 nM of FHD-286 for 48 hours. CyTOF analyses were conducted using cocktails of rare metal element–tagged antibodies. The heat map shows the fold change (FHD-286 treated over control) of depleted and induced proteins in phenotypically defined AML stem/progenitor cells (CLEC12A hi, CD123 hi, CD99 hi, CD33 hi, and CD11b low). (D) Percentage of stem cell frequency of control and FHD-286–treated PD MLL1r and mtNPM1 expressing AML cells.
Figure 6.
Figure 6.
Treatment with FHD-286 exhibits in vivo efficacy against AML-initiating stem cells. (A) PD mtNPM1 + FLT3-ITD Luc/GFP cells (AML number 1 in the oncoplot) were ex vivo treated with 10 and 30 nM of FHD-286 for 96 hours. After this, equal numbers of cells (2.5e6 cells/mouse) were tail vein infused into preirradiated (2.5 Gy) NSG mice (n = 5 per cohort). Mice were monitored daily for symptoms of acute leukemia. Luciferase signal in the mice was determined by IVIS imaging (Xenogen) at 1, 2, and 4 weeks after infusion of AML cells. The box plots show the total bioluminescent flux (photons/second) at 1, 2, and 4 weeks after infusion of the AML cells in the mice. Significance between cohorts was determined by a 2-tailed, unpaired t test using GraphPad Prism V9. P values <.05 were considered significant. (B) Kaplan-Meier survival curve of NSG mice infused with ex vivo treated PD mtNPM1 + FLT3-ITD Luc/GFP cells. Significance between cohorts was determined by a Mantel-Cox log-rank test. P values <.05 were considered significant. (C) PD mtNPM1 + FLT3-ITD Luc/GFP cells (2.5e6 cells/mouse) were tail vein infused into preirradiated (2.5 Gy) NSG mice (n = 4 per cohort). Mice were monitored for 5 days, and leukemia engraftment was documented by IVIS imaging. Mice were randomized to equivalent bioluminescence and treated with vehicle or 1.5 mg/kg of FHD-286 for 5 weeks. The box plots show the total bioluminescent flux (photons/second) at 5 weeks after infusion of the AML cells. Significance between cohorts was determined by a 2-tailed, unpaired t test using GraphPad Prism V9. P values <.05 were considered significant. (D) After 5 weeks of treatment when vehicle mice required euthanasia, all mice were euthanized, and the spleens and bone marrow were harvested. The panel shows 2 representative spleens from vehicle and 1.5 mg/kg FHD-286–treated mice. (E) Representative bioluminescent images of mice from panel C. (F) Viable human AML cells from the spleens and bone marrow of vehicle and FHD-286–treated mice were reinfused into preirradiated (2.5 Gy) NSG mice (n = 6 per cohort). The box plots show the total bioluminescent flux (photons/second) 3 weeks after reinfusion of the AML cells. Significance between cohorts was determined by a 2-tailed, unpaired t test using GraphPad Prism V9. P values <.05 were considered significant. (G) Representative bioluminescent images of mice from panel F. (H) Kaplan-Meier survival curve of NSG mice infused with equal numbers of previously in vivo treated PD mtNPM1 + FLT3-ITD Luc/GFP cells. Significance between cohorts was determined by a Mantel-Cox log-rank test. P values <.05 were considered significant. ∗∗∗P < .005; ∗∗∗∗P < .001.
Figure 7.
Figure 7.
Treatment with FHD-286–based combinations exerted synergistic in vitro lethality in cultured and PD AML cells expressing MLL1r or mtNPM1 with or without mtFLT3 and reduced leukemia burden and significantly improved survival of NSG mice bearing MLL1r or mtNPM1-expressing AML xenografts. (A) MOLM13, MV4-11, MV4-11-MITR, OCI-AML3, OCI-AML3-MITR, and PD MLL1r or mtNPM1-expressing AML cells were treated with FHD-286 (dose range, 10-250 nM) and MI SNDX-50469 (dose range, 50-1000 nM), BETi OTX015 (dose range, 50-250 nM), or venetoclax (dose range, 10-100 nM) for 72 to 96 hours. At the end of treatment, the percentage of nonviable cells was determined by staining with TO-PRO-3 iodide and flow cytometry analysis. Delta synergy scores were determined by the ZIP method within the SynergyFinder web application. Synergy scores >1.0 indicate a synergistic interaction of the 2 agents in the combination. Panel shows the mean Delta Synergy Score for each FHD-286–based combination in the cell lines and PD AML cells. (B) Total photon counts (flux; determined by bioluminescent imaging) in NSG mice engrafted with luciferized MLL-AF9 + FLT3-TKD AML PDX cells (AML number 6 in the oncoplot) and treated for 3 weeks with FHD-286 and/or venetoclax, decitabine, or OTX015 at the indicated doses. (C) Kaplan-Meier survival plot of NSG mice engrafted with luciferized MLL-AF9 + FLT3-TKD AML PDX cells and treated with 1.5 mg/kg of FHD-286 (daily ×5 days, P.O.) and/or 30 mg/kg of venetoclax (daily ×5 days, P.O.) for 4 weeks. Significance was calculated by a Mantel-Cox log-rank test. (D) Kaplan-Meier survival plot of NSG mice engrafted with luciferized MLL-AF9 + FLT3-TKD AML PDX cells and treated with 1.5 mg/kg of FHD-286 (daily ×5 days, P.O.) and/or 1 mg/kg of DAC (days 1-5 only, IP) for 6 weeks. Significance was calculated by a Mantel-Cox log-rank test. (E) Kaplan-Meier survival plot of NSG mice engrafted with luciferized MLL-AF9 + FLT3-TKD AML PDX cells and treated with 1.5 mg/kg of FHD-286 (daily ×5 days, P.O.) and/or 30 mg/kg of OTX015 (daily ×5 days, P.O.) for 7 weeks. Significance was calculated by a Mantel-Cox log-rank test. (F) Total photon counts (flux; determined by bioluminescent imaging) in NSG mice engrafted with luciferized mtNPM1 + FLT3-ITD PDX cells and treated for 5 weeks with FHD-286 and/or SNDX-5613 or OTX015 at the indicated doses. (G) Representative bioluminescent images of mice from panel F. (H-I) Kaplan-Meier survival plot of NSG mice engrafted with luciferized mtNPM1 + FLT3-ITD PDX cells and treated with 1.5 mg/kg of FHD-286 (daily ×5 days, P.O.) and/or 30 mg/kg of OTX015 (daily ×5 days, P.O.) or SNDX-5613 (50 mg/kg, B.I.D. ×5 days, P.O) for 8 weeks. Significance between cohorts was determined by a Mantel-Cox log-rank test. ∗P < .05; ∗∗P < .01; ∗∗∗P < .005; ∗∗∗∗P < .001. B.I.D., twice a day; IP, intraperitoneal; ns, not significant; P.O., oral.
Figure 7.
Figure 7.
Treatment with FHD-286–based combinations exerted synergistic in vitro lethality in cultured and PD AML cells expressing MLL1r or mtNPM1 with or without mtFLT3 and reduced leukemia burden and significantly improved survival of NSG mice bearing MLL1r or mtNPM1-expressing AML xenografts. (A) MOLM13, MV4-11, MV4-11-MITR, OCI-AML3, OCI-AML3-MITR, and PD MLL1r or mtNPM1-expressing AML cells were treated with FHD-286 (dose range, 10-250 nM) and MI SNDX-50469 (dose range, 50-1000 nM), BETi OTX015 (dose range, 50-250 nM), or venetoclax (dose range, 10-100 nM) for 72 to 96 hours. At the end of treatment, the percentage of nonviable cells was determined by staining with TO-PRO-3 iodide and flow cytometry analysis. Delta synergy scores were determined by the ZIP method within the SynergyFinder web application. Synergy scores >1.0 indicate a synergistic interaction of the 2 agents in the combination. Panel shows the mean Delta Synergy Score for each FHD-286–based combination in the cell lines and PD AML cells. (B) Total photon counts (flux; determined by bioluminescent imaging) in NSG mice engrafted with luciferized MLL-AF9 + FLT3-TKD AML PDX cells (AML number 6 in the oncoplot) and treated for 3 weeks with FHD-286 and/or venetoclax, decitabine, or OTX015 at the indicated doses. (C) Kaplan-Meier survival plot of NSG mice engrafted with luciferized MLL-AF9 + FLT3-TKD AML PDX cells and treated with 1.5 mg/kg of FHD-286 (daily ×5 days, P.O.) and/or 30 mg/kg of venetoclax (daily ×5 days, P.O.) for 4 weeks. Significance was calculated by a Mantel-Cox log-rank test. (D) Kaplan-Meier survival plot of NSG mice engrafted with luciferized MLL-AF9 + FLT3-TKD AML PDX cells and treated with 1.5 mg/kg of FHD-286 (daily ×5 days, P.O.) and/or 1 mg/kg of DAC (days 1-5 only, IP) for 6 weeks. Significance was calculated by a Mantel-Cox log-rank test. (E) Kaplan-Meier survival plot of NSG mice engrafted with luciferized MLL-AF9 + FLT3-TKD AML PDX cells and treated with 1.5 mg/kg of FHD-286 (daily ×5 days, P.O.) and/or 30 mg/kg of OTX015 (daily ×5 days, P.O.) for 7 weeks. Significance was calculated by a Mantel-Cox log-rank test. (F) Total photon counts (flux; determined by bioluminescent imaging) in NSG mice engrafted with luciferized mtNPM1 + FLT3-ITD PDX cells and treated for 5 weeks with FHD-286 and/or SNDX-5613 or OTX015 at the indicated doses. (G) Representative bioluminescent images of mice from panel F. (H-I) Kaplan-Meier survival plot of NSG mice engrafted with luciferized mtNPM1 + FLT3-ITD PDX cells and treated with 1.5 mg/kg of FHD-286 (daily ×5 days, P.O.) and/or 30 mg/kg of OTX015 (daily ×5 days, P.O.) or SNDX-5613 (50 mg/kg, B.I.D. ×5 days, P.O) for 8 weeks. Significance between cohorts was determined by a Mantel-Cox log-rank test. ∗P < .05; ∗∗P < .01; ∗∗∗P < .005; ∗∗∗∗P < .001. B.I.D., twice a day; IP, intraperitoneal; ns, not significant; P.O., oral.

References

    1. Mashtalir N, D'Avino AR, Michel BC, et al. Modular organization and assembly of SWI/SNF family chromatin remodeling complexes. Cell. 2018;175(5):1272–1288.e20. - PMC - PubMed
    1. Centore RC, Sandoval GJ, Soares LMM, Kadoch C, Chan HM. Mammalian SWI/SNF chromatin remodeling complexes: emerging mechanisms and therapeutic strategies. Trends Genet. 2020;36(12):936–950. - PubMed
    1. Otto JE, Ursu O, Wu AP, et al. Structural and functional properties of mSWI/SNF chromatin remodeling complexes revealed through single-cell perturbation screens. Mol Cell. 2023;83(8):1350–1367.e7. - PubMed
    1. Pulice JL, Kadoch C. Composition and function of mammalian SWI/SNF chromatin remodeling complexes in human disease. Cold Spring Harb Symp Quant Biol. 2016;81:53–60. - PubMed
    1. Wu J, Krchma K, Lee HJ, et al. Requisite chromatin remodeling for myeloid and erythroid lineage differentiation from erythromyeloid progenitors. Cell Rep. 2020;33(7) - PMC - PubMed

Publication types

MeSH terms