. 2024 May 23;143(21):2152-2165.
doi: 10.1182/blood.2023023381.

CD19-CD28: an affinity-optimized CD28 agonist for combination with glofitamab (CD20-TCB) as off-the-shelf immunotherapy

Affiliations

CD19-CD28: an affinity-optimized CD28 agonist for combination with glofitamab (CD20-TCB) as off-the-shelf immunotherapy

Johannes Sam et al. Blood. .

Abstract

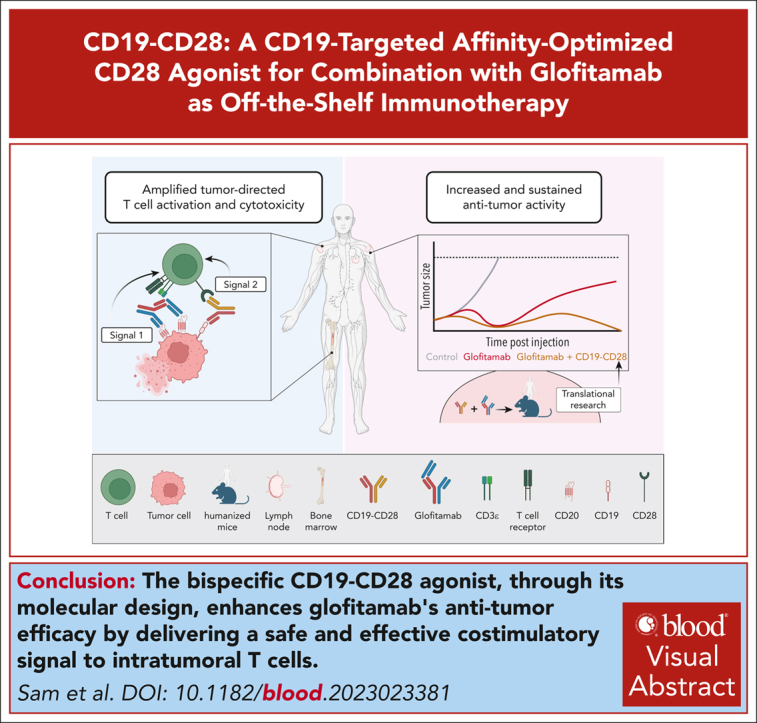
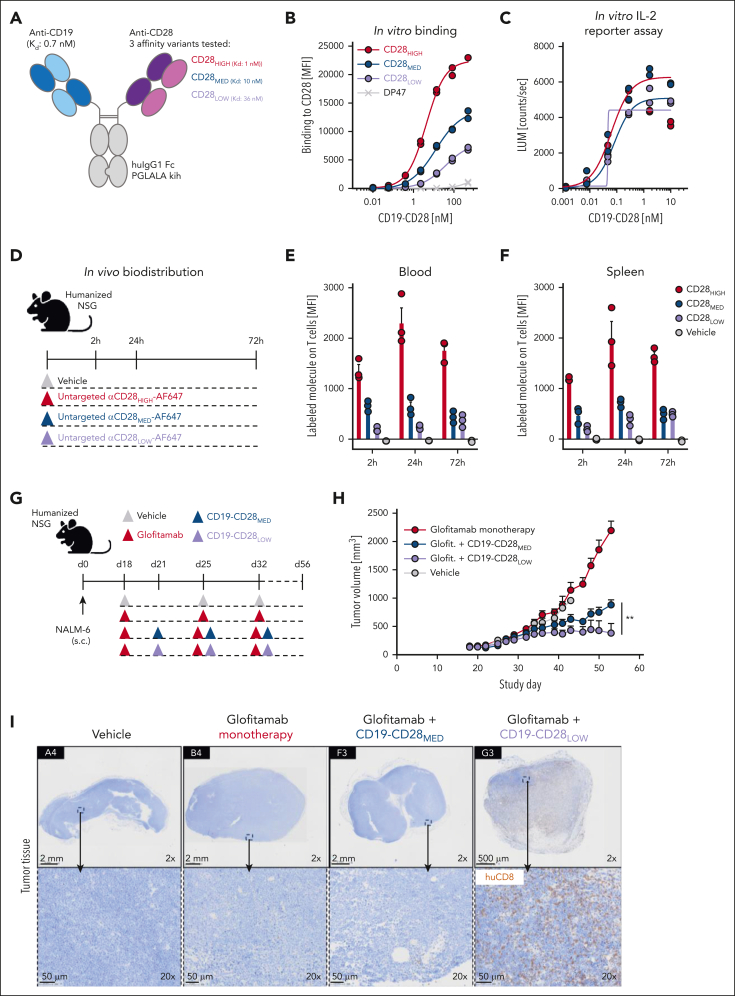
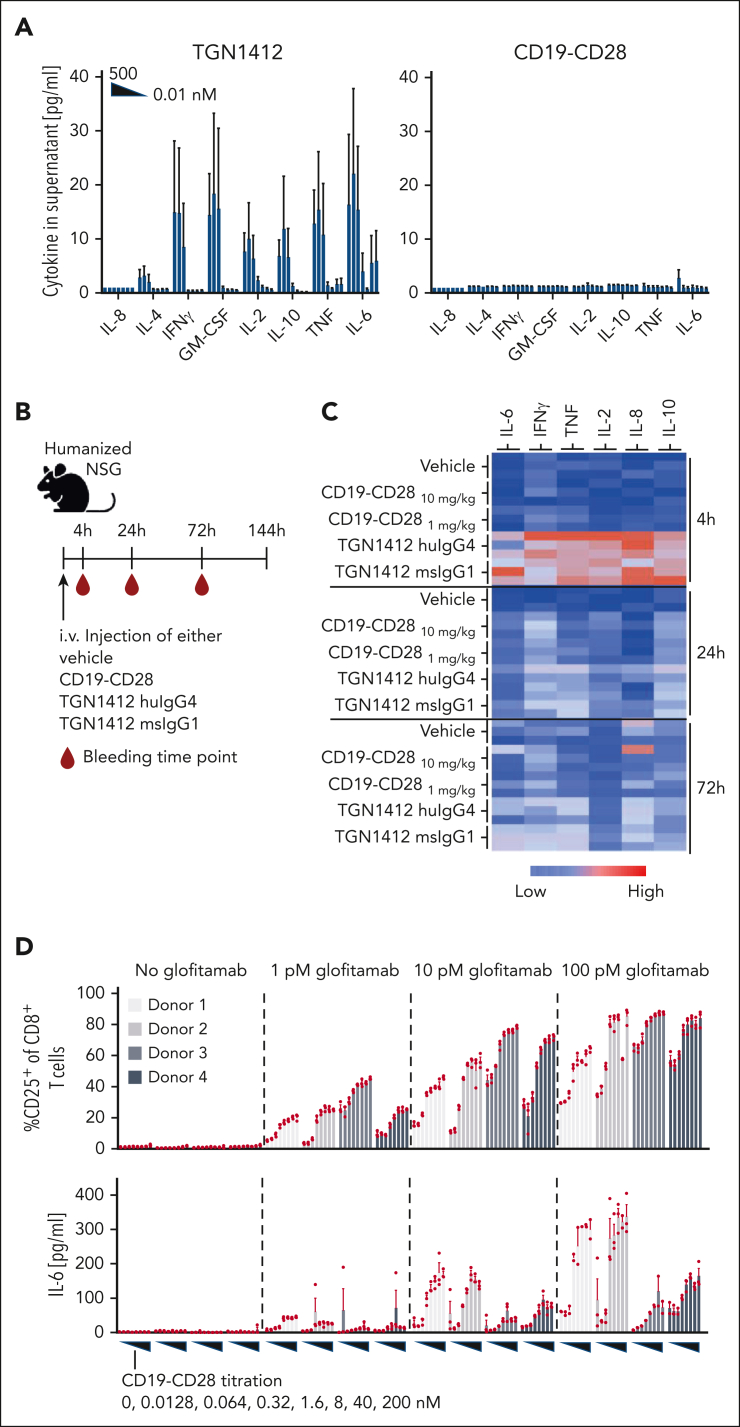
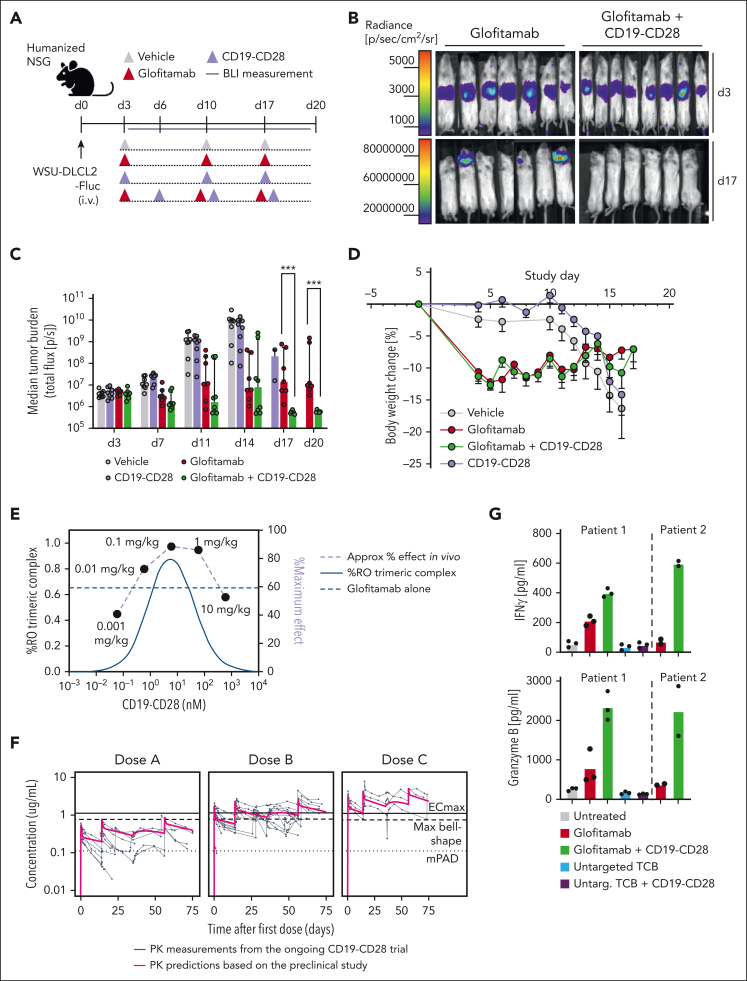
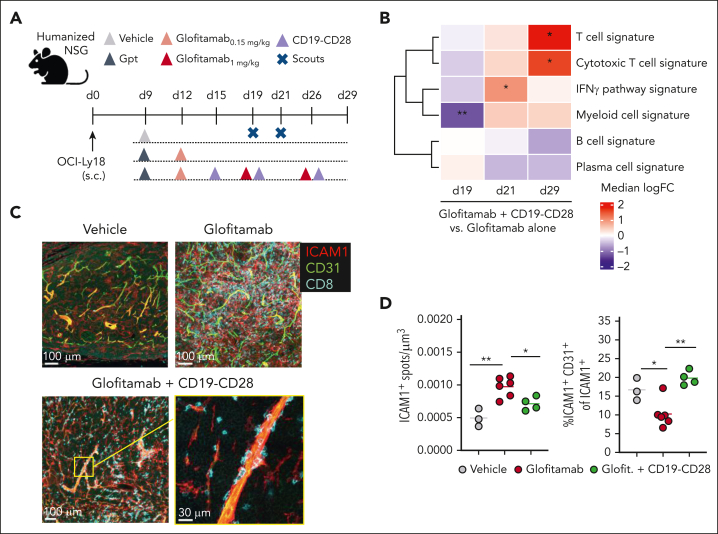
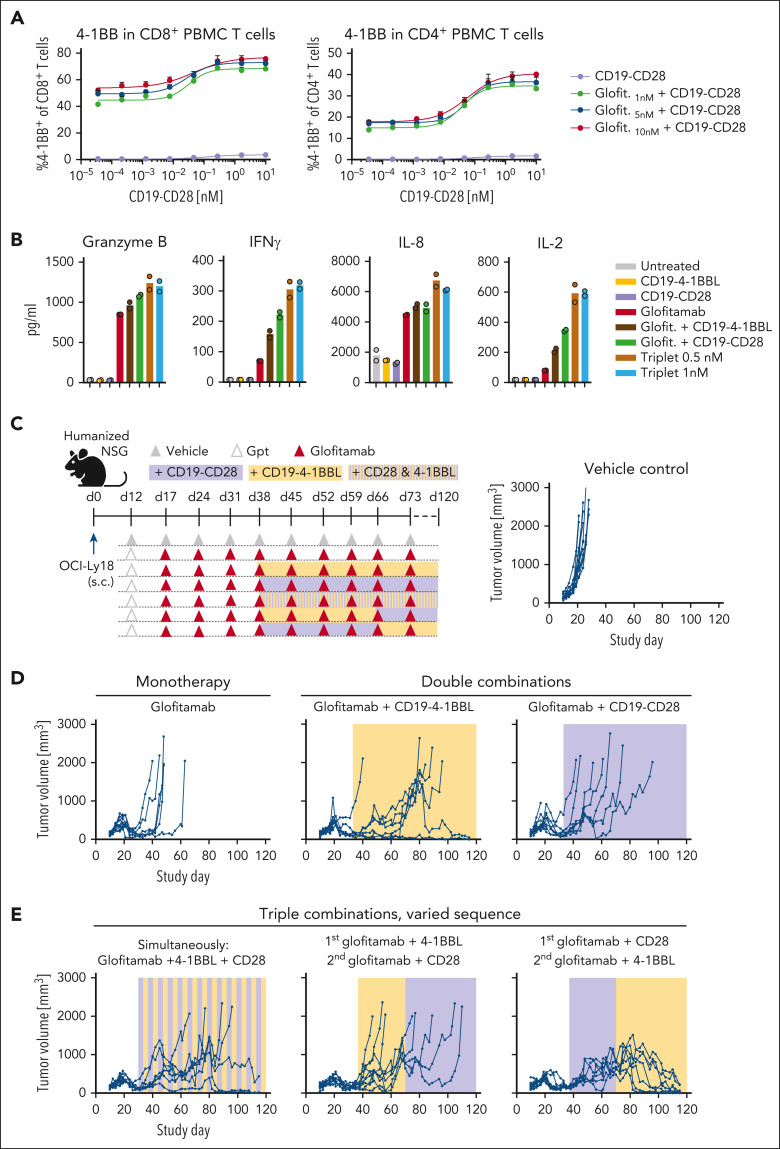
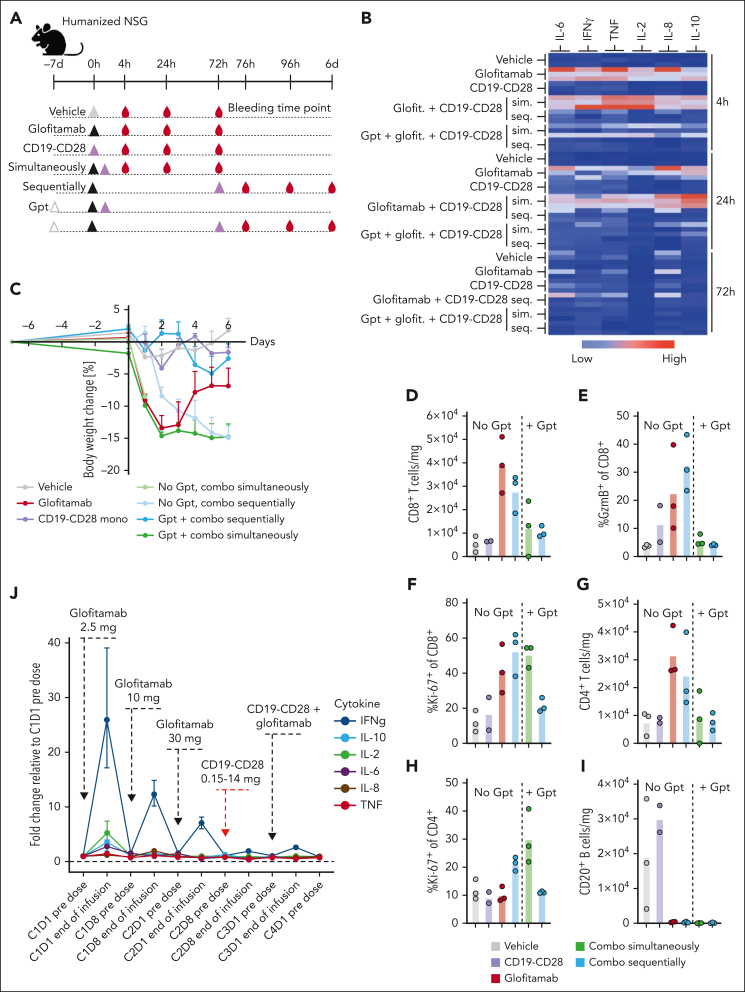
Effective T-cell responses not only require the engagement of T-cell receptors (TCRs; "signal 1"), but also the availability of costimulatory signals ("signal 2"). T-cell bispecific antibodies (TCBs) deliver a robust signal 1 by engaging the TCR signaling component CD3ε, while simultaneously binding to tumor antigens. The CD20-TCB glofitamab redirects T cells to CD20-expressing malignant B cells. Although glofitamab exhibits strong single-agent efficacy, adding costimulatory signaling may enhance the depth and durability of T-cell-mediated tumor cell killing. We developed a bispecific CD19-targeted CD28 agonist (CD19-CD28), RG6333, to enhance the efficacy of glofitamab and similar TCBs by delivering signal 2 to tumor-infiltrating T cells. CD19-CD28 distinguishes itself from the superagonistic antibody TGN1412, because its activity requires the simultaneous presence of a TCR signal and CD19 target binding. This is achieved through its engineered format incorporating a mutated Fc region with abolished FcγR and C1q binding, CD28 monovalency, and a moderate CD28 binding affinity. In combination with glofitamab, CD19-CD28 strongly increased T-cell effector functions in ex vivo assays using peripheral blood mononuclear cells and spleen samples derived from patients with lymphoma and enhanced glofitamab-mediated regression of aggressive lymphomas in humanized mice. Notably, the triple combination of glofitamab with CD19-CD28 with the costimulatory 4-1BB agonist, CD19-4-1BBL, offered substantially improved long-term tumor control over glofitamab monotherapy and respective duplet combinations. Our findings highlight CD19-CD28 as a safe and highly efficacious off-the-shelf combination partner for glofitamab, similar TCBs, and other costimulatory agonists. CD19-CD28 is currently in a phase 1 clinical trial in combination with glofitamab. This trial was registered at www.clinicaltrials.gov as #NCT05219513.


Conflict of interest statement

Conflict-of-interest disclosure: J.S., T.H., C. Kuettel, C.C., S.H., G.G., K.K., M.L., M.J.E., D.M., C.J., K.L., S.M.K., B.G., J.M., S.K., L.K., S.W., S.B., S. Gebhardt, A.V., B.A., V.N., D.S., M. Bez, E.B., J.E., C.H., F.L., S.J., A.S., M.L.C., S.C., M. Bacac, S. Gasser, C. Klein, and P.U. are employees of Roche and hold ownership of Roche stocks and patents. The remaining authors declare no competing financial interests.

Figures

None
Graphical abstract
Figure 1.
Figure 1.
Design and functional evaluation of an affinity-optimized CD19-targeted CD28 agonist. (A) CD19-CD28 is composed of one CD19 binder and one CD28 binder. The Fc part is devoid of FcγR binding (huIgG1 PGLALA). Heterodimerization and correct assembly are achieved via knob into hole (kih) mutation and CrossMab technology. (B) Binding of CD19-CD28 affinity variants to human CD28 on CHO cells, genetically modified to overexpress CD28. To monitor unspecific binding interactions, a DP47 huIgG1 was included as negative control. Binding was assessed via flow cytometry. Dots show individual values of technical duplicates. (C) Luciferase activity in an IL-2 reporter assay with Jurkat IL-2 promoter cells after 6 hours of stimulation with increasing concentrations (0.5 pM to 200 nM) of CD19-CD28 and 10 nM glofitamab. NALM-6 cells served as target cells (E:T ratio 5:1). Dots show individual values of technical duplicates. (D) Experimental design of an in vivo biodistribution study. Non–tumor bearing humanized NSG mice (3 mice per group) were treated with vehicle (histidine buffer) or 5 mg/kg of untargeted, Alexa-Fluor-647-(AF647)-labeled CD28 affinity variants. (E-F) Blood and splenic T cells were analyzed for drug binding via flow cytometry. Bars show mean + standard error of the mean (SEM) of 3 animals per group and time point. Dots show values of individual mice. (G) Experimental design of in vivo efficacy study. Humanized NSG mice (9-10 mice per group) were subcutaneously (s.c.) injected with 1 × 106 NALM-6 lymphoma cells in 1 flank. After 18 days, mice were treated IV with vehicle (histidine buffer), 0.15 mg/kg glofitamab, and 1 mg/kg CD19-CD28 variants according to the depicted timeline. (H) Tumor volumes shown as mean + SEM of 9 to 10 mice per group. Significance was calculated using an unpaired, 2-tailed Student t test. ∗∗P < .01. (I) Immunohistochemical analysis of CD8+ T-cell infiltration in tumors on study day 56. Upper row, ×2 original magnification. Lower row, ×20 original magnification. Images were captured with a VS120 virtual slide microscope (Olympus) and analyzed with Tissue Studio software (Definiens) for cell quantification. E:T, effector to target; glofit., glofitamab.
Figure 2.
Figure 2.
CD19-CD28 is not superagonistic and relies on signal 1. (A) Activity of human PBMCs in response to TGN1412 and CD19-CD28. PBMCs isolated from buffy coats of 3 donors were stimulated with TGN1412 or CD19-CD28 (dose titration, 0-500 nM) and cytokine release was analyzed after 48 hours via multiplex analysis. Bars show mean + SEM of technical triplicates from 3 donors. (B) Experimental design of in vivo cytokine release evaluation. Non–tumor bearing humanized NSG mice (3 mice per group) were treated IV with vehicle (histidine buffer), CD19-CD28 (10 or 1 mg/kg), TGN1412 huIgG4 (10 mg/kg), or TGN1412 msIgG1 (10 mg/kg). (C) Multiplex analysis of serum cytokines at indicated time points after treatment. The absolute cytokine values are shown in supplemental Table 1. (D) Human PBMCs from 4 healthy donors were stimulated with glofitamab (0, 1, 10, or 100 pM) and increasing concentrations of CD19-CD28 (0-200 nM). Upper row, the percentage of CD25 expression on CD8+ T cells was analyzed by flow cytometry after 72 hours. Bars show mean + SEM of technical triplicates for each donor. Dots show individual values. Lower row, multiplex analysis of IL-6 in culture supernatants after 48 hours. Bars show mean + SEM of technical triplicates. Dots show individual values. The shades of gray correspond to different donors, with each donor consistently represented by the same shade across all treatment conditions.
Figure 3.
Figure 3.
CD19-CD28 boosts the efficacy of glofitamab in a dose-dependent manner in vivo and enhances its activity on patient-derived T cells. (A) Experimental design of in vivo efficacy study. Humanized NSG mice bearing orthotopic WSU-DLCL2-Fluc tumors (8 mice per group) were treated with vehicle (histidine buffer), glofitamab (0.15 mg/kg), and CD19-CD28 (1 mg/kg) IV according to the displayed timeline. (B) Visualization of tumor growth in treated mice after luciferin injection. (C) Tumor burden evaluated by bioluminescence signal (total flux, photons/second) calculated as the mean radiance integrated over the region of interest. Dots represent individual mice. Bars show the median signal + IQR for each treatment group. Statistical analysis was performed using an ordinary 1-way analysis of variance (ANOVA) with Fisher least significant test. ∗∗∗P < .0001. (D) Body weight kinetics. Dots represent means -SEM of 8 mice per group. (E) Overlay of in vivo dose finding experiment with in silico modeling for trimeric complex formation. (F) Overlay of predicted human PK from on hFcRn tg32 mice and preclinical efficacy thresholds based on in vivo studies in NSG mice with PK measurements in participants of the ongoing CD19-CD28 phase 1 trial (NCT05219513). (G) PBMCs from 2 patients with DLBCL (patient 1 and 2) were depleted for internal B cells and were stimulated with the indicated treatments (glofitamab, untargeted TCB, and CD19-CD28 were used at a concentration of 1 nM) in the presence of NALM-6 target cells (E:T ratio: 3:1). Graphs show IFNγ and granzyme B release after 72 hours, assessed via cytokine bead array. Bars show means and dots show individual values from technical triplicates (patient 1) and duplicates (patient 2). BLI, bioluminescence imaging; IQR, interquartile range; max, maximum.
Figure 4.
Figure 4.
CD19-CD28 increases proinflammatory T-cell signatures in tumors and facilitates transendothelial migration. (A) Experimental design of in vivo efficacy study. OCI-Ly18 tumor-bearing humanized NSG mice were treated with vehicle (histidine buffer, 10 mice per group), glofitamab (0.15 mg/kg or 1 mg/kg, 25 mice per group), and CD19-CD28 (1 mg/kg, 25 mice per group). On day 19 and 21, five scouts per group were euthanized for analysis. Gpt: Gazyva (obinutuzumab) pretreatment, 30 mg/kg. (B) Gene signature analysis via RNA sequencing from frozen tumor tissue at different time points. Color code shows change between glofitamab monotherapy vs combination with CD19-CD28 (red denotes higher and blue lower expression in the combination). Statistical significance was calculated using ∗P < .05, ∗∗P < .01 (adjusted for multiple testing using FDR correction). Individual genes are shown in supplemental Figure 5E (C) Immunofluorescence microscopy of tumors on study day 29, showing ICAM1 (red), CD31 (green), and CD8 (cyan). Images were captured on a Leica SP8 inverted confocal microscope using a 40× lens, with a resolution of 512 × 512 pixels and a z-spacing of 1.5 μm. (D) Image quantification was performed with Imaris 9.6. Dot plots show spots created on ICAM1 signal per μm3 (left) and spots created on ICAM1-expressing endothelial (CD31+) cells of total ICAM1-expressing cells in tumors (right) on study day 29, quantified by fluorescence microscopy. Dots represent intratumoral regions from 1 or more mice. One-way ANOVA with Tukey multiple comparison test: ∗P < .05; ∗∗P < .01. FDR, false discovery rate; ICAM1, intercellular adhesion molecule 1.
Figure 5.
Figure 5.
Triple combination of glofitamab with CD19-CD28 and CD19–4-1BBL deepens and prolongs antitumor responses in vivo. (A) PBMC-derived T cells from a healthy donor were stimulated with glofitamab and a dose titration of CD19-CD28. Graphs show 4-1BB expression of CD4+ and CD8+ T cells after 48 hours, assessed via flow cytometry. Shown are mean + SEM of technical triplicates. (B) Cytokine release of splenocytes derived from a patient with BCL after 72 hours of stimulation with 25 pM glofitamab and/or CD19-CD28 or CD19–4-1BBL at 0.5 or 1 nM. Cytokines were assessed via cytokine bead array. Bars show means and dots indicate individual values of technical duplicates. (C) Experimental design of in vivo efficacy study in OCI-Ly18 tumor-bearing humanized NSG mice. Twelve mice per group received vehicle (histidine buffer) or obinutuzumab pretreatment (Gpt, 30 mg/kg), followed by weekly injections of glofitamab (5 mg/kg) alone or in combination with CD19-CD28 (1 mg/kg), CD19–4-1BBL (1 mg/kg) according to the depicted scheme. Costimulatory antibodies were injected simultaneously with glofitamab. (D-E) Tumor volumes assessed via caliper. Each line represents tumor volume over time in 1 mouse.
Figure 6.
Figure 6.
Pretreatment with Gpt, followed by sequential administration of glofitamab and CD19-CD28 mitigates cytokine release. (A) Non–tumor bearing humanized NSG mice (6 mice per group) were treated according to the depicted scheme, using the following doses: Gpt, 30 mg/kg; glofitamab, 0.15 mg/kg; CD19-CD28, 1 mg/kg. Histidine buffer was used as vehicle. Glofitamab and CD19-CD28 were either administered simultaneously (sim.) or sequentially (seq.), with a 3-day interval between treatments. Seq. and sim. combinations were either administered with or without Gpt 7 days before therapy. (B) Multiplex analysis of cytokines in serum at 4, 24, and 72 hours after last therapy injection. The absolute cytokine values are reported in supplemental Table 2. (C) Body weight kinetics. Dots show mean + SEM of body weight change of 6 mice per group. (D-I) Comparative analysis of T-cell activation and B-cell depletion in spleens, assessed via flow cytometry on study day 6. Bars show means, and dots indicate values of individual remaining mice at study termination. (J) Line plot shows mean fold change of plasma cytokine concentrations at indicated time points in patients with R/R NHL enrolled in the phase 1 clinical trial of glofitamab in combination with CD19-CD28 (NCT05219513). The error bars indicate SEM, and the dashed horizontal line indicates the baseline. The timing of each drug administration is shown by the dashed arrows. CxDx, cycle x day x.

Comment in

References

    1. Ahmed H, Mahmud AR, Siddiquee MFR, et al. Role of T cells in cancer immunotherapy: opportunities and challenges. Cancer Pathog Ther. 2023;1(2):116–126. - PMC - PubMed
    1. Waldman AD, Fritz JM, Lenardo MJ. A guide to cancer immunotherapy: from T cell basic science to clinical practice. Nat Rev Immunol. 2020;20(11):651–668. - PMC - PubMed
    1. Esensten JH, Helou YA, Chopra G, Weiss A, Bluestone JA. CD28 costimulation: from mechanism to therapy. Immunity. 2016;44(5):973–988. - PMC - PubMed
    1. Lavin Y, Kobayashi S, Leader A, et al. Innate immune landscape in early lung adenocarcinoma by paired single-cell analyses. Cell. 2017;169(4):750–765.e17. - PMC - PubMed
    1. Tirosh I, Izar B, Prakadan SM, et al. Dissecting the multicellular ecosystem of metastatic melanoma by single-cell RNA-seq. Science. 2016;352(6282):189–196. - PMC - PubMed

Associated data