. 2024 Mar 4;7(5):e202302330.
doi: 10.26508/lsa.202302330. Print 2024 May.

Altered myocardial lipid regulation in junctophilin-2-associated familial cardiomyopathies

Affiliations

Altered myocardial lipid regulation in junctophilin-2-associated familial cardiomyopathies

Satadru K Lahiri et al. Life Sci Alliance. .

Abstract

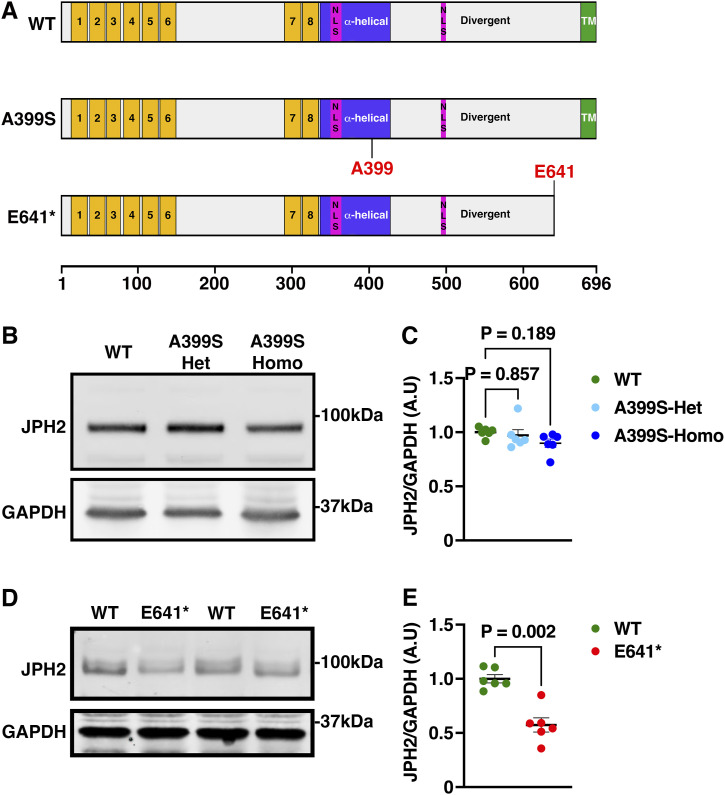
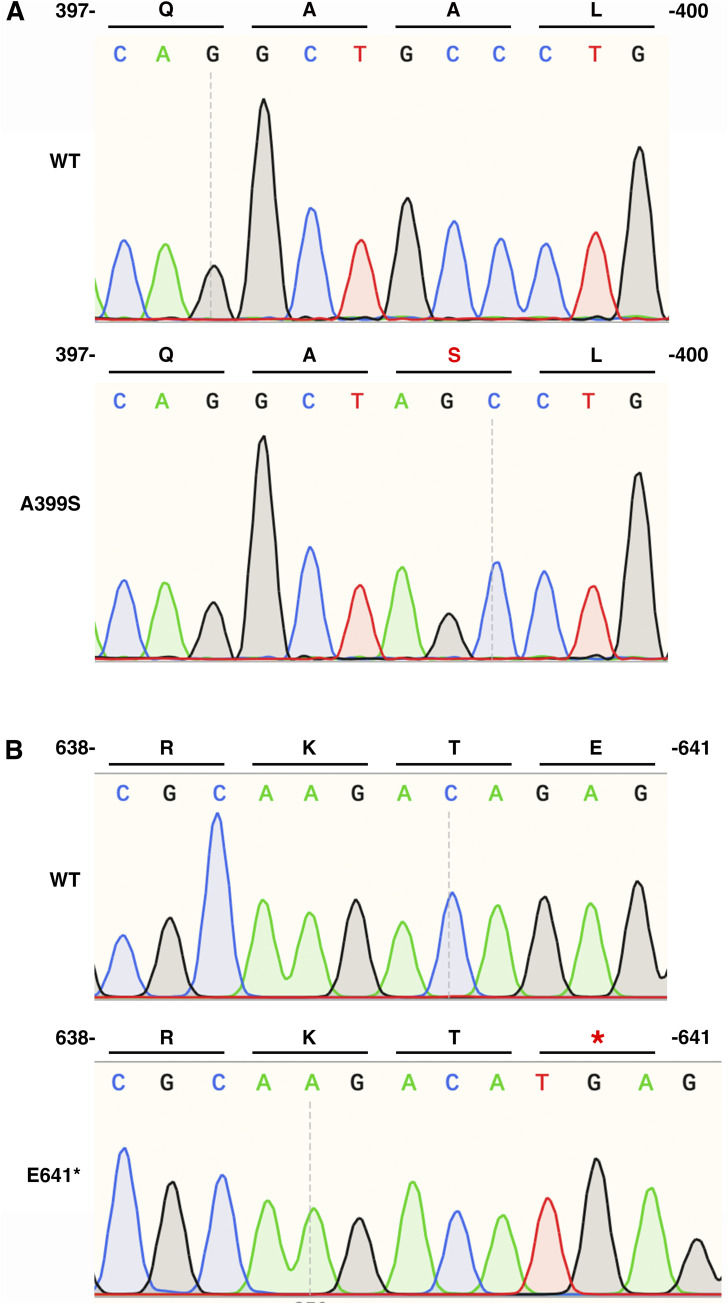
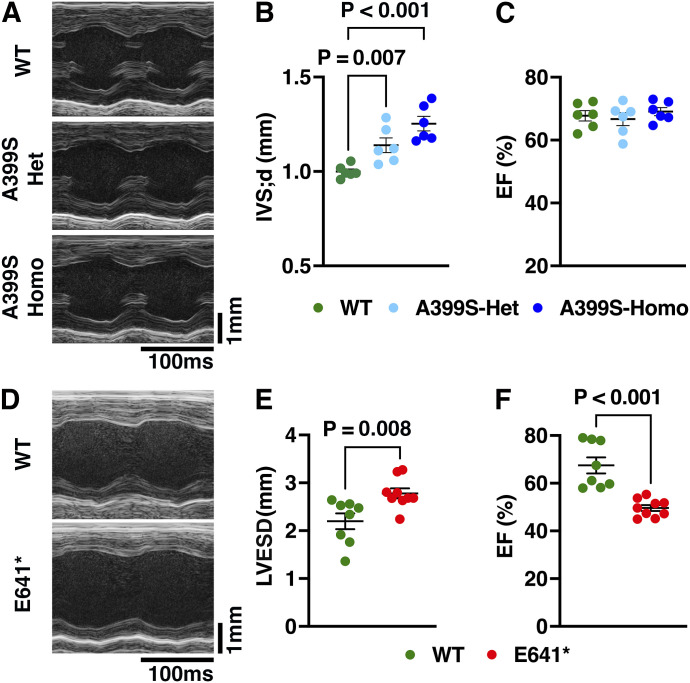
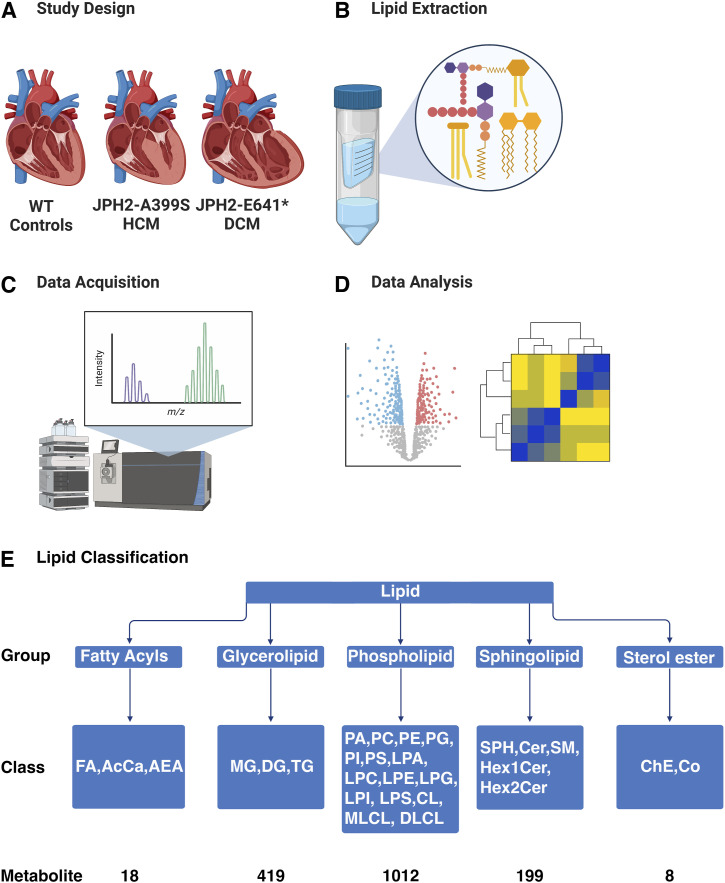
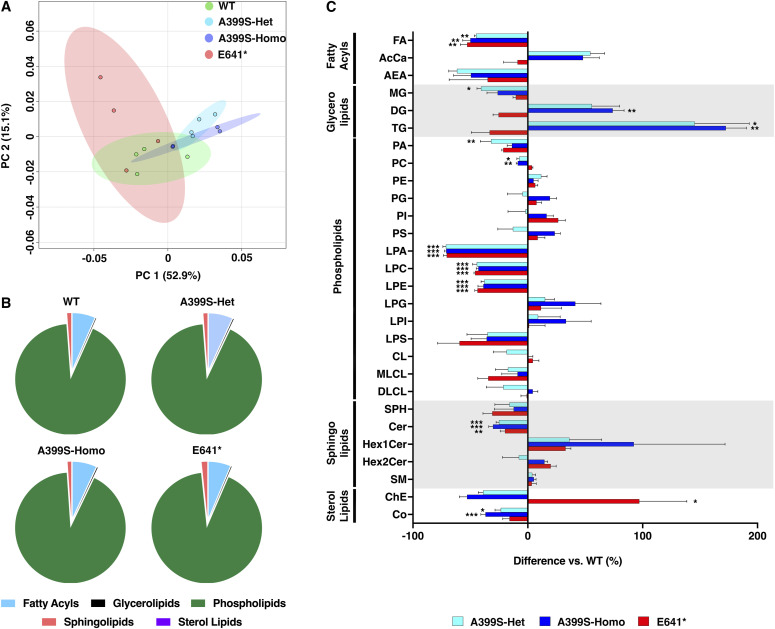
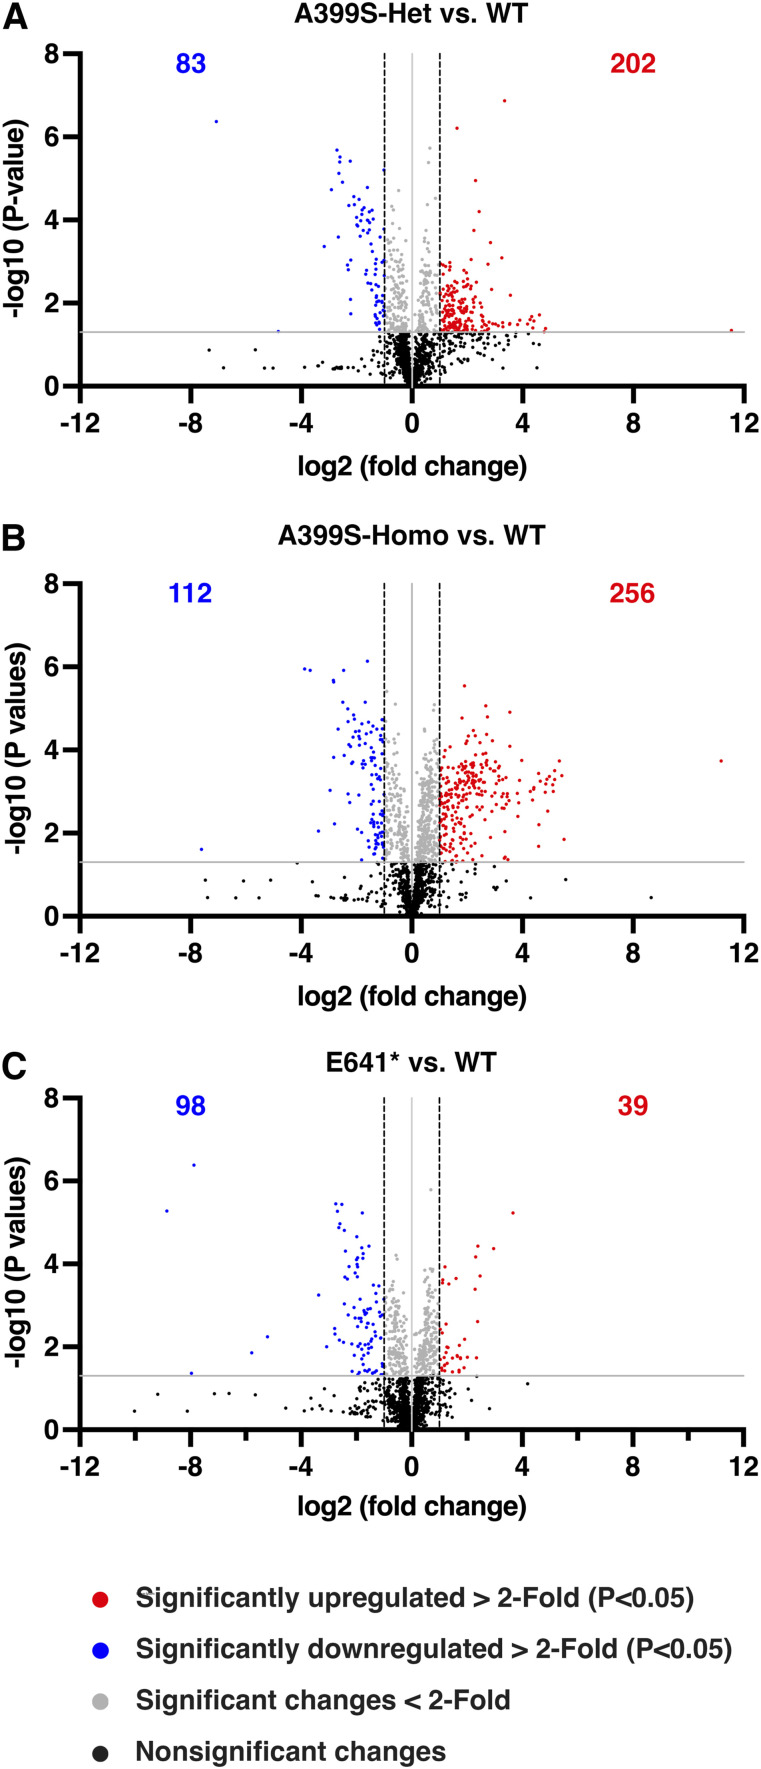
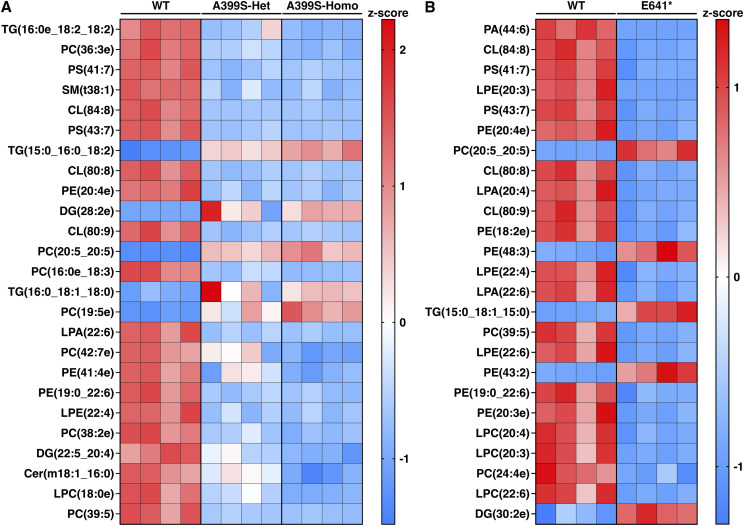
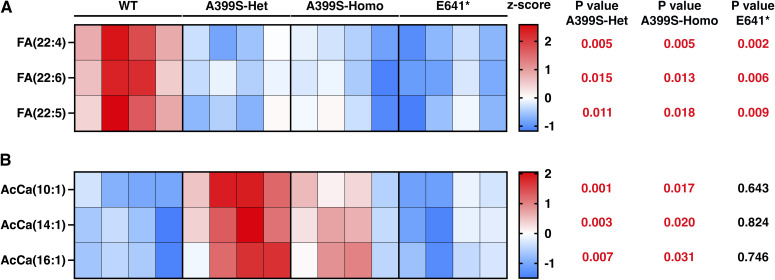
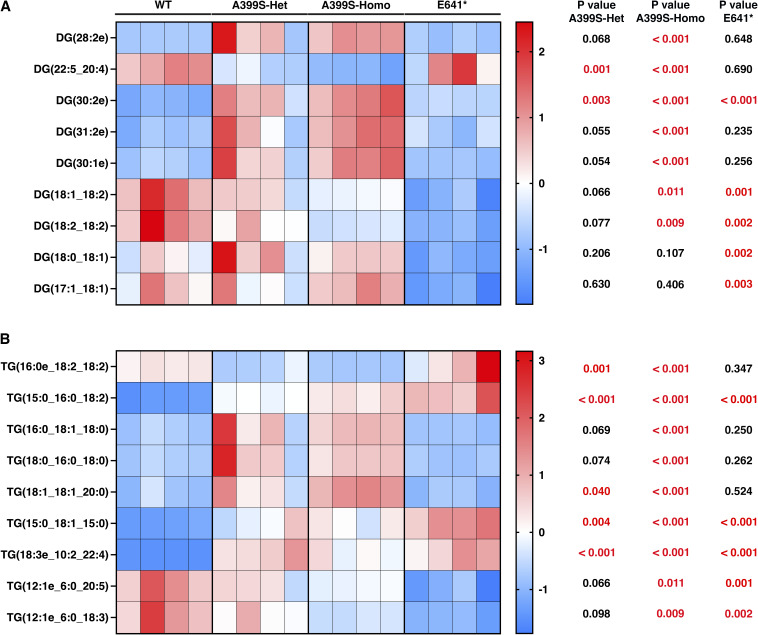
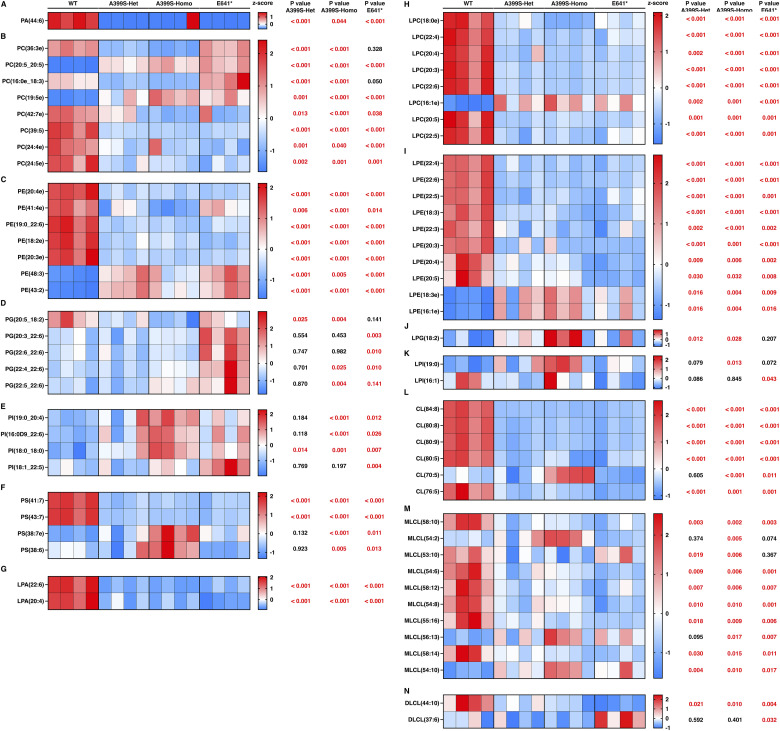
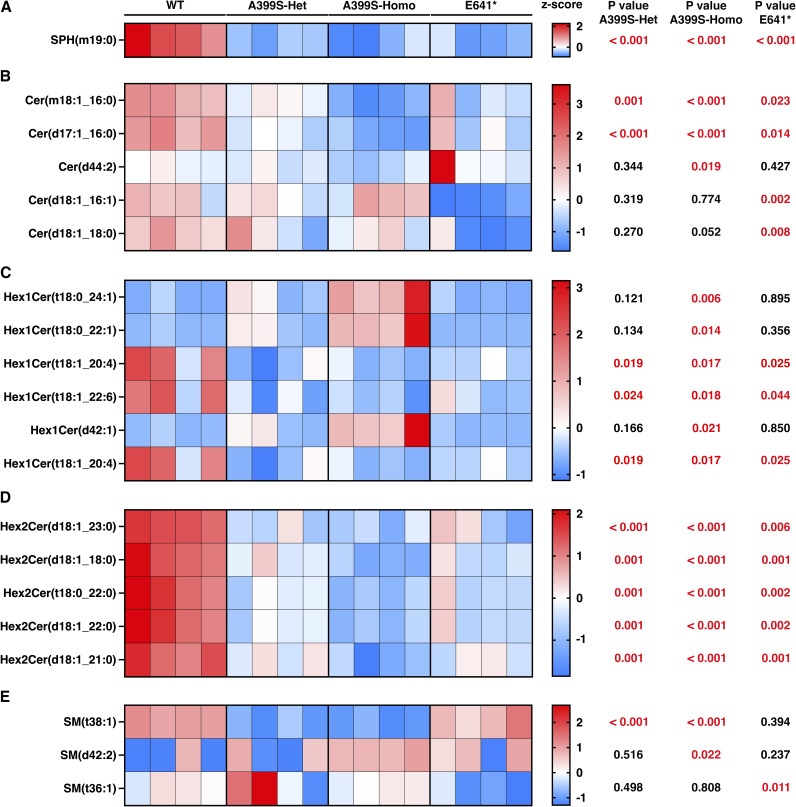
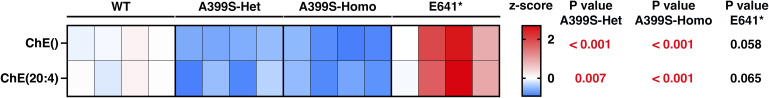
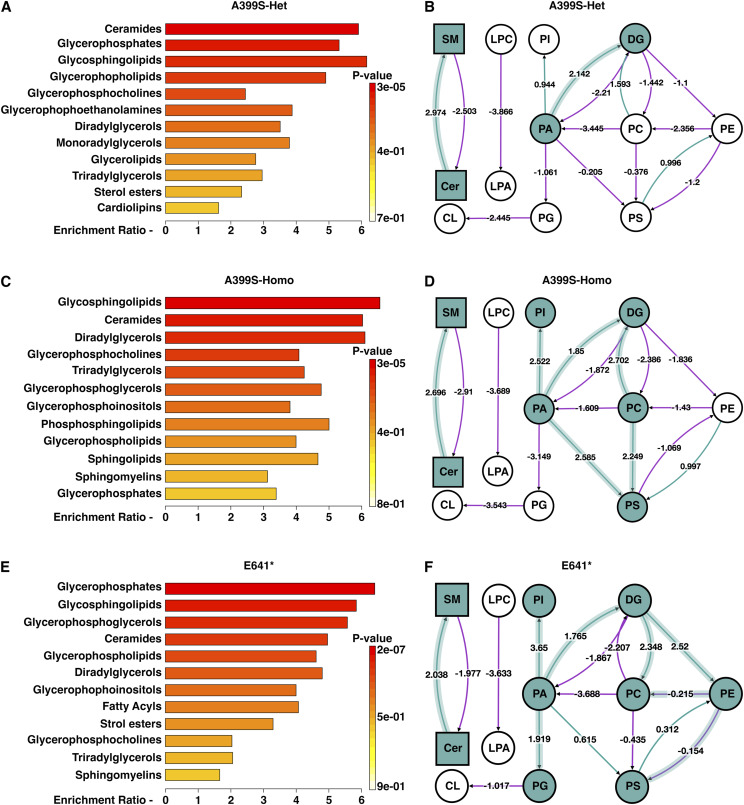
Myocardial lipid metabolism is critical to normal heart function, whereas altered lipid regulation has been linked to cardiac diseases including cardiomyopathies. Genetic variants in the JPH2 gene can cause hypertrophic cardiomyopathy (HCM) and, in some cases, dilated cardiomyopathy (DCM). In this study, we tested the hypothesis that JPH2 variants identified in patients with HCM and DCM, respectively, cause distinct alterations in myocardial lipid profiles. Echocardiography revealed clinically significant cardiac dysfunction in both knock-in mouse models of cardiomyopathy. Unbiased myocardial lipidomic analysis demonstrated significantly reduced levels of total unsaturated fatty acids, ceramides, and various phospholipids in both mice with HCM and DCM, suggesting a common metabolic alteration in both models. On the contrary, significantly increased di- and triglycerides, and decreased co-enzyme were only found in mice with HCM. Moreover, mice with DCM uniquely exhibited elevated levels of cholesterol ester. Further in-depth analysis revealed significantly altered metabolites from all the lipid classes with either similar or opposing trends in JPH2 mutant mice with HCM or DCM. Together, these studies revealed, for the first time, unique alterations in the cardiac lipid composition-including distinct increases in neutral lipids and decreases in polar membrane lipids-in mice with HCM and DCM were caused by distinct JPH2 variants. These studies may aid the development of novel biomarkers or therapeutics for these inherited disorders.


Conflict of interest statement

XHT Wehrens serves as a consultant for Pfizer and Rocket Pharmaceuticals, in addition to being a founding partner and board member at Elex Biotech Inc. The remaining authors have no relevant disclosures to report.

Figures

Figure 1.
Figure 1.. JPH2 protein levels in JPH2 mutant mouse hearts.
(A) Schematic cartoon of the mouse JPH2 protein showing WT, A399S missense variant, and the truncating E641* variant. Yellow domains (1–8) mark the “membrane occupancy and recognition nexus” domains; pink domains mark nuclear localization sequences; and green domains mark the transmembrane (TM) domain. (B, C) Representative Western blot images (B) and quantification of JPH2 protein levels normalized to GAPDH levels in hearts from A399S-Het and A399S-Homo mutant mice (C). N = 6 in each group. One-way ANOVA was used to determine potential statistical differences between the three groups. (D) Representative Western blot images of JPH2 and GAPDH in hearts from E641* mutant mice. NS indicates non-specific protein bands in WB. (E) Quantification of JPH2 protein levels normalized to GAPDH levels in hearts from E641* mutant mice. N = 6 in each group. The Mann–Whitney test was used to calculate the statistical significance between the two groups. Average values are represented as the mean ± SEM. Source data are available for this figure.
Figure S1.
Figure S1.. Validation of JPH2 mutations by Sanger sequencing.
(A) Sequencing chromatogram depicting the substitution of alanine (A) to serine (S) at residue 399 in the Jph2 gene of A399S-homozygous mice. (B) Sequencing data show the introduction of a premature stop codon (*) at residue 641 in the Jph2 gene of E641-heterozygous mice (after TA cloning of the mutant allele).
Figure 2.
Figure 2.. JPH2 variants in knock-in mice cause different types of cardiomyopathy.
(A) Representative M-mode echocardiography images from A399S-homozygous (Homo), A399S-heterozygous (Het), and WT littermate controls. (B, C) Quantification of the intraventricular septum (IVS) thickness in diastole (B) and ejection fraction (EF) (C) in A399S mutant mice compared with WT controls. N = 6 in each group. One-way ANOVA was used to calculate the statistical significance between the three groups. (D) Representative M-mode echocardiography images from E641* Het and WT controls. (E, F) Quantification of left ventricular end-systolic diameter (E) and ejection fraction (EF) (F) in E641* mutants compared with WT controls. N = 8 in WT and 9 in the E641* group. The Mann–Whitney test was used to calculate the statistical significance between the two groups. All values are represented as the mean ± SEM.
Figure 3.
Figure 3.. Schematic flowchart of the lipidomic screening and analysis.
(A) Hearts were obtained from WT controls, JPH2-A399S-Het, JPH2-A399S-Homo mutant mice, and JPH2-E641* Het mutant mice. (B) Lipids were extracted from cardiac tissue samples of these groups of mice using methanol, methyl tert-butyl ether, and water as described in this study. (C) Lipidomic analysis was performed using a Vanquish UPLC and an Orbitrap Lumos mass spectrometer (Thermo Fisher Scientific Inc.). (D) Data analysis was performed using LipidSearch and BioPAN. (E) Lipids were classified into five categories (fatty acyls, glycerolipids, phospholipids, sphingolipids, and sterol esters) and 28 classes (abbreviations are shown below these five categories). Our analysis identified a total of 1,656 lipid metabolite subclasses (this level of detail is not shown here).
Figure 4.
Figure 4.. Altered lipid profiles in the hearts of JPH2 mutant mice.
(A) Principal component (PC) analysis showing the variance in the lipidomic data. PC1 accounted for 52.9%, and PC2 accounted for 15.1% of the variance. (B) Pie charts showing the distribution of major lipid groups (i.e., fatty acyls, glycerolipids, phospholipids, sphingolipids, and sterol lipids) in WT, A399S-Het, A399S-Homo, and E641* Het mice. (C) Bar graphs demonstrating changes in the levels of different classes of lipids in A399S-Het, A399S-Homo, and E641* Het mouse hearts compared with WT littermate controls. Individual lipid classes were normalized to the level in WT mice. All values are represented as the mean ± SEM. One-way ANOVA was performed, and the adjusted P-value is presented for each group compared with WT controls. *P < 0.05, **P < 0.01, and ***P < 0.001.
Figure 5.
Figure 5.. Fold changes in lipid metabolites in different JPH2 mutant mouse models.
(A, B, C) Volcano plots representing overall fold changes in lipid metabolites in A399S-Het (A), A399S-Homo (B), and E641* mice (C) compared with WT littermate controls. The horizontal gray line indicates a P-value of 0.05. Dots above the gray line indicate statistically significant fold changes in lipid metabolites. The vertical black dashed lines are placed at the cutoff fold changes of 2 (log (fold change) of 1) and −2 (log (fold change) of −1). Red dots indicate significantly increased lipid metabolites (>2 fold change), and blue dots indicate significantly reduced lipid metabolites (<−2 fold change). The number of significantly changed metabolites above the cutoff fold change is listed on each volcano plot in red (increased) and blue (decreased).
Figure 6.
Figure 6.. Alterations in lipid distribution in JPH2 mutant mouse models.
(A) Heatmap showing the top 25 most significantly changed lipid metabolites in A399S-Homo mice compared with Het and WT littermate controls. (B) Heatmap showing the top 25 most significantly changed lipid metabolites in E641* Het mice compared with WT littermate controls. Both heatmaps are plotted using row z-scores.
Figure S2.
Figure S2.. Altered lipid metabolites in the fatty acyl group in mice with cardiomyopathy because of JPH2 variants.
(A, B) Heatmaps showing significantly changed lipid metabolites of fatty acids (FA; (A)) and acylcarnitine (AcCa; (B)) in mice carrying different JPH2 variants. The top five lipid metabolites (based on the significance score) from both the A399S group and the E641* group were combined. Duplicate metabolites were removed from this combined list. The row z-scores were used to plot the heatmaps. t test was used to assess significance in the mutant groups compared with WT controls, and these P-values are listed next to the corresponding metabolites.
Figure S3.
Figure S3.. Altered lipid metabolites in the glycerolipid group in mice with cardiomyopathy because of JPH2 variants.
(A, B) Heatmaps showing significantly changed lipid metabolites of diglycerides (DG; (A)) and triglycerides (TG; (B)) in mice carrying different JPH2 variants. The top five lipid metabolites (based on the significance score) from both the A399S group and the E641* group were combined. Duplicate metabolites were removed from this combined list. The row z-scores were used to plot the heatmaps. t test was used to assess significance in the mutant groups compared with WT controls, and these P-values are listed next to the corresponding metabolites.
Figure S4.
Figure S4.. Altered lipid metabolites in the phospholipid group in mice with cardiomyopathy because of JPH2 variants.
(A, B, C, D, E, F, G, H, I, J, K, L, M, N) Heatmaps showing significantly changed lipid metabolites of phosphatidic acid (PA; (A)), phosphatidylcholine (PC; (B)), phosphatidylethanolamine (PE; (C)), phosphatidylglycerol (PG; (D)), phosphatidylinositol (PI; (E)), phosphatidylserine (PS; (F)), lysophosphatidic acid (LPA; (G)), lysophosphatidylcholines (LPC; (H)), lysophosphatidylethanolamine (LPE; (I)), lysophosphatidylglycerol (LPG; (J)), lysophosphatidylinositol (LPI; (K)), cardiolipin (CL; (L)), monolysocardiolipin (MLCL; (M)), and dilysocardiolipin (DLCL; (N)) in mice carrying different JPH2 variants. The top five lipid metabolites (based on the significance score) from both the A399S group and the E641* group were combined. Duplicate metabolites were removed from this combined list. The row z-scores were used to plot the heatmaps. t test was used to assess significance in the mutant groups compared with WT controls, and these P-values are listed next to the corresponding metabolites.
Figure S5.
Figure S5.. Altered lipid metabolites in the sphingolipid group in mice with cardiomyopathy because of JPH2 variants.
(A, B, C, D, E) Heatmaps showing significantly changed lipid metabolites of sphingosine (SPH; (A)), ceramides (Cer; (B)), hexosylceramides (Hex1Cer; (C)), dihexosylceramides (Hex2Cer; (D)), and sphingomyelin (SM; (E)) in mice carrying different JPH2 variants. The top five lipid metabolites (based on the significance score) from both the A399S group and the E641* group were combined. The duplicate metabolites were removed from this combined list. The row z-scores were used to plot the heatmaps. t test was used to assess significance in the mutant groups compared with WT controls, and these P-values are listed next to the corresponding metabolites.
Figure S6.
Figure S6.. Altered lipid metabolites in the sterol lipid group in mice with cardiomyopathy because of JPH2 variants.
Heatmaps showing significantly changed lipid metabolites in cholesterol ester (ChE) in JPH2 mutant mice. The top five lipid metabolites (based on the significance score) from both the A399 group and the E641* group were combined. Duplicate metabolites were removed from this combined list. The row z-scores were used to plot the heatmaps. t test was used to assess significance in the mutant groups compared with WT controls, and these P-values are listed next to the corresponding metabolites.
Figure 7.
Figure 7.. Lipid metabolite enrichment in JPH2 mutant models.
(A, C, E) Overview of enriched lipid metabolites in A399S-Het (A), A399S-Homo (C), and E641* mice (E) prepared using MetaboAnalyst. (B, D, F) Lipid class reaction pathway analysis for A399S-Het (B), A399S-Homo (D), and E641* mice (F) based on comprehensive lipidomic profiling in BioPAN. Green arrows are associated with positive z-scores, and purple arrows are associated with negative z-scores. The direction of the arrows indicates the direction of the reaction.

Similar articles

Cited by

References

    1. Arimoto T, Takeishi Y, Takahashi H, Shishido T, Niizeki T, Koyama Y, Shiga R, Nozaki N, Nakajima O, Nishimaru K, et al. (2006) Cardiac-specific overexpression of diacylglycerol kinase zeta prevents Gq protein-coupled receptor agonist-induced cardiac hypertrophy in transgenic mice. Circulation 113: 60–66. 10.1161/CIRCULATIONAHA.105.560771 - DOI - PubMed
    1. Beavers DL, Landstrom AP, Chiang DY, Wehrens XH (2014) Emerging roles of junctophilin-2 in the heart and implications for cardiac diseases. Cardiovasc Res 103: 198–205. 10.1093/cvr/cvu151 - DOI - PMC - PubMed
    1. Bennett HJ, Davenport JB, Collins RF, Trafford AW, Pinali C, Kitmitto A (2013) Human junctophilin-2 undergoes a structural rearrangement upon binding PtdIns(3,4,5)P3 and the S101R mutation identified in hypertrophic cardiomyopathy obviates this response. Biochem J 456: 205–217. 10.1042/BJ20130591 - DOI - PMC - PubMed
    1. Chatfield KC, Sparagna GC, Sucharov CC, Miyamoto SD, Grudis JE, Sobus RD, Hijmans J, Stauffer BL (2014) Dysregulation of cardiolipin biosynthesis in pediatric heart failure. J Mol Cell Cardiol 74: 251–259. 10.1016/j.yjmcc.2014.06.002 - DOI - PMC - PubMed
    1. Choi RH, Tatum SM, Symons JD, Summers SA, Holland WL (2021) Ceramides and other sphingolipids as drivers of cardiovascular disease. Nat Rev Cardiol 18: 701–711. 10.1038/s41569-021-00536-1 - DOI - PMC - PubMed