. 2024 Apr 24;44(17):e1568232024.
doi: 10.1523/JNEUROSCI.1568-23.2024.

Acetylcholine Engages Distinct Amygdala Microcircuits to Gate Internal Theta Rhythm

Affiliations

Acetylcholine Engages Distinct Amygdala Microcircuits to Gate Internal Theta Rhythm

Joshua X Bratsch-Prince et al. J Neurosci. .

Abstract

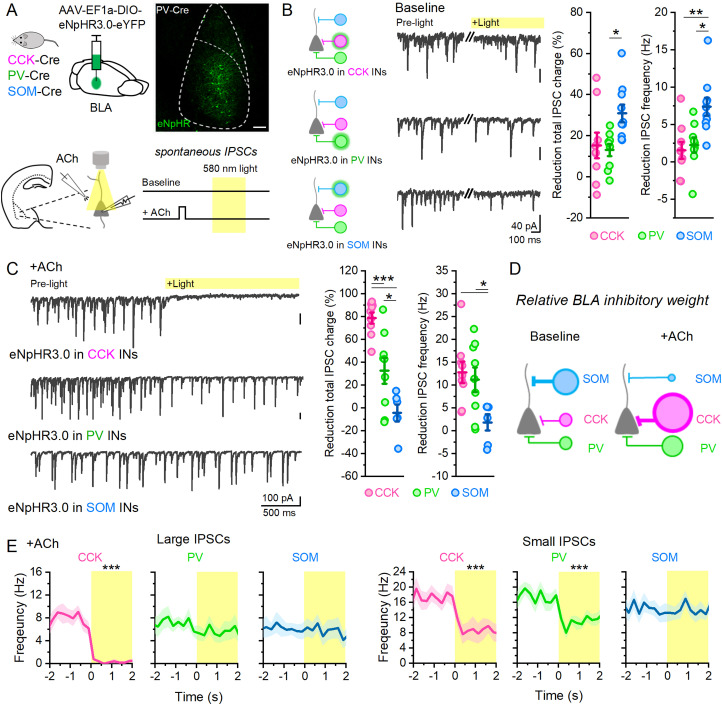
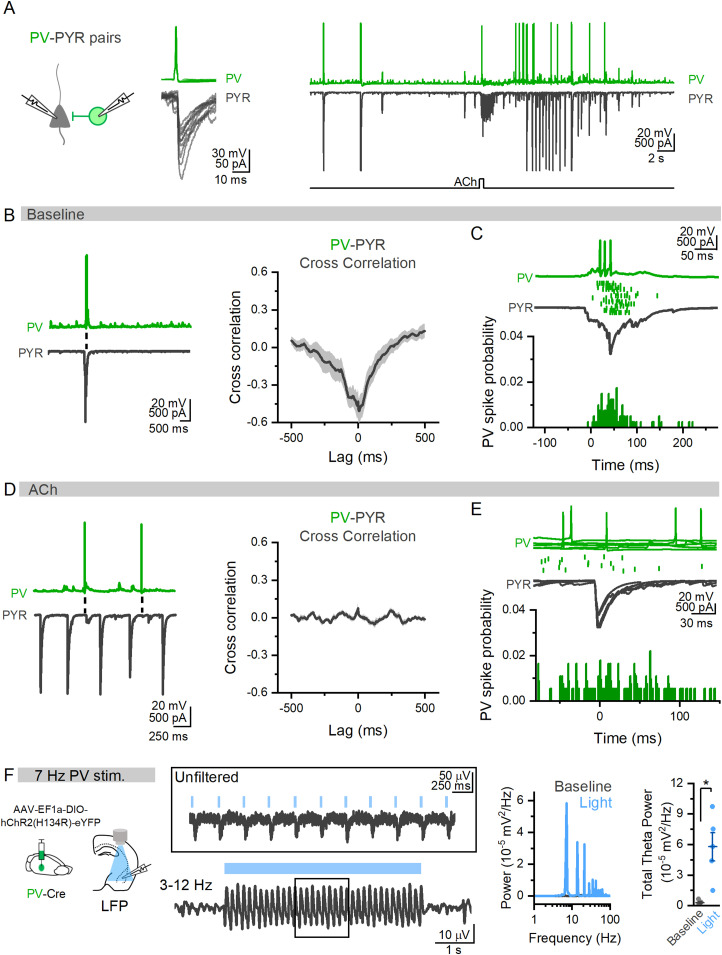
Acetylcholine (ACh) is released from basal forebrain cholinergic neurons in response to salient stimuli and engages brain states supporting attention and memory. These high ACh states are associated with theta oscillations, which synchronize neuronal ensembles. Theta oscillations in the basolateral amygdala (BLA) in both humans and rodents have been shown to underlie emotional memory, yet their mechanism remains unclear. Here, using brain slice electrophysiology in male and female mice, we show large ACh stimuli evoke prolonged theta oscillations in BLA local field potentials that depend upon M3 muscarinic receptor activation of cholecystokinin (CCK) interneurons (INs) without the need for external glutamate signaling. Somatostatin (SOM) INs inhibit CCK INs and are themselves inhibited by ACh, providing a functional SOM→CCK IN circuit connection gating BLA theta. Parvalbumin (PV) INs, which can drive BLA oscillations in baseline states, are not involved in the generation of ACh-induced theta, highlighting that ACh induces a cellular switch in the control of BLA oscillatory activity and establishes an internally BLA-driven theta oscillation through CCK INs. Theta activity is more readily evoked in BLA over the cortex or hippocampus, suggesting preferential activation of the BLA during high ACh states. These data reveal a SOM→CCK IN circuit in the BLA that gates internal theta oscillations and suggest a mechanism by which salient stimuli acting through ACh switch the BLA into a network state enabling emotional memory.

Keywords: acetylcholine; amygdala; emotion; interneuron; oscillation; theta.


Conflict of interest statement

The authors declare no competing financial interests.

Figures

Figure 1.
Figure 1.
Optogenetically released ACh bidirectionally modulates BLA LFP network activity. A, Confocal images of the BF and BLA in ChAT-ChR2 mice used for this study show ChAT expression in ChR2-expressing cells in the BF and vAChT expression in ChR2-expressing axons in the BLA (99% of ChR2-EGFP+ also ChAT+, 79% of ChAT+ cells also ChR2-EGFP+; 877 cells, 2 animals). Scale bars: 150, 25, and 5 µm. B, A representative waveform of BLA LFP recording showing a bidirectional effect of light stimulation (5 Hz for 5 s) on LFP activity in different frequency bands as separated with bandpass filters (short-time Fourier transform, below). C, Averaged normalized power spectrums from all slices before, during, and after light stimulation [10 slices (n), 6 animals (N)]. D, During the light stimulus (left), the total power in theta frequency (3–12 Hz) is decreased (0.69 ± 0.12 of baseline; paired t test; p = 0.039) while gamma frequency power (30–70 Hz) is not affected (0.97 ± 0.09 of baseline; paired t test; p = 0.77). After light (right), both theta (4.85 ± 1.08 of baseline; paired t test; p = 0.006) and gamma frequency power (1.92 ± 0.38 of baseline; paired t test; p = 0.037) are increased.
Figure 2.
Figure 2.
ACh induces large changes in BLA inhibitory activity. A, Baseline recordings of spontaneous network activity in BLA PYRs show low-frequency, large-amplitude events that are blocked by either CNQX (20 µM) or bicuculline (20 µM). B, Optogenetic stimulation (5 Hz, 5 s) produces large theta frequency rhythmic events (power spectrum for sample waveform) that persist beyond light stimulation and are blocked by bicuculline (inset). C, Comparing total theta power of ACh-induced events show they are not blocked by glutamate antagonists (CNQX, 20 µM + AP5, 50 µM; n = 12; N = 5) or a GABAB antagonist (CGP, 2 µM; n = 6; N = 3) but are blocked by a GABAA receptor antagonist (bicuculline; n = 7; N = 5), one-way ANOVA; p = 2.28 × 10−5. D, Sample waveforms from a representative cell showing rhythmic events after light in control (black), +Mec. (10 µM, blue), and +Atro. (5 µM, green). Normalized total charge of these events show they are not affected by Mec. but are blocked by Atro; n = 8; N = 6; one-way repeated-measures ANOVA; p = 1.66 × 10−10. They are also blocked by a selective M3 receptor antagonist 4DAMP (n = 8; N = 3), but not an M1 (Tzp; n = 5; N = 3) or M2 (AFDX; n = 8; N = 3) antagonist (green graph, right); one-way ANOVA; p = 5.8 × 10−10. E, Isolation of IPSCs (CNQX and AP5) following light stimulation shows a slow, robust increase in IPSC total charge and (inset) IPSC frequency of both small (1–3× average) and large (>5× average) amplitude IPSCs (n = 11; N = 6). F, Waveform from example cell showing large IPSCs (top). Superimposing each large IPSC shows they consistently contain multiple, summated IPCSs (arrows, example IPSC dark blue trace, other IPSCs light blue traces).
Figure 3.
Figure 3.
Optogenetically released ACh more reliably activates BLA over PL or vHPC inhibitory networks. A, Sample recording from a BLA PYR where rhythmic theta activity was produced following 25 pulses of light stimulation (5 Hz), but not 5 pulses. B, Heatmaps showing large IPSC frequency (1 s time bins) in all BLA cells that received 1, 5, 25, and 50 pulses of light stimulation (5 Hz) in ACSF (top) and in the presence of physostigmine (1 µM). C, Plot showing the percentage of BLA cells that show sustained (>1 s) theta frequency large IPSCs in ACSF and physostigmine (n = 16; N = 6). D, E, In the same conditions, 25 pulses of light did not evoke large IPSCs from a layer 2/3 PYR in the PL (n = 10; N = 4) (D) or CA1 PYR in vHPC (n = 16; N = 7) (E), while in that same cell, puff application of ACh (1 mM) could (insets, bottom). Heatmaps of IPSC frequency after ACh stimulation in all PL and vHPC PYRs highlight reduced sensitivity to ACh in these regions compared with the BLA.
Figure 4.
Figure 4.
ACh shifts dominant form of inhibition in BLA. A, Schematic of experimental design where BLA IN populations are selectively inhibited by halorhodopsin in brain slice preparations. Scale bar, 100 µm. B, Sample waveforms from BLA PYRs showing sIPSCs before and during light inhibition of CCK (n = 9; N = 4), PV (n = 9; N = 3), and SOM INs (n = 10; N = 4). Total reduction of IPSC charge and IPSC frequency during light is highest during SOM IN inhibition (one-way ANOVA; IPSC charge, p = 0.022; IPSC frequency, p = 0.002). C, Sample waveforms from BLA PYRs after ACh show different effects of light inhibition of CCK, PV, and SOM INs compared with baseline. Total reduction of IPSC charge and IPSC frequency during light is now highest during CCK IN inhibition (one-way ANOVA; IPSC charge, p = 7.6 × 10−6; IPSC frequency, p = 0.018). D, Schematic showing the representative shift in BLA inhibition by ACh. E, Comparing the frequency of large (>5× baseline average) and small (1–3× baseline average) IPSCs after ACh shows IN specific involvement.
Figure 5.
Figure 5.
Cannabinoid receptor 1 (CB1R)-expressing CCK INs underlie ACh-induced large IPSCs in BLA PYRs. A, In CCK-Cre and PV-Cre mice AAV5-EF1a-DIO-hChR2(H134R)-eYFP was injected into the BLA to allow for selective activation of CCK and PV INs in brain slice preparations. Application of WIN 55,212-2 (2 µM) reduced the amplitude of CCK-evoked IPSCs (WIN, 0.35 ± 0.04 of control IPSC amplitude; n = 4; N = 3; paired t test; p = 0.003; t(2) = 17.61) but not PV IPSCs (WIN, 1.17 ± 0.21 of control IPSC amplitude; n = 3; N = 3; paired t test; p = 0.48; t(2) = −0.85). B, Sample recording from BLA PYR showing large IPSCs in response to ACh stimulation in control conditions that are abolished by application of WIN in the bath. Measurements of large IPSC frequency show that these events are blocked by WIN (large IPSC frequency after ACh: CTRL, 7.56 ± 0.99 Hz; +WIN, 0.59 ± 0.25 Hz; n = 11; N = 5; p = 6.05 × 10−5; t(10) = 6.60). C, Additionally, depolarization-induced suppression of inhibition (DSI) in a PYR recording (holding at 0 mV for 2 s) could also block large IPSCs after ACh stimulation that could be reversed by AM251 (1 µM; n = 5; N = 4), indicating an involvement of CB1Rs. Measuring large IPSC frequency in control conditions and after DSI shows this significant reduction (large IPSC frequency after ACh: CTRL, 6.82 ± 0.81 Hz; after DSI, 0.58 ± 0.20 Hz; 23 cells; 11 animals; paired t test; p = 1.11 × 10−7; t(22) = 7.70).
Figure 6.
Figure 6.
SOM INs block CCK IN-induced theta frequency inhibition after ACh. A, Sample waveforms showing rebound firing in unit recording of SOM IN expressing eNpHR and rebound IPSCs in PYR. Scale bar, 20 µm. B, Rebound firing of SOM INs after light inhibition produces a barrage of IPSCs in BLA PYRs that block large IPSCs after ACh (n = 10; N = 3; paired t test; p = 0.004). C, Expression of ChR2 in SOM INs allows for optical activation of SOM INs with a single light pulse (top) or a barrage of SOM IN IPSCs during a 1 s light stimulus (bottom). D, Sample waveform showing activation of SOM INs disrupts CCK-mediated IPSCs in BLA PYR induced by ACh. E, Large IPSC frequency is decreased during activation of SOM INs (n = 6; N = 3; paired t test; p = 0.003). F, Circuit schematic showing SOM innervation of CCK INs that can gate ACh-induced theta inhibition.
Figure 7.
Figure 7.
ACh differentially impacts CCK, PV, and SOM INs in the BLA. A, Targeted recordings from CCK, PV, and SOM INs, showing different firing patterns to current injection and spontaneous EPSCs (traces) were obtained using different transgenic strategies (top, confocal images showing LA/BLA complex, dotted white lines). Scale bar, 100 µm. B, Recordings from tagged neurons in these preparations show that these populations of INs can be distinguished based on electrophysiological parameters. C, Local puff application of ACh onto CCK, PV, and SOM INs reveals differential mAChR responses to ACh in these populations. D, Breakdown of mAChR response in each IN population. E, CCK INs are more likely to fire action potentials from rest in response to ACh. F, Sample waveform showing firing in a CCK IN in response to repeated puff application of ACh in control conditions (pink) or after application of 4DAMP (1 µM). Graph (top right) showing the firing frequency in each trial (light pink) and average (dark pink) for the sample cell and the average firing frequency in all cells in control and 4DAMP (bottom right; paired t test; p = 9.7 × 10−4; n = 4; N = 3). G, Sample waveform showing that underlying depolarization in CCK INs is blocked by 4DAMP (paired t test; p = 0.016; n = 4; N = 3).
Figure 8.
Figure 8.
BLA PV INs align with large network activity in baseline but not during ACh states. A, Example paired recording of a synaptically connected PV IN and PYR in the BLA (left) in baseline and after puff application of ACh (right). B, In same PV→PYR pair, sample trace of baseline network activity in the absence of ACh showing PV firing and large IPSCs in BLA PYR. Cross-correlation of these baseline network events shows high degree of cross-correlation (n = 5 pairs; N = 4). C, Zoomed in traces showing PV firing in relation to PYR network event (green dots represent action potentials across multiple trials from the same PV IN) show these events are tightly aligned to PYR activity in baseline conditions (bottom, total of 100 PV spikes from 5 PV→PYR pairs, 4 animals). D, In the same PV→PYR pair, traces show action potential firing in PV INs does not align with PYR IPSCs in the presence of ACh. Cross-correlation of PV and PYR membrane potentials after ACh show low cross-correlation (13 pairs; N = 6). E, Time-locked overlay of five individual large IPSCs after ACh in the PYR (bottom) and action potentials in PV IN (top, dots underneath trace represent PV action potentials across 11 IPSCs) highlights that these events do not align (bottom, probability of PV action potential in relation to the start of large IPSC in PYR: total of 107 PV spikes from 13 PV→PYR pairs, 6 animals). F, When ChR2 is expressed in PV INs in BLA slices, light stimulation at 7 Hz results in robust oscillations of the LFP (traces from example slice and corresponding power spectrum, right). Comparing total theta power (3–12 Hz) of LFP in baseline and during light stimulation of PV INs shows induction of theta oscillations by PV INs (total theta power (10−5 mV2/Hz): baseline, 0.28 ± 0.10; light, 5.78 ± 1.40; n = 5, N = 3; paired t test; p = 0.016; t(4) = −4.01).
Figure 9.
Figure 9.
ACh produces theta frequency oscillations in BLA PYRs. A, An example image of a recorded PYR showing characteristic spiny dendrites (top) and biphasic postsynaptic response to released ACh. Magnification of the membrane potential shows large rhythmic activity after light that is blocked by bicuculline (20 µM). Scale bar, 25 µm. B, Average power spectrums of PYR membrane potential before and after light show large increase in theta power (3–12 Hz) after light (paired t test; p = 2.28 × 10−5; n = 38; N = 13). C, This increase in theta power is blocked by bicuculline (n = 8; N = 5; one-way repeated-measures ANOVA; p = 5.24 × 10−4). D, Application of the CB1 receptor agonist WIN 55,212-2 (2 µM) also blocks theta oscillation in BLA PYRs induced by ACh (n = 9; N = 3; one-way repeated-measures ANOVA; p = 0.032). E, Plotting the average BLA PYR membrane potential after ACh stimulation shows a temporal overlap with theta frequency IPSPs in these cells. F, Unit recordings from BLA PYRs show that in response to cholinergic stimulation, they can fire at a theta frequency, which is blocked by atropine (5 µM; average unit frequency after light, 4.66 ± 0.98 Hz; n = 11, N = 7; peak frequency after light + atropine, 0.21 ± 0.14 Hz; n = 4, N = 3; two-sample t test; p = 0.022.)
Figure 10.
Figure 10.
ACh synchronizes BLA PYRs. A, Confocal image showing an example of a dual neighboring PYR recording in the BLA. Scale bar, 50 µm. B, Representative paired recordings of PYRs showing the high cross-correlation of membrane potentials during ACh-induced MPOs that occurs in most, but not all pairs (right; paired t test; p = 6.25 × 10−5; n = 23; N = 12). C, In voltage-clamp recordings, synchronization of ACh-induced large IPSCs can be observed in most cells, providing a mechanism for synchronized MPOs. D, E, Sample recordings showing that when neighboring PYRs are brought to firing threshold, ACh induces an inhibition of firing activity that is followed by an increase in the synchronization of PYR action potentials. F, Synchronization of spiking induced by ACh (n = 10 pairs; N = 8) is blocked in the presence of picrotoxin (n = 3 pairs; N = 3) to block GABAA receptors (two-sample t test; p = 0.01), shown in (G) traces from the same cell pair.
Figure 11.
Figure 11.
Summary schematic of the effects of ACh on BLA circuits. A, During periods of low firing of BF cholinergic neurons, SOM INs contribute the largest amount of inhibition in the BLA while BLA PYRs sparsely fire and the LFP exhibits low synchronous activity. After a burst of activity in cholinergic neurons releases ACh into the BLA, there is a cell type-specific shift in the BLA microcircuits that can extend for seconds beyond the cholinergic stimulus. In this circuit state, CCK INs show a robust increase in activity and produce large theta frequency inhibition onto BLA PYRs, synchronizing BLA firing and producing a theta frequency oscillation in the LFP. Importantly, SOM INs are inhibited during this time, which gates the ability of CCK INs to drive the theta oscillation.

References

    1. Aitta-aho T, Hay YA, Phillips BU, Saksida LM, Bussey TJ, Paulsen O, Apergis-Schoute J (2018) Basal forebrain and brainstem cholinergic neurons differentially impact amygdala circuits and learning-related behavior. Curr Biol 28:2557–2569.e4. 10.1016/j.cub.2018.06.064 - DOI - PubMed
    1. Andrási T, Veres JM, Rovira-Esteban L, Kozma R, Vikór A, Gregori E, Hájos N (2017) Differential excitatory control of 2 parallel basket cell networks in amygdala microcircuits. PLoS Biol 15:e2001421. 10.1371/journal.pbio.2001421 - DOI - PMC - PubMed
    1. Antonoudiou P, et al. (2022) Allopregnanolone mediates affective switching through modulation of oscillatory states in the basolateral amygdala. Biol Psychiatry 91:283–293. 10.1016/j.biopsych.2021.07.017 - DOI - PMC - PubMed
    1. Armstrong C, Soltesz I (2012) Basket cell dichotomy in microcircuit function. J Physiol 590:683–694. 10.1113/jphysiol.2011.223669 - DOI - PMC - PubMed
    1. Bienvenu TCM, Busti D, Magill PJ, Ferraguti F, Capogna M (2012) Cell-type-specific recruitment of amygdala interneurons to hippocampal theta rhythm and noxious stimuli in vivo. Neuron 74:1059–1074. 10.1016/j.neuron.2012.04.022 - DOI - PMC - PubMed

Publication types

MeSH terms

LinkOut - more resources