. 2024 Mar 4;15(1):1966.
doi: 10.1038/s41467-024-45907-7.

A spatially-resolved transcriptional atlas of the murine dorsal pons at single-cell resolution

Affiliations

A spatially-resolved transcriptional atlas of the murine dorsal pons at single-cell resolution

Stefano Nardone et al. Nat Commun. .

Abstract

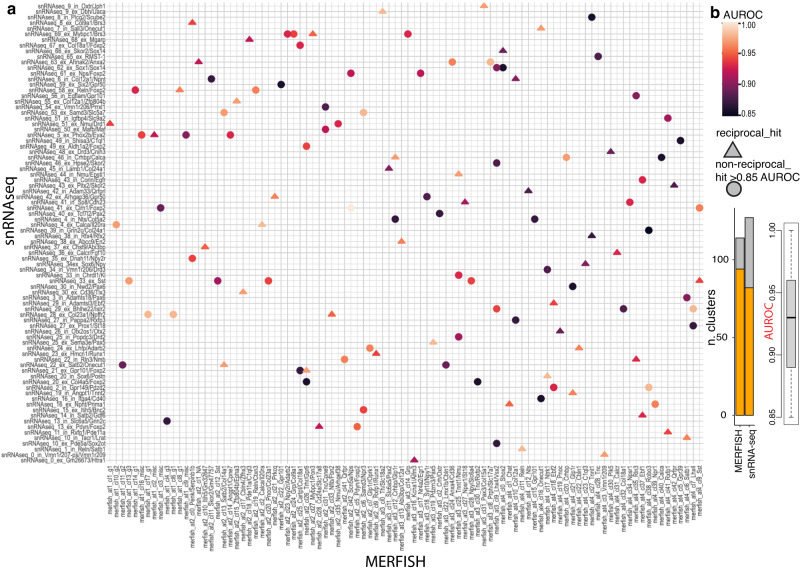
The "dorsal pons", or "dorsal pontine tegmentum" (dPnTg), is part of the brainstem. It is a complex, densely packed region whose nuclei are involved in regulating many vital functions. Notable among them are the parabrachial nucleus, the Kölliker Fuse, the Barrington nucleus, the locus coeruleus, and the dorsal, laterodorsal, and ventral tegmental nuclei. In this study, we applied single-nucleus RNA-seq (snRNA-seq) to resolve neuronal subtypes based on their unique transcriptional profiles and then used multiplexed error robust fluorescence in situ hybridization (MERFISH) to map them spatially. We sampled ~1 million cells across the dPnTg and defined the spatial distribution of over 120 neuronal subtypes. Our analysis identified an unpredicted high transcriptional diversity in this region and pinpointed the unique marker genes of many neuronal subtypes. We also demonstrated that many neuronal subtypes are transcriptionally similar between humans and mice, enhancing this study's translational value. Finally, we developed a freely accessible, GPU and CPU-powered dashboard ( http://harvard.heavy.ai:6273/ ) that combines interactive visual analytics and hardware-accelerated SQL into a data science framework to allow the scientific community to query and gain insights into the data.


Conflict of interest statement

Cory Brannigan is a software architect at HEAVY.AI. The remaining authors declare no competing interests.

Figures

Fig. 1
Fig. 1. snRNA-seq transcriptional profile of the dPnTg.
a Experimental workflow summarized in five main steps: brain dissections, nuclei isolation, snRNA-seq, sequencing, and bioinformatic analyses. b Image illustrating the two dissection strategies relying on the visualization of PB (top) and Bar (bottom). (scale bar: 500 μm). c t-SNE plot of 222,592 nuclei color-coded according to the legend in (d). d Donut plot representing the fraction (%) of each cell type identified. e Dot plot of 35 cell marker genes that univocally identify each cell type. 3 marker genes were plotted for all cell types except for CPE cells, where only the top 2 were used. f, g t-SNE plots showing 47,756 nuclei from the “excitatory” group (f) and 30,771 nuclei from the “inhibitory” group (g) color-coded by cell cluster. The top marker genes that specify the identity of each “excitatory” or “inhibitory” cluster are in (h) and (i), respectively. h, i Dot plots illustrating the expression level of the top marker gene for the “excitatory” (h) and “inhibitory” (i) neuronal groups. All differentially expressed genes in the dot plot have an average log fold-change >0.25 and an adjusted p-value <0.01. Test used: Wilcoxon Rank Sum two-sided Bonferroni-corrected Test. lPBN/mPBN parabrachial nucleus lateral/medial divisions; Bar, Barrington’s nucleus; scp, superior cerebellar peduncle; t-SNE, t-distributed Stochastic Neighbor Embedding; OPC, oligodendrocyte progenitor cell; PVM, perivascular macrophages; VSMC, vascular smooth muscle cells; CPE cells, choroid plexus epithelial cells; VLMC1/2, vascular and leptomeningeal cell type 1/2; Diff.OPC, immature oligodendrocytes; NA, no marker detected; CONT, glia contamination. Figure 1a was generated using BioRender.
Fig. 2
Fig. 2. MERFISH transcriptional profile of the dPnTg.
a Experimental workflow summarized in five main steps: brain dissection, MERFISH assay, signal deconvolution, bioinformatic analyses, and data visualization. In total, 7 animals were used, of which 4 represent a complete series of 10 serial coronal sections. b t-SNE plot of 685,289 cells color-coded according to the legend in (c). c Donut plot depicting the fraction (%) of each cell type identified. d Dot plot of 17 cell markers (y-axis) that univocally identify each cell type (x-axis). For each cell type, 2 markers were plotted, except for VLMC types I and II, where 1 marker was used. e, f t-SNE of 231,103 cells from the “excitatory” group (e) and 110,332 cells from the “inhibitory” group (f) color-coded by cell cluster. The top 2 marker genes specify the identity of each cluster as per (g) and (h), respectively. g, h Dot plot of the expression level of the top marker gene for the “excitatory” (g) and “inhibitory” (h) neuronal clusters. All differentially expressed genes in the dot plot have an average log fold-change >0.25 and an adjusted p-value < 0.01. Test used: Wilcoxon Rank Sum two-sided Bonferroni-corrected Test. t-SNE, t-distributed Stochastic Neighbor Embedding; OPC, oligodendrocyte progenitor cell; PVM, perivascular macrophages; VSMC, vascular smooth muscle cells; CPE cells, choroid plexus epithelial cells; VLMC1/2, vascular and leptomeningeal cell type 1/2; Diff.OPC, immature oligodendrocytes; NA, no marker detected; CONT, glia contamination.
Fig. 3
Fig. 3. Spatially resolved neuronal atlas of the KF.
a Overlay of Franklin-Paxinos atlas anatomic boundaries on MERFISH image depicting Slc32a1, Chat, Tfap2b, and Calca transcripts. (scale bar: 200 μm). b Voronoi plots depicting KF cells across 3 bregma levels. Glia/non-neuronal cells are in gray. c t-SNE plot of 4554 neurons from the KF. d Donut plot showing the fraction (%) of each neuronal cluster of the KF. e Stacked area chart showing each cluster’s cell frequency (cluster trajectory) across 3 bregma levels. f Dot plot showing the top 3 markers for each cluster. Red boxes indicate the 5 groups. Bold characters indicate KF clusters; other clusters are from neighboring regions. Clusters displayed by the Voronoi, t-SNE, donut plot, and stacked area chart are color-coded according to the legend in (f). g Heatmap depicting the Pearson’s r correlation coefficient of the average expression of 315 genes for all possible combinations of the PB cluster at2_2, KF clusters at1_6, at1_10, and at1_11. h Dot Plot of marker genes specific for PB cluster at2_2, all PB clusters except at2_2, KF clusters at1_6, at1_10, and at1_11. i MERFISH images depicting Calca, Prph, Col11a1, Pou6f2, and Chst9 transcripts in the KF at bregma levels −4.8 and −4.9. Green, red, and orange arrows represent high Calca (Calca+++/Pou6f2, KF cluster at1_10), medium Calca (Calca++/Chst9, KF cluster at1_11), and low Calca (Calca+/Col11a1, KF cluster at1_6) neuronal clusters, respectively. (scale bar: 50 μm). j Donut plot depicting the fraction of Calca+ neuronal clusters (clusters at1_6, at1_10, and at1_11) at bregma level −4.8 and −4.9 of the KF. The cluster percentage in plots refers to the images in (i). All differentially expressed genes in the dot plot have an average log fold-change >0.25 and an adjusted p-value <0.01. Test used: Wilcoxon Rank Sum two-sided Bonferroni-corrected Test. Source Data are provided as Source Data file.
Fig. 4
Fig. 4. Spatially resolved neuronal atlas of the PB.
a Voronoi plots depicting PB cells across 9 sequential MERFISH sections from −4.95 to −5.7 bregma level. Glia/non-neuronal cells are in gray. b t-SNE plot of 79,413 neurons. c Stacked area charts showing each cluster’s cell frequency (cluster trajectory) across all 9 bregma levels. Clusters displayed by the Voronoi, t-SNE, and stacked area chart are color-coded according to the legend in (b). Clusters underlined in the legend represent external-to-the-PB neuron types/glia contamination. d Dot plot of the top 2 markers for each cluster. e Voronoi plots representing neurons from PB cluster at2_2 across 10 sequential coronal sections from bregma level −4.95 to −5.7. Other PB neuronal clusters and glia/non-neuronal cells are in gray. f t-SNE plot representing 4504 neurons. g Dot plot depicting the Calca gene and the top marker for each Calca+ subcluster. h Stacked area chart showing the cluster trajectory across the 10 sequential MERFISH sections in (e). Clusters displayed by the Voronoi, t-SNE, and stacked area chart are color-coded according to the legend in (f). i Left: MERFISH image of Slc32a1, Calca, and Slc6a2 transcripts in the PB complex at bregma level −5.15. (scale bar: 200 μm). Right: enlarged view of the Calca+ cluster 4. (scale bar: 100 μm). j Left: MERFISH image of Slc32a1, Calca, and Qrfpr transcripts in the PB complex at bregma level −4.95. (scale bar: 200 μm). Right: enlarged view of the Calca+ cluster 8. (scale bar: 50 μm). In (g, h), only clusters composed of >100 cells were included. All differentially expressed genes in the dot plot have an average log fold-change >0.25 and an adjusted p-value <0.01. Test used: Wilcoxon Rank Sum two-sided Bonferroni-corrected Test; NA, no marker detected.
Fig. 5
Fig. 5. Spatially resolved neuronal atlas of the MTN, pre-LC, LC, and Bar.
a Voronoi plots depicting cells of a ROI that includes MTN, pre-LC, LC, and Bar across 9 sequential sections, from −5.2 to −5.8 bregma level. Glia/non-neuronal cells are in gray. b t-SNE plot of 22,358 neurons. c Stacked area chart showing each cluster’s cell frequency (cluster trajectory) across all 9 MERFISH sections. Clusters displayed by the Voronoi, t-SNE, and stacked area chart are color-coded according to the legend in (b). Clusters underlined in the legend represent external-to-the-ROI neuron types/glia contamination. d Dot plot of the top 2 markers for each cluster. e Left: MERFISH image showing the spatial distribution of Prph, Th, and Brs3 at bregma levels −5.5 and −5.6. (scale bar: 75 μm). Right: violin plots depicting the average expression level (y-axis) of 9 genes in clusters at3_8 and at3_24 (x-axis). f Left: MERFISH image showing the spatial distribution for Th, Pdyn, and Tnc in bregma levels −5.6 and −5.3 in the pre-LC (top) and LPBD (bottom). (scale bar: 50 μm). Right: violin plots depicting the expression level (y-axis) of 8 genes in clusters at3_30 (pre-LC) and at2_5 (LPBD) (x-axis). g Voronoi plots depicting LC noradrenergic neurons across 9 sequential MERFISH sections from −5.2 to −5.8 bregma level. Other ROI’s neuronal clusters and glia/non-neuronal cells are in gray. h t-SNE plot of 4,074 noradrenergic neurons. i Stacked area chart showing each cluster’s cell frequency (cluster trajectory) across 9 sequential MERFISH sections in (g). Clusters displayed by the Voronoi, t-SNE, and stacked area chart are color-coded according to the legend in (h). j Dot plot depicting Th, Ddc, Dbh, Slc18a2, Slc6a2, Hcrtr1, and Hcrtr2 genes and the top 2 marker genes for each subcluster. In (i, j), only clusters composed of >200 cells were included. All differentially expressed genes in the dot plot have an average log fold-change >0.25 and an adjusted p-value <0.01. Test used: Wilcoxon Rank Sum two-sided Bonferroni-corrected Test; NA, no marker detected.
Fig. 6
Fig. 6. Spatially resolved neuronal atlas of LDTg, DTg, VTg, Sph, NI, CGA, CGB, and CGPn.
a Voronoi plots depicting cells of a ROI that includes LDTg, DTg, VTg, Sph, NI, CGA, CGB, and CGPn across 11 sequential sections from −4.7 to −5.8 bregma level. Glia/non-neuronal cells are in gray. b t-SNE plot of 120,182 neurons. c Stacked area charts showing each cluster’s cell frequency (cluster trajectory) across all 11 MERFISH sections. Clusters displayed by the Voronoi, t-SNE, and stacked area chart are color-coded according to the legend in (b). Clusters underlined in the legend represent external-to-the-ROI neuron types/glia contamination. d Dot plot of the top marker for each cluster. All differentially expressed genes in the dot plot have an average log fold-change >0.25 and an adjusted p-value <0.01. Test used: Wilcoxon Rank Sum two-sided Bonferroni-corrected Test. NA, no marker detected.
Fig. 7
Fig. 7. In-depth characterization of the LDTg, VTg, DTg, and Sph.
a Overlay of Franklin-Paxinos atlas anatomic boundaries on MERFISH image depicting Slc32a1, Chat, and Tnc transcripts. (scale bar: 250 μm). b Donut plots: the inner plot shows the overall contribution (%) of each cluster to the total LDTg/LDTgV neurons; the outer plot classifies the clusters as glutamatergic (red), GABAergic (light blue) and cholinergic (yellow). c Stacked area charts of the LDTg/ LDTgV cluster trajectory. Clusters are color-coded according to the legend in (b). d Left: donut plot showing the LDTg cell partition in glutamatergic (red), GABAergic (blue), and cholinergic (yellow) in this study and as reported by Luquin et al. Right: estimation of Glp1r+/Slc32a1+ and Glp1r+/Slc17a6+ cells in mouse LDTg by this study and as reported by Hernandez et al. e Schematic from the Paxinos atlas showing the VTg anatomical location. f MERFISH image showing cluster at4_6 (VTg neurons; cyan polygons) along with Slc32a1, Slc17a6, and Tph2 transcripts. (scale bar: 100 μm). g Donut plots: the inner plot shows the overall contribution (%) of each cluster to the total DTg neurons; the outer plot classifies the clusters as glutamatergic (red) and GABAergic (light blue). h Schematic from the Franklin-Paxinos atlas showing the DTg, Sph, NI, CGA, and CGB anatomical location from −5.02 to −5.8 bregma level. For (e, h), abbreviations refer to Table 1. i Stacked area charts of the DTg cluster trajectory. Clusters are color-coded according to the legend in (g). j Overlay of Franklin-Paxinos atlas anatomic boundaries on MERFISH images depicting Slc32a1, Ebf2, and Rfxfp1 (top) and Ebf2 and Rfxp1 marker genes (bottom) in the Sph. (scale bar: 100 μm). k Overlay of Franklin-Paxinos atlas anatomic boundaries on MERFISH images depicting Slc32a1 and Slc17a6 (top) and 9 marker genes (bottom) in the DTg across the same rostrocaudal levels. (scale bar: 100 μm). Legend is on the right side of both panels. In (b, g), only clusters contributing >0.5 % to the overall neuronal population were plotted.
Fig. 8
Fig. 8. Cluster correspondence between mouse snRNA-seq and MERFISH data.
a Heatmap depicting the cluster correspondence between snRNA-seq (78,485 neuronal nuclei grouped in 127 clusters) and MERFISH atlases 1-4 (193,714 neuronal cells grouped in 114 clusters) datasets of the dPnTg. Legend defining the AUROC score and the “match type” (reciprocal vs non-reciprocal) is on the right side of (a). b Left: stacked bar plot showing the number of clusters with a match (orange) over the total clusters (gray) identified by MERFISH (atlases 1–4) and snRNA-seq approaches. Right: boxplot showing the AUROC scores distribution. The black middle line denotes the median value (50th percentile), while the gray box contains the 25th to 75th percentiles of the dataset. The black whiskers mark the 5th and 95th percentiles, and values beyond these upper and lower bounds, marked with black dots, are considered outliers. AUROC, area under the receiver operator characteristic curve; NA, no marker detected; CONT, glial contamination.

Update of

References

    1. Miller JR, et al. A subregion of the parabrachial nucleus partially mediates respiratory rate depression from intravenous remifentanil in young and adult rabbits. Anesthesiology. 2017;127:502–514. doi: 10.1097/ALN.0000000000001719. - DOI - PMC - PubMed
    1. Kaur S, Saper CB. Neural circuitry underlying waking up to hypercapnia. Front. Neurosci. 2019;13:401. doi: 10.3389/fnins.2019.00401. - DOI - PMC - PubMed
    1. Breton-Provencher V, Drummond GT, Sur M. Locus coeruleus norepinephrine in learned behavior: anatomical modularity and spatiotemporal integration in targets. Front. Neural Circuits. 2021;15:638007. doi: 10.3389/fncir.2021.638007. - DOI - PMC - PubMed
    1. Ryan PJ, Ma S, Olucha-Bordonau FE, Gundlach AL. Nucleus incertus—an emerging modulatory role in arousal, stress and memory. Neurosci. Biobehav. Rev. 2011;35:1326–1341. doi: 10.1016/j.neubiorev.2011.02.004. - DOI - PubMed
    1. Lu L, et al. Control of locomotor speed, arousal, and hippocampal theta rhythms by the nucleus incertus. Nat. Commun. 2020;11:262. doi: 10.1038/s41467-019-14116-y. - DOI - PMC - PubMed