. 2024 Mar 4;15(1):1972.
doi: 10.1038/s41467-024-46063-8.

QTL mapping of human retina DNA methylation identifies 87 gene-epigenome interactions in age-related macular degeneration

Affiliations

QTL mapping of human retina DNA methylation identifies 87 gene-epigenome interactions in age-related macular degeneration

Jayshree Advani et al. Nat Commun. .

Abstract

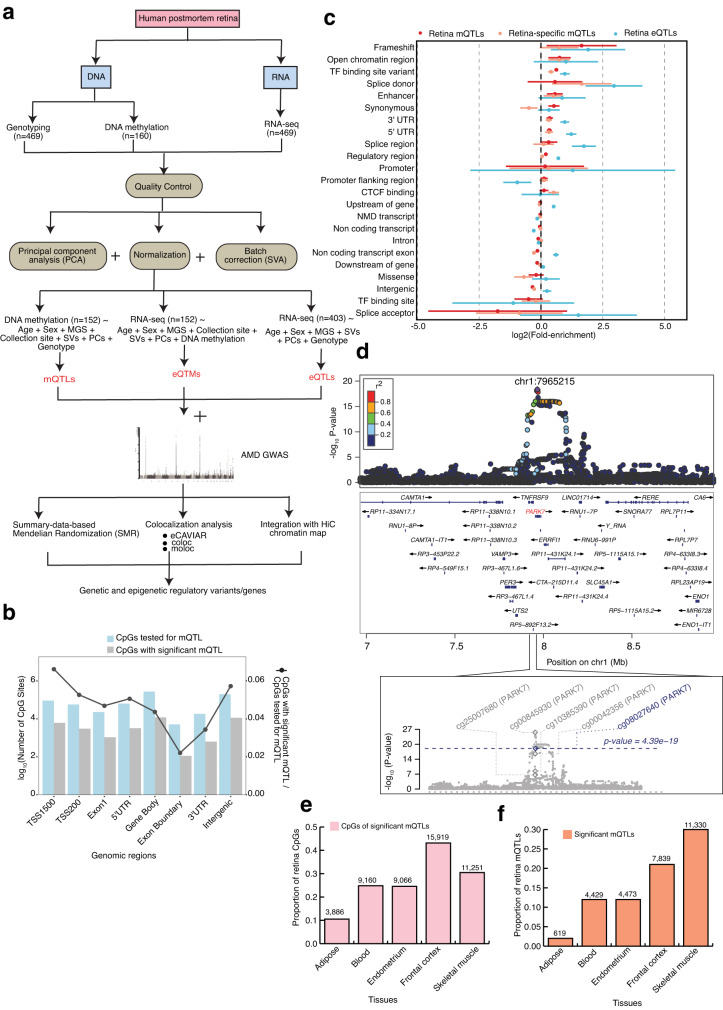
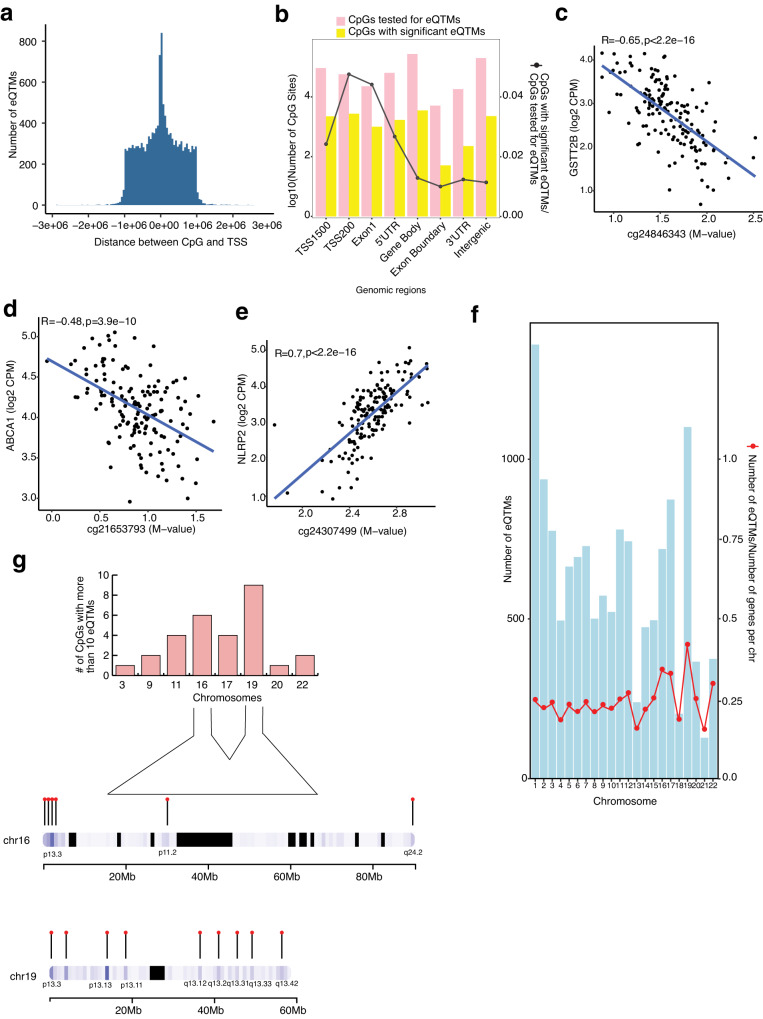
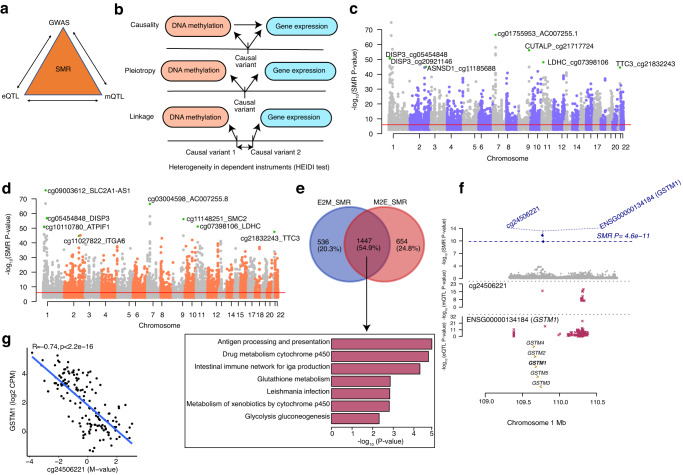
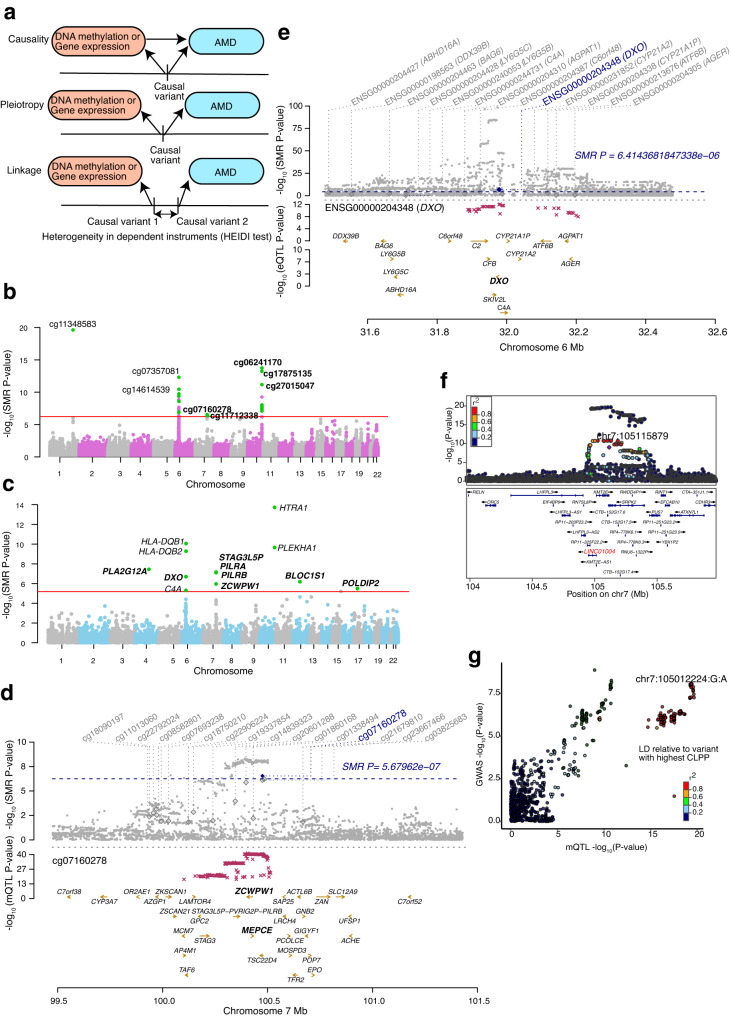
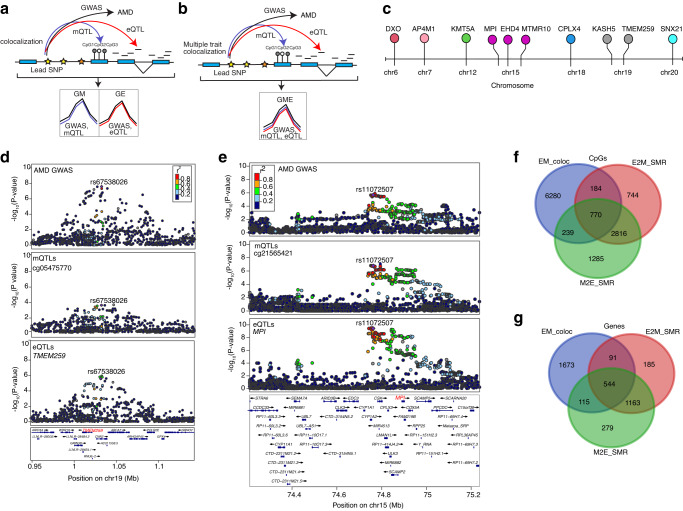
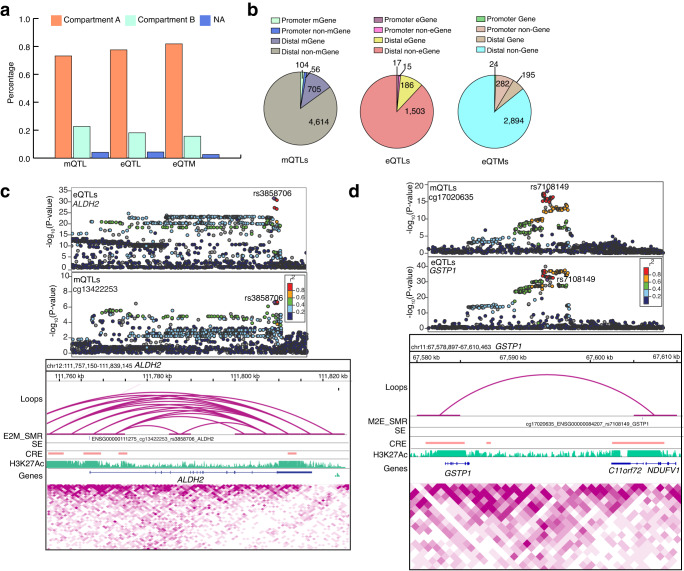
DNA methylation provides a crucial epigenetic mark linking genetic variations to environmental influence. We have analyzed array-based DNA methylation profiles of 160 human retinas with co-measured RNA-seq and >8 million genetic variants, uncovering sites of genetic regulation in cis (37,453 methylation quantitative trait loci and 12,505 expression quantitative trait loci) and 13,747 DNA methylation loci affecting gene expression, with over one-third specific to the retina. Methylation and expression quantitative trait loci show non-random distribution and enrichment of biological processes related to synapse, mitochondria, and catabolism. Summary data-based Mendelian randomization and colocalization analyses identify 87 target genes where methylation and gene-expression changes likely mediate the genotype effect on age-related macular degeneration. Integrated pathway analysis reveals epigenetic regulation of immune response and metabolism including the glutathione pathway and glycolysis. Our study thus defines key roles of genetic variations driving methylation changes, prioritizes epigenetic control of gene expression, and suggests frameworks for regulation of macular degeneration pathology by genotype-environment interaction in retina.


Conflict of interest statement

The authors declare no competing interests.

Figures

Fig. 1
Fig. 1. Graphic summary of datasets generated, integrated and analyses performed in the present study and robust identification of retina mQTLs.
a Schematic representation of our genetic, epigenetic, and transcriptomic datasets and methods used in the identification and integration of methylation quantitative trait loci (cis-mQTL), expression quantitative trait loci (cis-eQTL) and expression quantitative trait methylation (cis-eQTM) with AMD GWAS and retina Hi-C chromatin map. b Number of CpG sites tested (blue) and significant (grey) in various genomic regions in mQTL analysis. c QTL enrichment in functional annotations for all retina (red) or retina-specific (orange) cis-mQTLs identified from n = 152 biologically independent samples and all retina cis-eQTLs identified from n = 403 biologically independent samples (blue). Points (centre) refer to m/eQTL fold-enrichment estimates on log2 scale with 95% confidence intervals (lines), shown in descending order based on the retina mQTL fold-enrichment across annotations with >550 variants per QTL type. d LocusZoom plot showing the retina mQTL association, −log10(P value) for the top mQTL signal with CpG (cg08027640) with P value = 4.39 × 10−19 for PARK7 gene. The diamond indicates the top mVariant (chr1:7965215:C:T; rs7517357) for the independent cg08027640 mQTL signal. The color of the points is determined by their linkage disequilibrium (LD) with respect to the lead mVariant in purple. The bottom plot shows −log10(P values) of the variant association with five different CpGs in PARK7 gene region from mQTL results. The grey and blue diamond’s represent −log10(P values) of the lead mVariants for four CpGs and cg08027640, respectively. e Proportion of retina CpGs with significant mQTLs that are also significant mQTLs across different tissues. f Proportion of retina mQTLs that are also significant mQTLs across different tissues.
Fig. 2
Fig. 2. Characterization and distribution of retina eQTMs.
a Distribution of the distance between the CpG and the transcription start site (TSS) of the respective gene is plotted against the number of eQTMs. b Combination chart representing the number of CpG sites tested (pink) and significant (yellow) in various genomic regions in eQTM analysis. c, d, e DNAm levels are presented on the X-axis and the normalized gene expression levels are shown on the Y-axis. Pearson’s correlation coefficient (R) was calculated between methylation and gene expression. c eQTM for CpG cg24846343 located in gene body and GSTT2B on chromosome 22 with R = −0.65, p < 2.2 × 10−16. d eQTM for CpG cg21653793 located in 5’UTR and ABCA1 on chromosome 9 with R = −0.48, p = 3.9 × 10−10. e eQTM for CpG cg24307499 located in gene body and NLRP2 on chromosome 19 with R = 0.7, p < 2.2 × 10−16. f Distribution of number of eQTMs on different chromosomes and eQTM fraction (red points) relative to the total number of genes per chromosome. g Top panel: Number of CpGs that regulate more than 10 eQTMs and are distributed on various chromosomes. Bottom panel: Cluster of CpGs on chromosomes 16 and 19 on arm p and q.
Fig. 3
Fig. 3. Associations between retina DNA methylation and gene expression through genotypes.
a Schematic of bidirectional integrative analysis that integrates summary-level data from independent GWAS with data from retina mQTL and eQTL. b Heterogeneity in dependent instruments (HEIDI) model to distinguish pleiotropy from linkage for an observed association between DNAm and gene expression through genotypes. c Manhattan plot of SMR tests for association between gene expression and DNAm (E2M_SMR). Shown on the y axis are the −log10(P value) from SMR tests. The red horizontal lines represent the genome-wide significance level (SMR P value = 9.29 × 10−7). d Manhattan plot of SMR tests for association between DNAm and gene expression (M2E_SMR). Shown on the y axis is the −log10(P value) from SMR tests. The red horizontal lines represent the genome-wide significance level (SMR P value = 9.38 × 10−7). e Venn-diagram representing common and unique genes identified in E2M_SMR and M2E_SMR associations and bar graph representing the enriched pathways identified in the pathway analysis of common genes at FDR < 0.05. The y axis shows the −log10(Empirical P value) from GeneEnrichf Results of variants and SMR associations across DNAm and gene expression (M2E_SMR) in the GSTM1 locus on chromosome 1. The top plot shows −log10(SMR P values) of SNPs from the SMR analysis of DNAm and gene expression (M2E_SMR). The blue diamonds represent −log10(SMR P value) from SMR tests for associations of DNAm and GSTM1 expression with SMR P value = 4.6 × 10−11. The second plot shows −log10(P values) of the SNP association for DNAm probe cg24506221 from the mQTL data. The third plot shows −log10(P values) of the SNP associations for gene expression of GSTM1 from the eQTL data. g eQTM for CpG cg24506221 located in TSS200 region and GSTM1 on chromosome 1. DNAm levels of cg24506221 are presented on the X-axis and the normalized gene expression levels are shown on the Y-axis. Pearson’s correlation coefficient was calculated between methylation and gene expression with R = −0.74, p < 2.2 × 10−16.
Fig. 4
Fig. 4. Associations between retina DNA methylation, gene expression and AMD GWAS through genotypes.
a Heterogeneity in dependent instruments (HEIDI) model to distinguish pleiotropy from linkage for an observed association between AMD, DNAm and/or gene expression through genotypes. b Manhattan plot of SMR tests for association between retina mQTL and AMD GWAS. Shown on each y axis are the −log10(SMR P values) from SMR tests. The red horizontal lines represent the genome-wide significance level (SMR P values = 5.67 × 10−7). c Manhattan plot of SMR tests for association between retina eQTL and AMD GWAS. The red horizontal lines represent the genome-wide significance level (SMR P values = 5.4 × 106). d Results of variants and SMR associations across retina mQTL and AMD GWAS. The top plot shows −log10(SMR P values) of SNPs comparing mQTL and AMD GWAS. The blue diamonds represent −log10(SMR P value) from SMR tests for associations of mQTL and AMD GWAS with SMR P value = 5.67 × 10−7. The second plot shows −log10(SMR P value) of the SNP associations for DNAm probe cg07160278 from the mQTL data. e Results of variants and SMR associations across retina eQTL and AMD GWAS. The top plot shows −log10(SMR P value) of SNPs from eQTL and AMD GWAS. The blue diamonds represent −log10(SMR P value) from SMR tests for associations of eQTL and AMD GWAS with SMR P value = 6.41 × 10−6. The second plot shows −log10(SMR P value) of the SNP associations for DXO gene from the eQTL data. f LocusZoom plot of the retina mQTL associations for cg11712338 (LINC01004). −log10(P value) of retina mQTL with points color coded based on LD (r2) relative to the lead AMD GWAS variant (chr7:105115879:C:T; rs1142) in the locus KMT2E/SRPK2. g LocusCompare plot comparing −log10(P value) of AMD GWAS to −log10(P value) of retina mQTLs acting on cg11712338 (LINC01004).
Fig. 5
Fig. 5. Colocalization analysis among AMD GWAS and retina mQTL and eQTL using Coloc and Moloc.
a Schematic representation of colocalization analysis of AMD GWAS with retina mQTL or eQTL. b Schematic representation of multiple trait colocalization analysis of AMD GWAS, retina mQTL and eQTL. c Lolliplot depicting the target genes identified in the multiple trait colocalization analysis (moloc) of AMD GWAS, retina mQTL and eQTL. The colors correspond to genes on different chromosomes. d LocusZoom plots of AMD GWAS (genotype and GWAS association), CpG cg05475770 mQTLs (genotype and cg05475770 methylation association), and TMEM259 eQTLs (genotype and TMEM259 expression association). The y axis shows −log10(P-value) of association tests from GWAS, mQTLs and eQTLs. Points are color coded based on LD (r2) relative to the variant with highest colocalization posterior probability in the locus, rs67538026, identified in moloc analysis of AMD GWAS, mQTLs and eQTLs (GEM). e LocusZoom plots of AMD GWAS (genotype and GWAS association), CpG cg21565421 mQTLs (genotype and cg21565421 methylation association), and MPI eQTLs (genotype and MPI expression association). The y axis shows −log10(P value) of association tests from GWAS, mQTLs and eQTLs. Points are color coded based on LD (r2) relative to the variant with highest colocalization posterior probability in the locus, rs11072507, identified in moloc analysis of AMD GWAS, mQTLs and eQTLs (GEM). f Venn-diagram representing common and unique CpGs identified in associations between retina eQTLs and mQTLs using moloc (EM_coloc), CpGs identified in associations between retina eQTLs and mQTLs using SMR (E2M_SMR), and CpGs identified in associations between retina mQTLs and eQTLs using SMR (M2E_SMR). g Venn-diagram representing common and unique target genes identified in associations between retina eQTLs and mQTLs using coloc (EM_coloc), genes identified in associations between retina eQTLs and mQTLs using SMR (E2M_SMR), and genes identified in associations between retina mQTLs and eQTLs using SMR (M2E_SMR).
Fig. 6
Fig. 6. Hi-C retina data enables target gene and variant prioritization.
a Proportion of unique retina mQTLs, eQTLs and eQTMs overlapping each chromatin compartment. b Number of unique retina mQTLs, eQTLs and eQTMs overlapping with a loop that are in contact with variants located within ±2.5 kb of the mGene/eGene/Gene TSS were identified as promoter mQTLs/eQTLs/eQTMs, while those located >2.5 kb from the mGene/eGene/Gene were identified as distal mQTLs/eQTLs/eQTMs. c Upper panel: LocusZoom plots of ALDH2 eQTLs (genotype and ALDH2 expression associations) and CpG cg13422253 mQTLs (genotype and cg13422253 methylation associations). The y axis shows −log10(P value) of eQTL and mQTL association tests. Points are color coded based on LD (r2) relative to the highlighted variant rs3858706, the most significant variant in E2M_SMR analysis of eQTLs and mQTLs. The lower panel includes associations identified in E2M_SMR for ALDH2 gene. Tracks represent the retina chromatin loops, E2M_SMR significant variant, SEs, CREs, H3K27Ac coverage, genes, and Hi-C physical contact maps identifying TADs. d Upper panel: LocusZoom plots of CpG cg17020635 mQTLs (genotype and cg17020635 methylation associations) and GSTP1 eQTLs (genotype and GSTP1 expression associations). The y axis shows −log10(P value) of association tests from mQTLs and eQTLs. Points are color coded based on LD (r2) relative to the highlighted variant rs7108149, the most significant variant in M2E_SMR analysis of eQTLs and mQTLs. The lower panel includes associations identified in M2E_SMR for GSTP1 gene. Tracks represent the retina chromatin loops, M2E_SMR variant, SEs, CREs, H3K27Ac coverage, genes, and Hi-C physical contact maps. CRE Cis-regulatory element, SE Super-enhancer, TAD Topologically associating domain.

Update of

References

    1. Manolio, T. A. et al. Finding the missing heritability of complex diseases. Nature461, 747–753 (2009). - PMC - PubMed
    1. Gamazon, E. R. et al. Using an atlas of gene regulation across 44 human tissues to inform complex disease- and trait-associated variation. Nat. Genet.50, 956–967 (2018). - PMC - PubMed
    1. Finucane, H. K. et al. Partitioning heritability by functional annotation using genome-wide association summary statistics. Nat. Genet.47, 1228–1235 (2015). - PMC - PubMed
    1. Frydas, A., Wauters, E., van der Zee, J. & Van Broeckhoven, C. Uncovering the impact of noncoding variants in neurodegenerative brain diseases. Trends Genet.38, 258–272 (2022). - PubMed
    1. Consortium, G. The GTEx Consortium atlas of genetic regulatory effects across human tissues. Science369, 1318–1330 (2020). - PMC - PubMed