. 2024 Mar 4;15(1):1965.
doi: 10.1038/s41467-024-46366-w.

NDUFS4 regulates cristae remodeling in diabetic kidney disease

Affiliations

NDUFS4 regulates cristae remodeling in diabetic kidney disease

Koki Mise et al. Nat Commun. .

Erratum in

Abstract

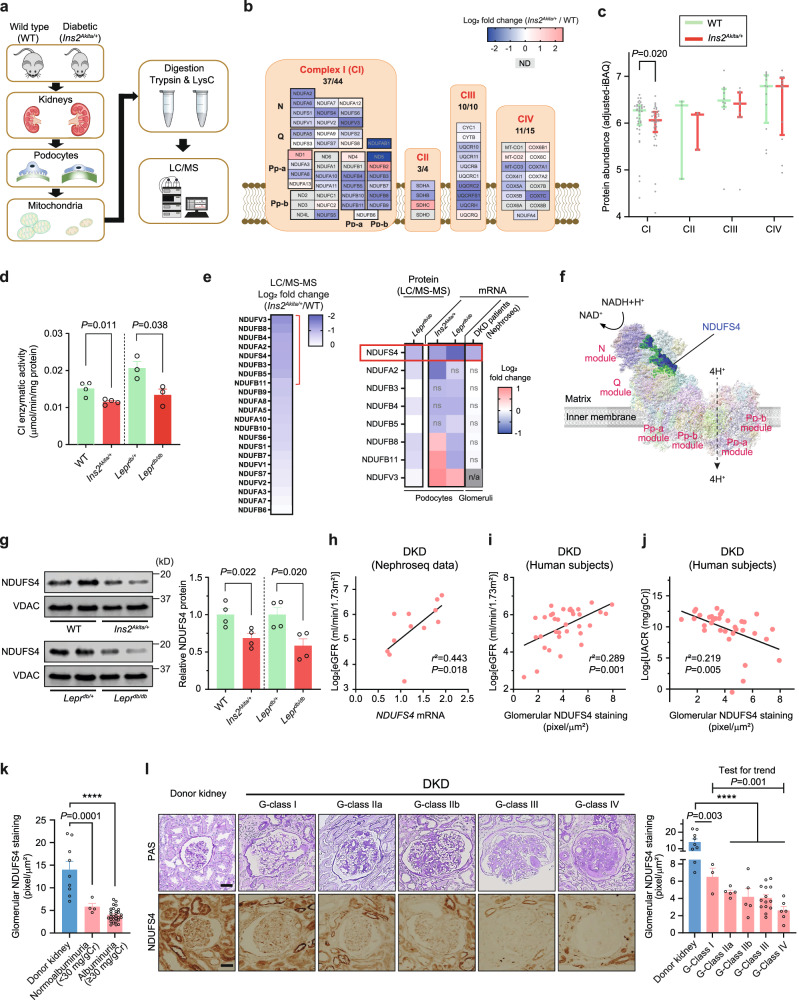
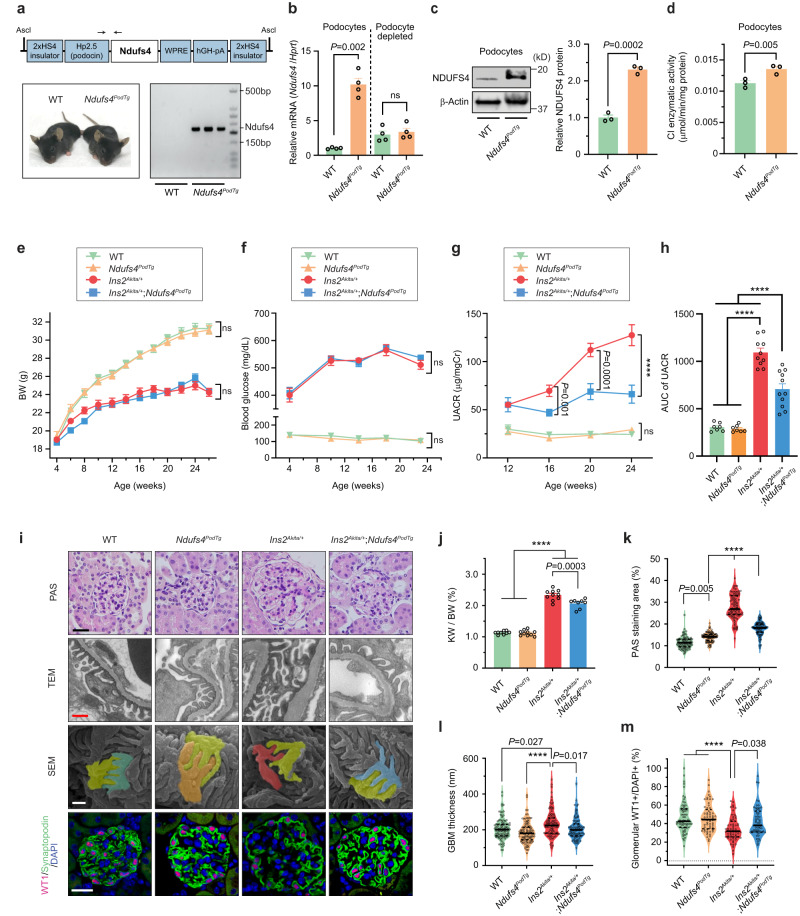
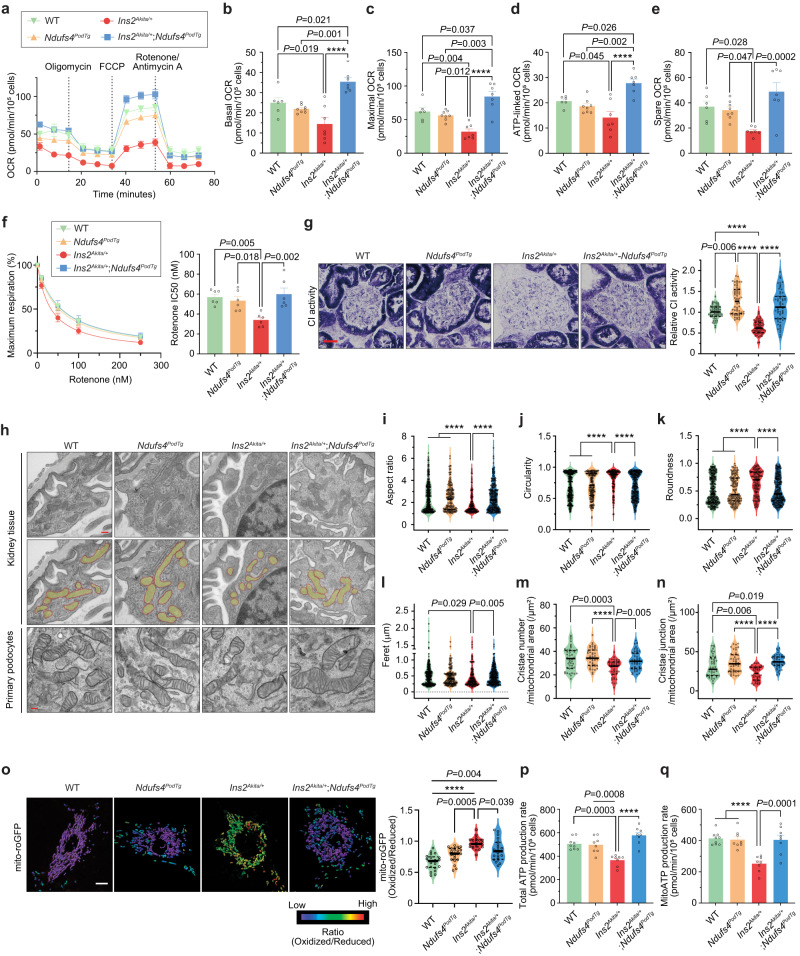
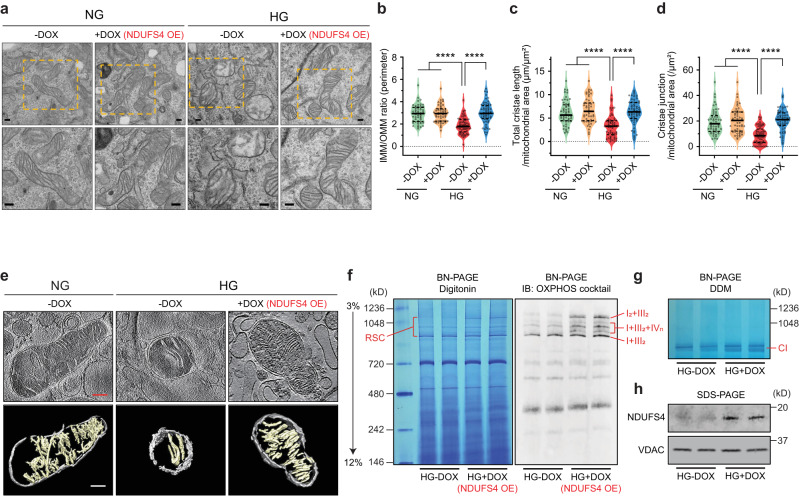
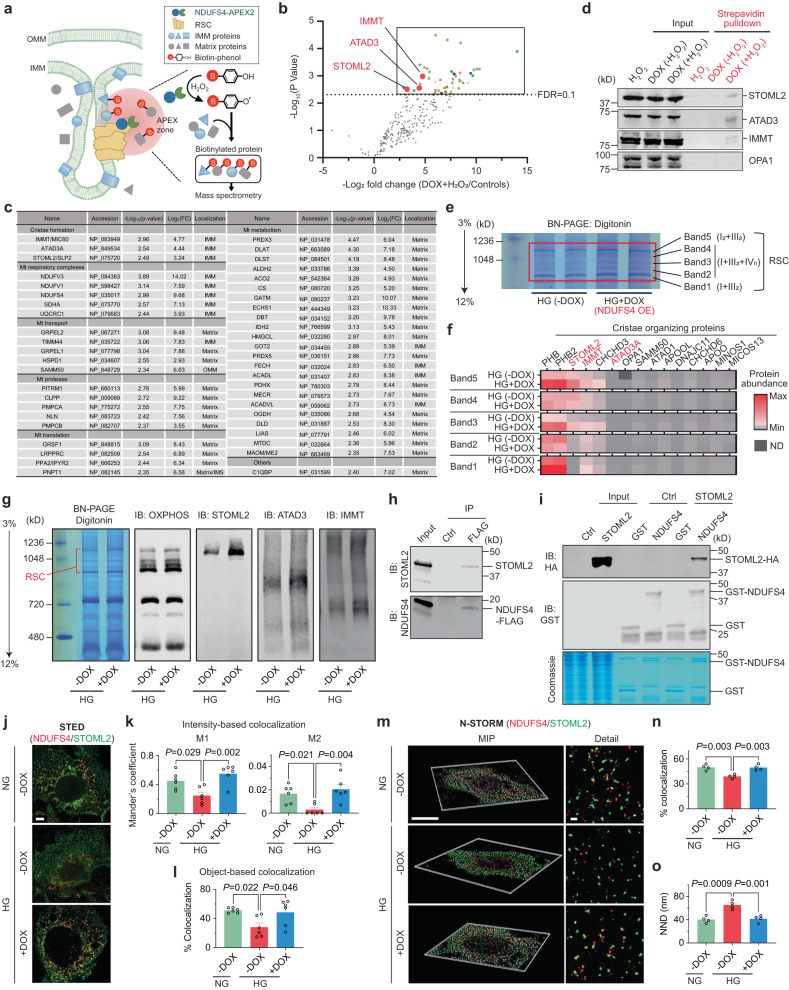
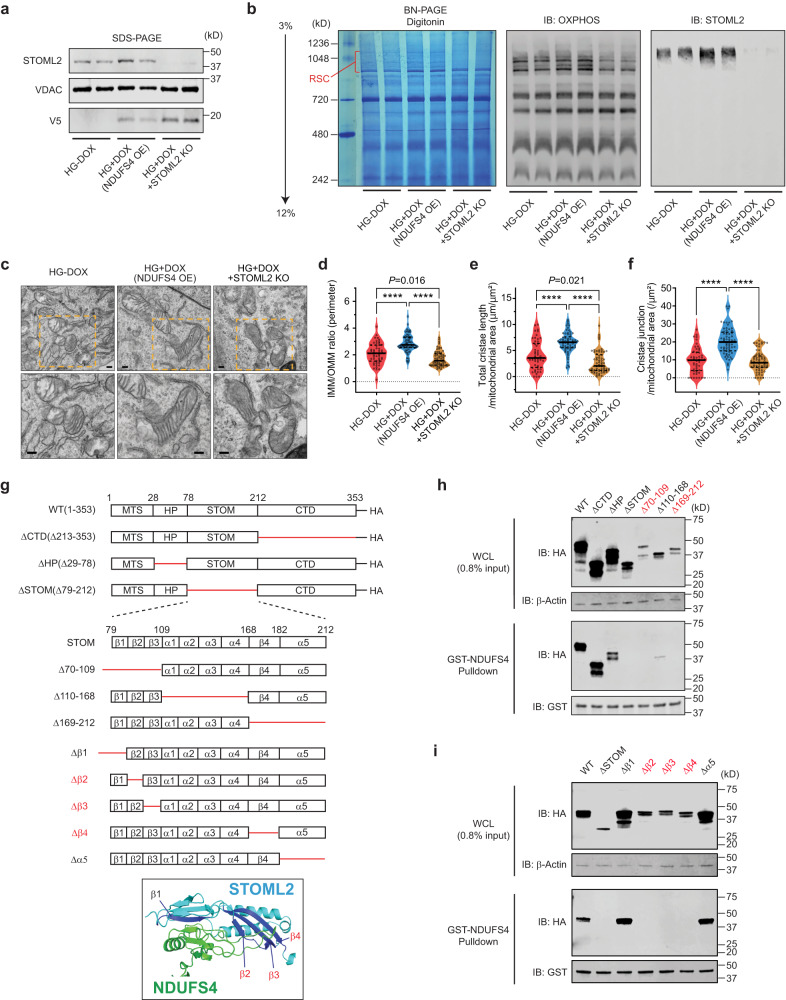
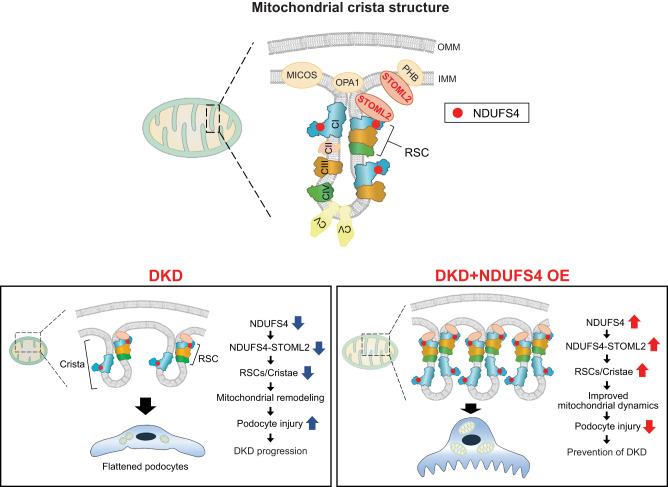
The mitochondrial electron transport chain (ETC) is a highly adaptive process to meet metabolic demands of the cell, and its dysregulation has been associated with diverse clinical pathologies. However, the role and nature of impaired ETC in kidney diseases remains poorly understood. Here, we generate diabetic mice with podocyte-specific overexpression of Ndufs4, an accessory subunit of mitochondrial complex I, as a model investigate the role of ETC integrity in diabetic kidney disease (DKD). We find that conditional male mice with genetic overexpression of Ndufs4 exhibit significant improvements in cristae morphology, mitochondrial dynamics, and albuminuria. By coupling proximity labeling with super-resolution imaging, we also identify the role of cristae shaping protein STOML2 in linking NDUFS4 with improved cristae morphology. Together, we provide the evidence on the central role of NDUFS4 as a regulator of cristae remodeling and mitochondrial function in kidney podocytes. We propose that targeting NDUFS4 represents a promising approach to slow the progression of DKD.


Conflict of interest statement

The authors declare no competing interests.

Figures

Fig. 1
Fig. 1. Reduced Ndufs4 expression in podocytes in DKD.
a Experimental workflow of quantification and comparison of mitoproteomes in primary mouse podocytes from diabetic Ins2Akita/+ vs. WT mice (pooled samples from 8 mice/group). b Heatmap illustrating log2 fold change in mitochondrial ETC protein abundance in diabetic Ins2Akita/+ vs. WT mice. c Aggregated abundance of ETC proteins in podocytes of WT vs. diabetic Ins2Akita/+ mice (n = 37 (CI), n = 3 (CII), n = 10 (CIII), n = 12 (CIV) subunits/group). Data are presented as median ± inter quartile range (IQR). d Rotenone-sensitive CI enzymatic activity in mitochondrial enriched samples isolated from primary podocytes (n = 3 (WT and Ins2Akita/+), n = 4 (Leprdb/m and Leprdb/db) independent experiments), where each sample was derived from a pool of podocyte mitochondria isolated from 4–6 mice). e Mitoproteomes of the most downregulated CI subunits in the podocytes of the diabetic Ins2Akita/+ mice (left panel) and a selection of reduced CI subunits (shown in Fig. 1b) validated by podocyte mitoproteomes from diabetic Leprdb/db mice (left lane on the right panel), qRT-PCR (2 center lanes on the right panel) of two murine diabetic models, and mRNA of CI subunits in diabetic patients with DKD obtained from Nephroseq v5 dataset (nephroseq.org; Ju CKD glom database). ns: not significant and n/a: not available. f Human CI structure highlighting the location of NDUFS4 (blue) in the N module of the matrix arm of CI. The structure visualization was rendered through UCSF ChimeraX software (www.rbvi.ucsf.edu/chimerax). g Left panel, representative immunoblots of NDUFS4 using mitochondria-enriched samples from primary podocytes of WT, Ins2Akita/+, Leprdb/+, and Leprdb/db mice. VDAC was used as a loading control. Right panel, densitometric analysis of western blots normalized to control levels (n = 4, each n represents a pool of mitochondria from 4 different mice). h Pearson’s correlation analysis of human NDUFS4 mRNA expression. Data obtained from Nephroseq v5 (n = 12). Median-centered Log2 values of eGFR are used for the analysis. i, j Pearson’s correlation of glomerular NDUFS4 immunostaining with eGFR (i) and urinary UACR (j) from diabetic subjects with DKD (n = 34). k Representative NDUFS4 immunostaining in glomeruli obtained from biopsies from healthy donors (n = 9) and DKD patients with (n = 29) or without albuminuria (n = 4). l Glomerular NDUFS4 immunostaining in biopsies from healthy donors and DKD individuals with different stages of glomerular involvement: Donors (n = 9), Glomerular (G)-class I DKD (n = 3), G-class IIa DKD (n = 5), G-class IIb DKD (n = 5), G-class III DKD (n = 14), G-class IV DKD (n = 6), Scale bars = 50 μm. Data are presented as mean ± SEM (d, g, k, l). ****P < 0.0001 by paired two-tailed t-test followed by Holm-Sidak test (c), unpaired two-tailed t test (d,g), two-tailed test for Pearson’s correlation (hj), one-way ANOVA with post-hoc Tukey–Kramer test (k, l), and test for linear trend analysis for different classifications of DKD (l). Source data are provided as a Source Data file.
Fig. 2
Fig. 2. Podocyte-specific Ndufs4 overexpression ameliorates DKD progression.
a Schematic depiction of the construct used to engineer podocyte-specific Ndufs4-transgenic mice (Ndufs4PodTg) (top), representative images of WT and transgenic mice (lower left), and PCR genotyping (lower right). b qRT-PCR of Ndufs4 mRNA in primary podocytes and podocytes-depleted samples isolated from 8-week-old WT and Ndufs4PodTg mice (n = 4). c A representative NDUFS4 immunoblot (left) and quantification of NDUFS4 protein expression (right) (n = 3). d Rotenone-sensitive CI enzymatic activity in mitochondrial-enriched samples isolated from primary podocytes of 8-week-old WT and Ndufs4PodTg mice (n = 3). Body weight (BW) (e, n = 12 mice/group), blood glucose (f, n = 8 (WT and Ndufs4PodTg), n = 10 (Ins2Akita/+), n = 11 (Ins2Akita/+;Ndufs4PodTg)), and UACR (g) in mice. h Area under the curve (AUC) of UACR shown in g (g, h, n = 7 (WT and Ndufs4PodTg), n = 10 (Ins2Akita/+), n = 11 (Ins2Akita/+;Ndufs4PodTg)). i Representative micrographs of Periodic acid-Schiff (PAS) stained kidney sections, podocyte morphology in transmission electron microscopy (TEM), scanning electron microscopy (SEM), and immunostaining of Wilms’ tumor 1 (WT1) (pink), Synaptopodin (green), and DAPI (blue). Scale bars = 50 μm in rows 1 and 4; 500 nm in rows 2 and 3. j Kidney weight (KW) per body weight (BW) of 26-week-old mice (n = 9 (WT), n = 10 (Ndufs4PodTg and Ins2Akita/+), n = 8 (Ndufs4PodTg;Ins2Akita/+)). k PAS positive area in glomeruli (n = 82–96 from 3 mice/group). l Glomerular basement membrane thickness (n = 100 areas of TEM images from 3 mice/group). m WT1 positive nuclei in glomeruli (n = 90–100 from 3 mice/group). Data are presented as mean ± SEM (bh, j) or median ± IQR (km, bold line: median, and dot line: IQR). ns not significant; ****P < 0.0001; unpaired two-tailed Welch’s t test (bd), one-way ANOVA with post-hoc Tukey–Kramer test (eh, j), or Kruskal–Wallis with post-hoc Dunn’s test (km). Source data are provided as a Source Data file.
Fig. 3
Fig. 3. Ndufs4 overexpression improves mitochondrial morphology in the diabetic environment.
a OCRs in primary podocytes. Dotted lines denote injections of oligomycin (2 μM), FCCP (2 μM), rotenone, and antimycin A (both 0.5 μM). Basal respiration (b), maximal respiration (c), ATP-linked OCR (d), and spare OCR (e) (ae, n = 6 (WT), n = 7 (Ins2Akita/+ and Ndufs4PodTg;Ins2Akita/+), n = 8 (Ndufs4PodTg), replicates/group). f Primary podocytes susceptibility to rotenone (left panel), and rotenone half maximal inhibition (IC50) (right panel, n = 6 replicates/group). g Representative glomerular CI activity assessed by NADH oxidase staining from kidney sections (left panel) in different group of mice (n = 60 from 3 mice/group, scale bar = 50 μm), and quantitative analysis using Image J software normalized to the median intensity of the WT (right panel). h Representative podocyte mitochondria from kidney tissues (top row) and pseudo-color superimposed images (middle row) to assess mitochondrial morphological changes, including aspect ratio (i), circularity (j), roundness (k), and feret diameter (l) (n = 312 (WT), n = 167 (Ins2Akita/+), n = 141 (Ndufs4PodTg) and n = 284 (Ndufs4PodTg;Ins2Akita/+), measurements from 3 mice/group). TEM micrographs from primary podocytes isolated from experimental mice (bottom row). Scale bars = 200 nm. Quantitative analyses of cristae number (m) and junction (n) normalized by mitochondrial area using TEM micrographs of primary podocytes isolated from mice (n = 45 mitochondria/group). o Representative images of mROS in primary podocytes assessed by mito-roGFP (Left panel). The heatmap shows the ratio of the oxidized to reduced roGFP signals in mitochondrial matrix. Quantification of mitochondrial redox states (right panel). (n = 20–22 cells/group). Scale bar = 10 μm. Total (p) and mitochondrial (q) ATP production rates in primary podocytes assessed by Seahorse Analyzer (n = 9 (WT), n = 8 (Ndufs4PodTg, Ins2Akita/+, and Ndufs4PodTg;Ins2Akita/+), replicates/group). Data are presented as mean ± SEM (af, p, q) or median ± IQR (g, io, bold line: median, and dot line: IQR). ****P < 0.0001. One-way ANOVA with post-hoc Tukey–Kramer test (bf, p, q), or Kruskal–Wallis with post-hoc Dunn’s test (g, io). Source data are provided as a Source Data file.
Fig. 4
Fig. 4. Cristae integrity and RSCs formation are restored by Ndufs4 overexpression.
Representative TEM micrographs of cristae morphology (a) and quantitative analyses of cristae density (bd) in podocytes cultured under NG (5.5 mM) or HG (25 mM) for 48hrs with DOX induction (NDUFS4 OE) or without DOX induction (n = 53–61 mitochondria/group, scale bars = 200 nm). IMM inner mitochondrial membrane, OMM outer mitochondrial membrane. e Cryo-ET analysis of purified mitochondria in DOX-inducible Ndufs4 transfected podocytes cultured under NG without DOX, HG without DOX, and HG with DOX induction (NDUFS4 OE). Slices through representative Cryo-ET tomograms are shown in upper panels and corresponding segmentations of characteristic features in lower panels (Scale bars = 200 nm). f Resolution of ETC complexes by BN-PAGE of mitochondria solubilized by digitonin from HG-DOX (control) or HG + DOX (NDUFS4 OE) podocytes. Left panel: Coomassie staining; right panel: Immunoblots with OXPHOS cocktail antibodies. RSC respiratory supercomplexes. g Representative CI in-gel activity of n-Dodecyl β-D-maltoside (DDM)-solubilized mitochondria isolated from the same cells as in Fig. 4f. h Immunodetection of NDUFS4 after SDS-PAGE of mitochondria proteins in cells from Fig. 4f. VDAC was used as a loading control. Data are presented as median ±IQR (Bold line: median, and dot line: IQR). ****P < 0.0001. Kruskal–Wallis with post-hoc Dunn’s test (bd). Cryo-ET analysis was performed two times and confirmed the reproducibility of cristae morphological change in 5 mitochondria from each group of cells. BN-GEL and the subsequent immunoblot were conducted two times independently to validate the reproducibility. Source data are provided as a Source Data file.
Fig. 5
Fig. 5. STOML2 interacts with NDUFS4.
a Schematic depiction of APEX2 proximity labeling followed by the LC-MS/MS analysis in podocytes transduced with a DOX-inducible NDUFS4-APEX2 chimeric construct. B biotin, IMM inner mitochondrial membrane, OMM outer mitochondrial membrane, RSC respiratory supercomplexes. b Volcano plots of NDUFS4-associated mitochondrial proteins identified by LC-MS/MS analysis. The average values of NDUFS4-APEX2 transfected podocytes without H2O2 and those without DOX induction are used as controls. Mitochondrial proteins significantly changing (FDR Q < 0.1) are depicted in colors. The dotted line indicates a cut off for significant changes based on FDR of 0.1. c NDUFS4 interactomes identified by the LC-MS/MS following APEX2 labeling. d Immunoblotting of STOML2, ATAD3, IMMT, and OPA1 in whole cell lysates (Input) and streptavidin pulldown samples. OPA1 was used as a negative control. e RSCs were excised (Band 1–5) from BN-PAGE, followed by LC/MS-MS analysis. f Heatmap of cristae organizing proteins in the RSCs from podocytes cultured in HG with DOX induction (HG + DOX) or without (HG-DOX). g Immunoblotting of OXPHOS, STOML2, ATAD3 and IMMT following BN-PAGE analysis as described in Fig. 5e. h Coimmunoprecipitation (Co-IP) of NDUFS4 and STOML2. HEK 293T cells were transiently transfected with Ndufs4-FLAG expression construct. Input was used as a positive control while IgG was used as a negative control (Ctrl), and anti-FLAG antibody was used for Co-IP. i GST affinity pulldown assay in HEK293T cells overexpressing a STOML2-HA fusion protein. j Representative images of NDUFS4 (red) and STOML2 (green) by STED analysis in cultured podocytes under the NG, HG, and HG plus NDUFS4 OE conditions (Scale bar = 5 μm). k Intensity-based colocalization expressed by Mander’s coefficient. M1 and M2 indicate the coefficient for NDUFS4 overlapping STOML2 and STOML2 overlapping NDUFS4, respectively (n = 6 cells). M2 coefficient was substantially lower than M1 since STOML2 as compared to NDUFS4 is more widely distributed both in cytoplasm and mitochondria. l Object-based colocalization expressed by percent colocalization (n = 6 cells). m Representative maximal intensity projection (MIP) images and detailed molecular images of NDUFS4 (red) and STOML2 (green) by STORM in cultured podocytes under the same conditions as shown in Fig. 5j. Scale bars: 10 μm (left panel) and 500 nm (right panel). n Percent colocalization based on the nearest neighboring distance (NND) < 40 nm (n = 4 cells). o Median NND (n = 4 cells). Data are presented as mean ± SEM. One-way ANOVA with post-hoc Tukey–Kramer test (k, l, n, o). Immunoblot experiments were performed two times independently to validate the reproducibility. Source data are provided as a Source Data file.
Fig. 6
Fig. 6. STOML2 is essential for NDUFS4-mediated improvement of RSCs formation and cristae remodeling.
a Immunoblot of STOML2 in DOX-inducible NDUFS4-V5 podocytes transduced with lentiviral CRISPR with nontargeting sgRNA control (HG + DOX) or with STOML2 targeted sgRNA (HG + DOX + STOML2KO); podocytes without Ndufs4 induction were used as control (HG-DOX). NDUFS4 was blotted with V5 tag antibody. b BN-PAGE of digitonin-solubilized mitochondrial proteins from the same cells as shown in Fig. 6a stained with Coomassie or immunoblotted (IB) with OXPHOS cocktail or STOML2 antibodies. RSC respiratory supercomplexes, DOX doxycycline. c Representative TEM micrographs of mitochondria in cells described in Fig. 6a, and cristae density measurements by IMM/OMM ratio (d), total cristae length (e) and cristae junction (f), (n = 50–65 mitochondria/group, scale bars = 200 nm). IMM inner mitochondrial membrane, OMM outer mitochondrial membrane. g Structure of mouse STOML2 wild type (WT) and deletion mutant constructs engineered with HA-tag at the C-terminus. MTS mitochondrial targeting sequence, HP hydrophobic hairpin, STOM stomatin, CTD C-terminal coiled-coil domain, β1–4 β1–4 strands in STOM domain, α1–5 α1–5 helices in STOM domain. Ribbon diagram in the box represents a protein-protein docking simulation of human STOML2 (blue) and NDUFS4 (green; in the context of human RSC). h, i GST pull-down assay from HEK293T cells overexpressing STOML2-HA fusion protein or deletion mutants. WT full length STOML2, ΔCTD deletion mutant of C-terminal domain, ΔHP deletion mutant of hydrophobic hairpin domain (Δ29–78), ΔSTOM deletion mutant of stomatin domain, Δ70–109 β1–3 deletion mutant, Δ110–168 α1–4 deletion mutant, Δ169–212 β4 strand and α5 helix deletion mutant (h). Δβ1–Δβ4 deletion mutants of individual β strand, Δα5 α5 deletion mutant (i). Data are presented as median ± IQR (Bold line: median, and dot line: IQR). ****P < 0.0001. Kruskal–Wallis with post-hoc Dunn’s test (df). Immunoblot experiments were performed two times independently to validate the reproducibility. Source data are provided as a Source Data file.
Fig. 7
Fig. 7. Schematics of NDUFS4-mediated cristae remodeling in DKD.
Normal crista structure (top) and proposed model depicting the remodeling of ETC in podocytes from diabetic condition (lower left), and how NDUFS4 OE restored the mitochondrial morphology and function (lower right). DKD diabetic kidney disease, IMM inner mitochondrial membrane, OMM outer mitochondrial membrane, RSC respiratory supercomplexes.

Update of

Similar articles

Cited by

References

    1. Kidney Disease: Improving Global Outcomes (KDIGO) Diabetes Work Group. KDIGO 2022 clinical practice guideline for diabetes management in chronic kidney disease. Kidney Int. 2022;102:S1–S127. doi: 10.1016/j.kint.2022.06.008. - DOI - PubMed
    1. Wanner C, et al. Empagliflozin and progression of kidney disease in type 2 diabetes. N. Engl. J. Med. 2016;375:323–334. doi: 10.1056/NEJMoa1515920. - DOI - PubMed
    1. Gerstein HC, et al. Cardiovascular and renal outcomes with efpeglenatide in type 2 diabetes. N. Engl. J. Med. 2021;385:896–907. doi: 10.1056/NEJMoa2108269. - DOI - PubMed
    1. Mohandes S, et al. Molecular pathways that drive diabetic kidney disease. J. Clin. Invest. 2023;133:e165654. doi: 10.1172/JCI165654. - DOI - PMC - PubMed
    1. Bhargava P, Schnellmann RG. Mitochondrial energetics in the kidney. Nat. Rev. Nephrol. 2017;13:629–646. doi: 10.1038/nrneph.2017.107. - DOI - PMC - PubMed

Substances