

Genetic architecture of the structural connectome
- PMID: 38438384
- PMCID: PMC10912129
- DOI: 10.1038/s41467-024-46023-2
Genetic architecture of the structural connectome
Abstract
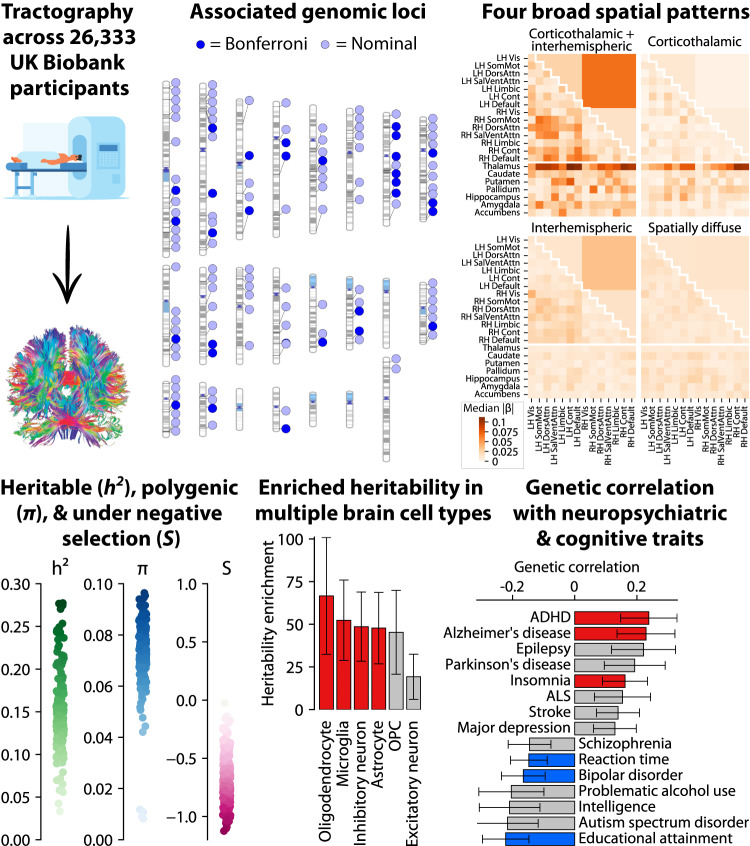
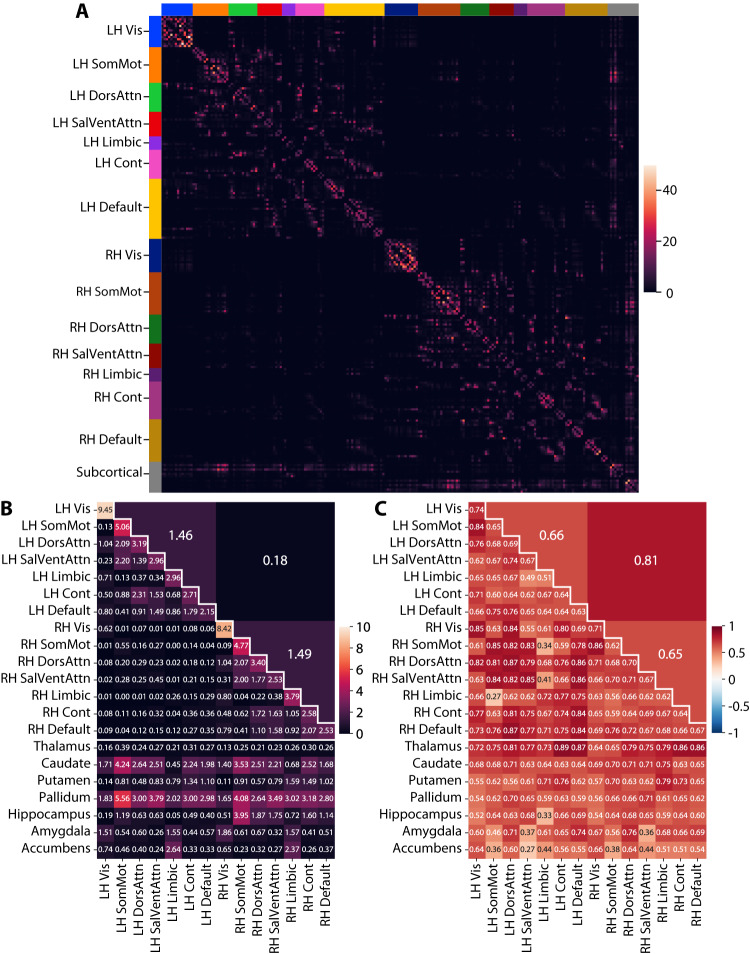
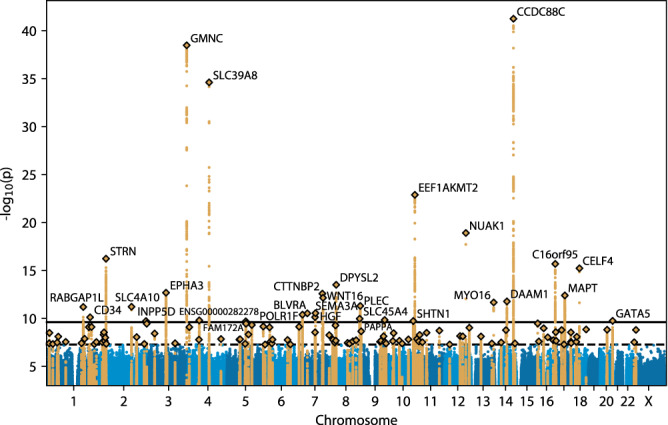
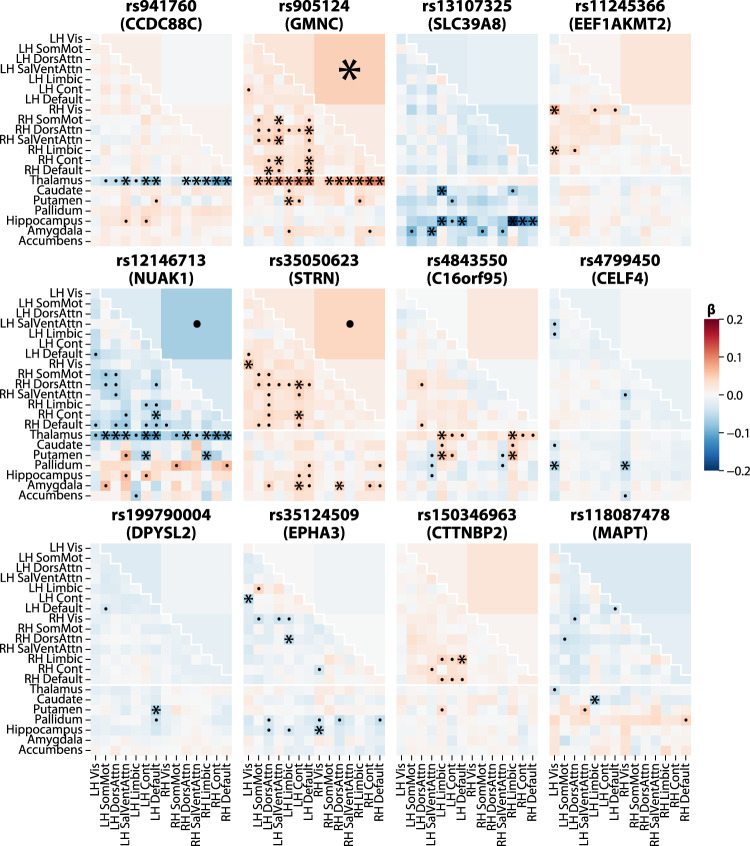
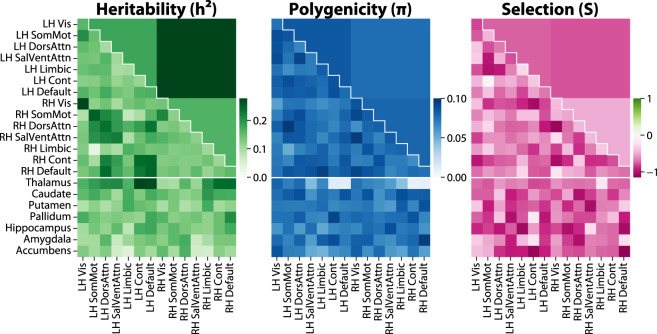
Myelinated axons form long-range connections that enable rapid communication between distant brain regions, but how genetics governs the strength and organization of these connections remains unclear. We perform genome-wide association studies of 206 structural connectivity measures derived from diffusion magnetic resonance imaging tractography of 26,333 UK Biobank participants, each representing the density of myelinated connections within or between a pair of cortical networks, subcortical structures or cortical hemispheres. We identify 30 independent genome-wide significant variants after Bonferroni correction for the number of measures studied (126 variants at nominal genome-wide significance) implicating genes involved in myelination (SEMA3A), neurite elongation and guidance (NUAK1, STRN, DPYSL2, EPHA3, SEMA3A, HGF, SHTN1), neural cell proliferation and differentiation (GMNC, CELF4, HGF), neuronal migration (CCDC88C), cytoskeletal organization (CTTNBP2, MAPT, DAAM1, MYO16, PLEC), and brain metal transport (SLC39A8). These variants have four broad patterns of spatial association with structural connectivity: some have disproportionately strong associations with corticothalamic connectivity, interhemispheric connectivity, or both, while others are more spatially diffuse. Structural connectivity measures are highly polygenic, with a median of 9.1 percent of common variants estimated to have non-zero effects on each measure, and exhibited signatures of negative selection. Structural connectivity measures have significant genetic correlations with a variety of neuropsychiatric and cognitive traits, indicating that connectivity-altering variants tend to influence brain health and cognitive function. Heritability is enriched in regions with increased chromatin accessibility in adult oligodendrocytes (as well as microglia, inhibitory neurons and astrocytes) and multiple fetal cell types, suggesting that genetic control of structural connectivity is partially mediated by effects on myelination and early brain development. Our results indicate pervasive, pleiotropic, and spatially structured genetic control of white-matter structural connectivity via diverse neurodevelopmental pathways, and support the relevance of this genetic control to healthy brain function.
© 2024. The Author(s).
Conflict of interest statement
The authors declare no competing interests.
Figures
Similar articles
-
Genetic architecture of the white matter connectome of the human brain.Sci Adv. 2023 Feb 17;9(7):eadd2870. doi: 10.1126/sciadv.add2870. Epub 2023 Feb 17. Sci Adv. 2023. PMID: 36800424 Free PMC article.
-
Disrupted developmental organization of the structural connectome in fetuses with corpus callosum agenesis.Neuroimage. 2015 May 1;111:277-88. doi: 10.1016/j.neuroimage.2015.02.038. Epub 2015 Feb 26. Neuroimage. 2015. PMID: 25725467
-
Frontal cortical regions associated with attention connect more strongly to central than peripheral V1.Neuroimage. 2021 Sep;238:118246. doi: 10.1016/j.neuroimage.2021.118246. Epub 2021 Jun 7. Neuroimage. 2021. PMID: 34111516 Free PMC article.
-
Comparative Primate Connectomics.Brain Behav Evol. 2018;91(3):170-179. doi: 10.1159/000488886. Epub 2018 Aug 10. Brain Behav Evol. 2018. PMID: 30099461 Review.
-
Where the genome meets the connectome: Understanding how genes shape human brain connectivity.Neuroimage. 2021 Dec 1;244:118570. doi: 10.1016/j.neuroimage.2021.118570. Epub 2021 Sep 8. Neuroimage. 2021. PMID: 34508898 Review.
Cited by
-
Multi-trait association analysis reveals shared genetic loci between Alzheimer's disease and cardiovascular traits.Nat Commun. 2024 Nov 13;15(1):9827. doi: 10.1038/s41467-024-53452-6. Nat Commun. 2024. PMID: 39537608 Free PMC article.
-
Cross-omics risk scores of inflammation markers are associated with all-cause mortality: The Canadian Longitudinal Study on Aging.Am J Hum Genet. 2025 Aug 7;112(8):1892-1905. doi: 10.1016/j.ajhg.2025.06.009. Epub 2025 Jul 8. Am J Hum Genet. 2025. PMID: 40633542
-
Brain wiring economics, network organisation and population-level genomics.Imaging Neurosci (Camb). 2025 Jun 4;3:IMAG.a.31. doi: 10.1162/IMAG.a.31. eCollection 2025. Imaging Neurosci (Camb). 2025. PMID: 40800854 Free PMC article.
-
Uncovering the multivariate genetic architecture of frailty with genomic structural equation modeling.Nat Genet. 2025 Aug;57(8):1848-1859. doi: 10.1038/s41588-025-02269-0. Epub 2025 Aug 4. Nat Genet. 2025. PMID: 40759756
-
Association Between Glaucoma and Brain Structural Connectivity Based on Diffusion Tensor Tractography: A Bidirectional Mendelian Randomization Study.Brain Sci. 2024 Oct 17;14(10):1030. doi: 10.3390/brainsci14101030. Brain Sci. 2024. PMID: 39452042 Free PMC article.
References
-
- Purves, D. et al. Increased Conduction Velocity as a Result of Myelination. in Neuroscience. 2nd edition (Sinauer Associates, 2001).
MeSH terms
Substances
LinkOut - more resources
Full Text Sources
Miscellaneous
