

Trends of Body Mass Index changes among adults on antiretroviral therapy in Northwest Ethiopia: a longitudinal data analysis
- PMID: 38438418
- PMCID: PMC10912088
- DOI: 10.1038/s41598-024-53701-0
Trends of Body Mass Index changes among adults on antiretroviral therapy in Northwest Ethiopia: a longitudinal data analysis
Abstract
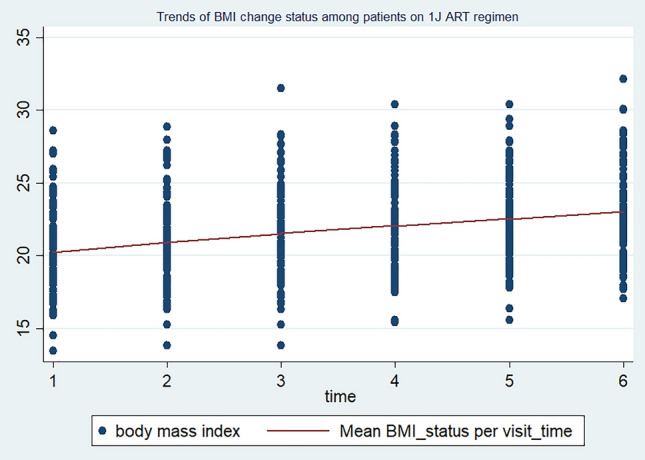
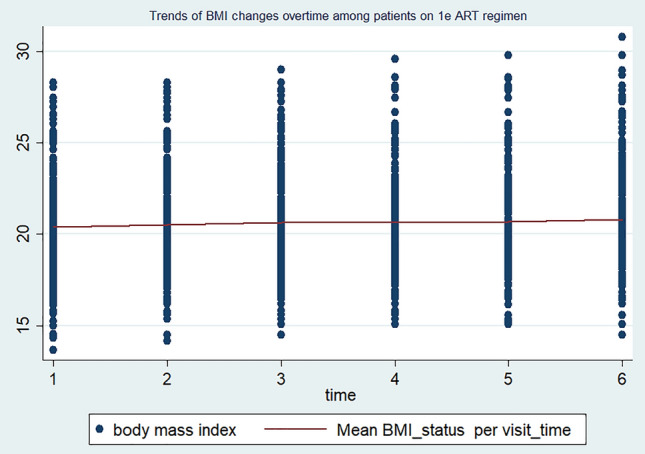
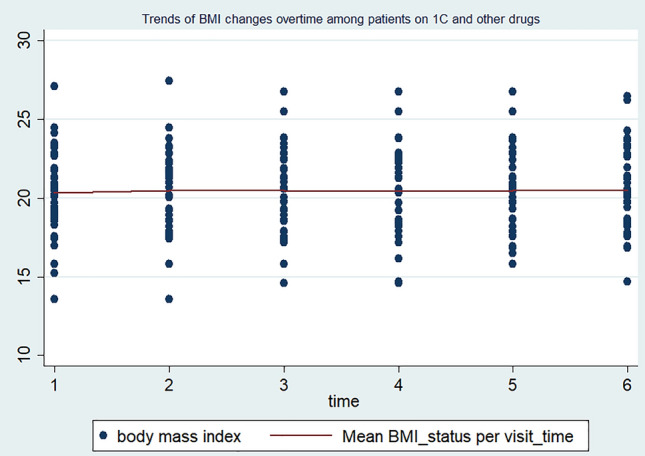
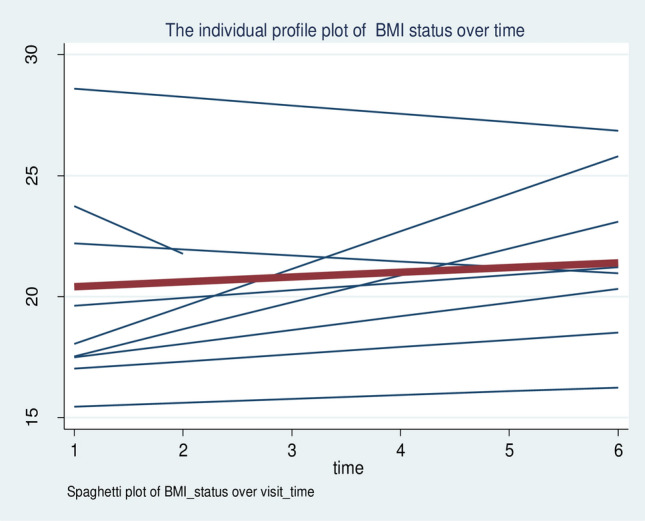
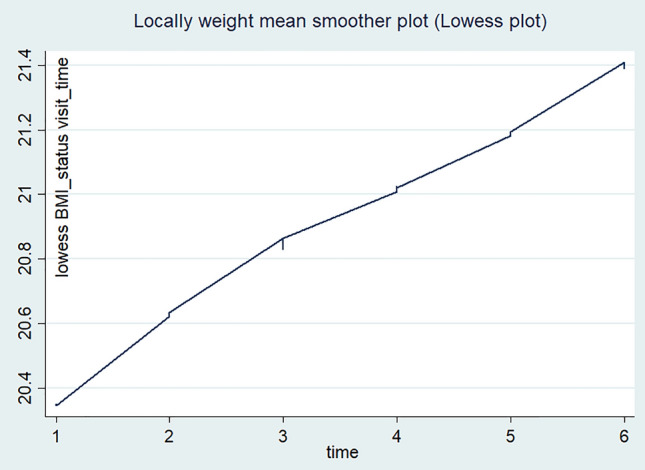
Nutritional status is considered a major diagnostic and prognostic indicator of HIV/AIDS in adults. In this aspect, current HIV-treatment guidelines, particularly in low-income countries, recommend the regular monitoring of body mass index (BMI) to determine patients' clinical response to antiretroviral therapy (ART). However, data regarding the change in BMI status of HIV-positive adults on ART following the implementation of the test and treat strategy were limited in Ethiopia. Hence, this study is aimed at investigating the trends of BMI change over time and its associated factors among HIV-positive adults in Northwest Ethiopia. A retrospective longitudinal study was conducted among 404 randomly selected HIV-positive adults receiving ART in Felegehiwot Comprehensive Specialized Hospital (FHCSH), Northern Ethiopia. Data were extracted from the medical record charts of study participants, entered into Epi-data 4.6 software, and exported to Stata 14.2 software for analysis. A generalized estimating equation (GEE) model was fitted to determine the change in BMI status over time and its predictors in HIV-positive adults. The level of significance was declared at a p-value of < 0.05. More than half (201, or 51.73%) of the total 404 participants were female. In the cohort, both the baseline and follow-up mean body mass index levels of the participants fell in the normal range and increased from 20.34 (standard deviation/SD ± 2.8) to 21.41 (SD ± 3.13). The individual profile plots of 50 participants indicated that there is considerable variability in weight change across individuals. Duration of ART follow-up (β = 0.203, 95% confidence interval (CI) 0.16 to 0.24), unemployment (β = - 0.96, 95% CI 1.67 to - 0.25), WHO stage III/IV HIV disease (β = - 0.92, 95% CI - 1.57 to - 0.35),and Tenofovir/Lamivudine/Dolutegravir (TDF/3TC/DTG)ART regimen (β = 0.95, 95% CI 0.32 to 1.57) were identified as significant predictors of change in the BMI status of participants. Likewise, the interaction of TDF/3TC/DTG ART regimen * follow-up duration (β = 2.16, 95% CI 1.84 to 2.84), WHO stage III/IV clinical disease * follow-up duration (β = - 1.43, 95% CI - 1.71 to - 1.15) and TB/HIV co-infection * follow-up duration (β = 1.89, 95% CI 1.57 to 2.87) significantly affects the trend in BMI change status of HIV-positive adults. In this study, the BMI status of HIV-positive adults receiving ART increased with a linear trend. Unemployment, stage III/IV HIV diseases, and Tenofovir/Lamivudine/Efavirenz (TDF/3TC/EFV) ART-drug regimen decreases the mean BMI status of HIV-positive adults. Special consideration and strict follow-up need to be given to those individuals with advanced HIV/AIDS diseases and other identified risk group.
© 2024. The Author(s).
Conflict of interest statement
The authors declare no competing interests.
Figures
Similar articles
-
Assessment of weight gain in adult patients living with HIV receiving first-line dolutegravir-based or efavirenz-based ART regimens in routine care clinics in Tshwane district, South Africa: An observational study.HIV Med. 2024 Jul;25(7):826-839. doi: 10.1111/hiv.13638. Epub 2024 Mar 22. HIV Med. 2024. PMID: 38520085 Free PMC article.
-
Dolutegravir plus lamivudine versus efavirenz plus tenofovir disoproxil fumarate and lamivudine in antiretroviral-naive adults with HIV-1 infection.BMC Infect Dis. 2022 Jan 4;22(1):17. doi: 10.1186/s12879-021-06991-y. BMC Infect Dis. 2022. PMID: 34983415 Free PMC article.
-
Therapeutic drug monitoring study on the switch from coformulated 600-mg efavirenz, tenofovir disoproxil fumarate, and emtricitabine to coformulated 400-mg efavirenz, tenofovir disoproxil fumarate, and lamivudine among HIV-positive patients with viral suppression.J Microbiol Immunol Infect. 2021 Oct;54(5):944-951. doi: 10.1016/j.jmii.2020.06.010. Epub 2020 Jul 7. J Microbiol Immunol Infect. 2021. PMID: 32675042
-
Doing More With Less: Review of Dolutegravir-Lamivudine, a Novel Single-Tablet Regimen for Antiretroviral-Naïve Adults With HIV-1 Infection.Ann Pharmacother. 2020 Dec;54(12):1252-1259. doi: 10.1177/1060028020933772. Epub 2020 Jun 9. Ann Pharmacother. 2020. PMID: 32517480 Review.
-
A review of the virological efficacy of the 4 World Health Organization-recommended tenofovir-containing regimens for initial HIV therapy.Clin Infect Dis. 2012 Mar;54(6):862-75. doi: 10.1093/cid/cir1034. Clin Infect Dis. 2012. PMID: 22357809 Free PMC article. Review.
Cited by
-
Weight changes among antiretroviral therapy-naïve people living with human immunodeficiency virus in Lagos, Nigeria.Front Public Health. 2025 May 13;13:1545676. doi: 10.3389/fpubh.2025.1545676. eCollection 2025. Front Public Health. 2025. PMID: 40433484 Free PMC article.
References
-
- World Health Organizations (WHO). Nutritional requirements for people living with HIV/AIDS , Report of a technical consultation (WHO, 13–15 May 2003). https://apps.who.int/iris/bitstream/handle/10665/42853/9241591196.pdf;js...
-
- World Health Organization (WHO) Guideline Updates on the Management of Severe Acute Malnutrition in Infants and Children. WHO; 2013. - PubMed
MeSH terms
Substances
LinkOut - more resources
Full Text Sources
Medical
