

High methane ebullition throughout one year in a regulated central European stream
- PMID: 38438465
- PMCID: PMC11310342
- DOI: 10.1038/s41598-024-54760-z
High methane ebullition throughout one year in a regulated central European stream
Erratum in
-
Author Correction: High methane ebullition throughout one year in a regulated central European stream.Sci Rep. 2024 Mar 27;14(1):7266. doi: 10.1038/s41598-024-57907-0. Sci Rep. 2024. PMID: 38538724 Free PMC article. No abstract available.
Abstract
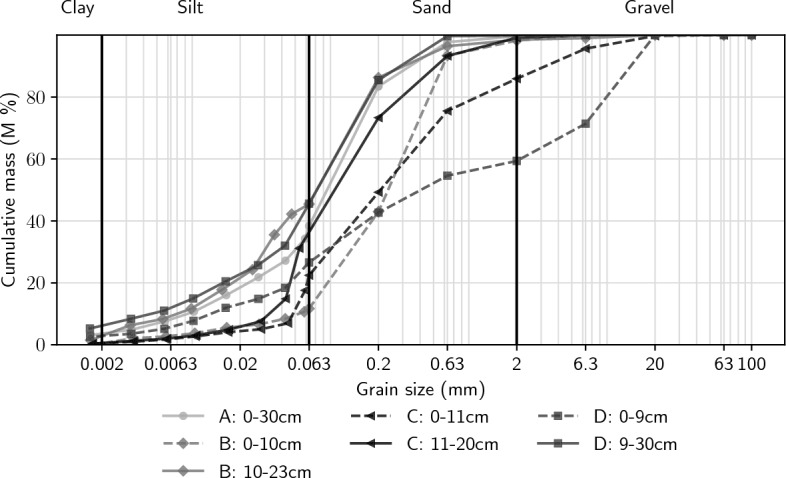
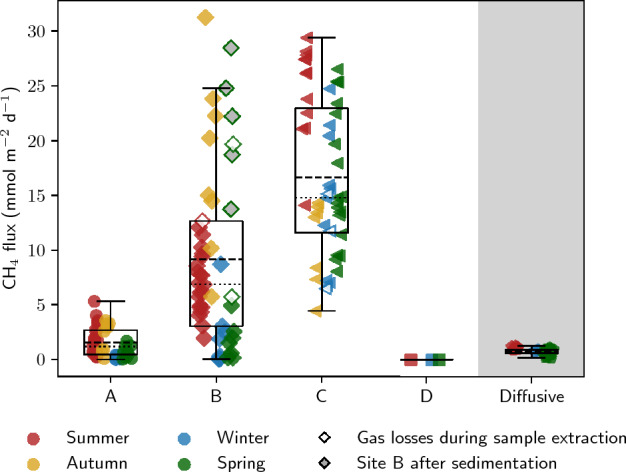
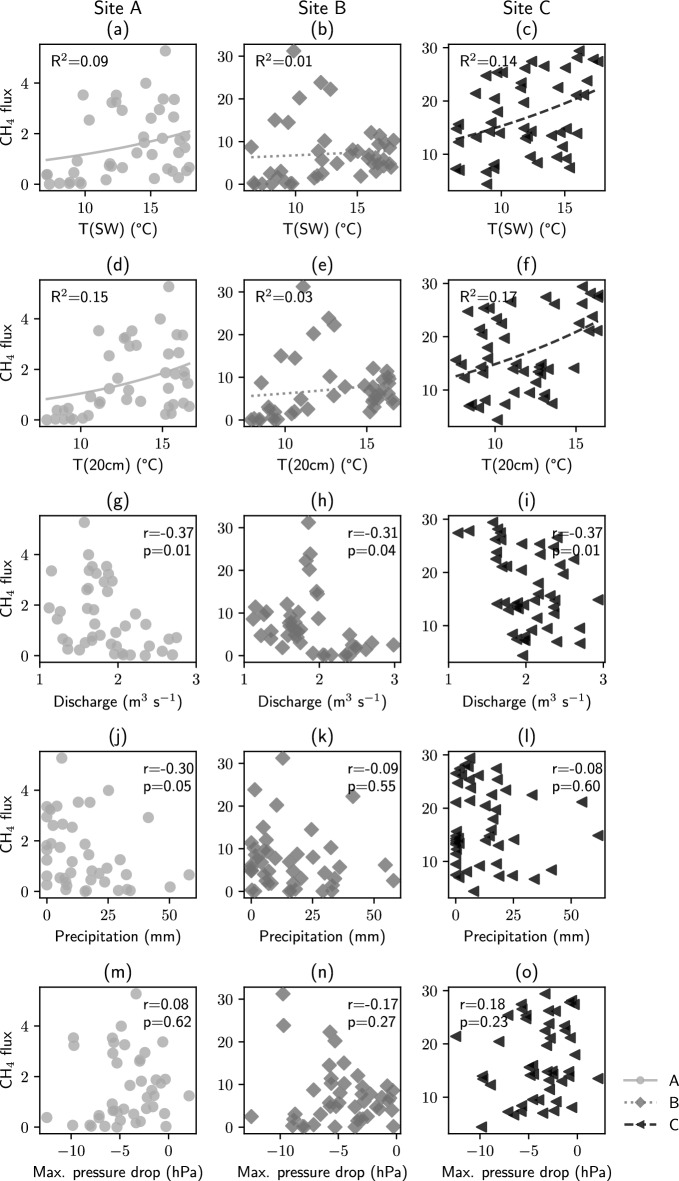
Ebullition transports large amounts of the potent greenhouse gas methane (CH ) from aquatic sediments to the atmosphere. River beds are a main source of biogenic CH , but emission estimates and the relative contribution of ebullition as a transport pathway are poorly constrained. This study meets a need for more direct measurements with a whole-year data set on CH ebullition from a small stream in southern Germany. Four gas traps were installed in a cross section in a river bend, representing different bed substrates between undercut and slip-off slope. For a comparison, diffusive fluxes were estimated from concentration gradients in the sediment and from measurements of dissolved CH in the surface water. The data revealed highest activity with gas fluxes above 1000 ml m d in the center of the stream, sustained ebullition during winter, and a larger contribution of ebullitive compared to diffusive CH fluxes. Increased gas fluxes from the center of the river may be connected to greater exchange with the surface water, thus increased carbon and nutrient supply, and a higher sediment permeability for gas bubbles. By using stable isotope fractionation, we estimated that 12-44% of the CH transported diffusively was oxidized. Predictors like temperature, air pressure drop, discharge, or precipitation could not or only poorly explain temporal variations of ebullitive CH fluxes.
© 2024. The Author(s).
Conflict of interest statement
The contact author has declared that none of the authors has any competing interests.
Figures


References
-
- Ripple, W. J. et al. World scientists’ warning of a climate emergency 2022. Bioscience72, 1149–1155. 10.1093/biosci/biac083 (2022).10.1093/biosci/biac083 - DOI
-
- IPCC. Climate change 2021: The physical science basis. working group i contribution to the sixth assessment report of the intergovernmental panel on climate change. Tech. Rep., Intergovernmental Panel of Climate Change, Cambridge, United Kingdom and New York, NY, USA (2021). 10.1017/9781009157896.
-
- Saunois, M. et al. The global methane budget 2000–2017. Earth Syst. Sci. Data12, 1561–1623. 10.5194/essd-12-1561-2020 (2020).10.5194/essd-12-1561-2020 - DOI
-
- Stanley, E. H. et al. The ecology of methane in streams and rivers: patterns, controls, and global significance. Ecol. Monogr.86, 146–171. 10.1890/15-1027 (2016).10.1890/15-1027 - DOI
-
-
Bange, H. W. et al. Nitrous oxide (N
 O) and methane (CH
 ) in rivers and estuaries of northwestern Borneo. Biogeosciences16, 4321–4335. 10.5194/bg-16-4321-2019 (2019).10.5194/bg-16-4321-2019
-
DOI
) in rivers and estuaries of northwestern Borneo. Biogeosciences16, 4321–4335. 10.5194/bg-16-4321-2019 (2019).10.5194/bg-16-4321-2019
-
DOI
-
Bange, H. W. et al. Nitrous oxide (N
LinkOut - more resources
Full Text Sources
